How To create Diagrams for Amazon Web Services architecture
Useful for:
- Create Web Application Architecture
- Architect infrastructure based on AWS® (Amazon Web Services)
- Design application services based on AWS® (Amazon Web Services)
- Design auto-scalable architecture
- Design for elastic compute cloud
- Illustrate whitepapers and presentations
- Create vector graphics files

Sample 1. Amazon Web Service diagram:
2-Tier Auto-scalable Web Application Architecture in 1 AZ
This diagram was created in ConceptDraw DIAGRAM using the Amazon Web Services Architecture Diagram library from the AWS Architecture Diagrams solution.
This sample diagram using the AWS - Amazon Web Services Architecture Diagrams Solution shows the type of icons and graphics you can use to illustrate your network architecture - these are universally recognized icons for this popular resource. Our solution helps make designing communication networks efficicent and easy to digest.
TEN RELATED HOW TO's:
Creating a detailed network plan can cause a lot of headache to an unexperienced user. And it is worth mentioning that ConceptDraw DIAGRAM is a decent tool for creating a network diagram, a tool that is easy-to-use. To get an accurate diagram use the vector shapes from the special libraries that represent workstations, network appliances, wiring systems and connect them with smart-connectors, just as simple as that.
This communication network diagram displays the way different components of a computer network communicate with each other. When representing network information, such as depicting all the equipment in a large network, it is helpful to make visual representation. Network diagram provides an easy way to show the way the connections between an equipment in a large network. This diagram of a communication network depicts a network composed of three sub-networks. It uses a network equipment symbols to represent the different devices that make up a network communication including routers, Ethernet devices and end-point equipment.
Picture: ConceptDraw DIAGRAM Network Diagram Tool
Related Solution:
The AWS Architecture Diagrams solution includes icons, sample and templates for several Amazon Web Services products and resources, to be used when creating architecture diagrams. The icons are designed to be simple so that you can easily incorporate them in your diagrams and put them in your whitepapers, presentations, datasheets, posters or any technical material you like.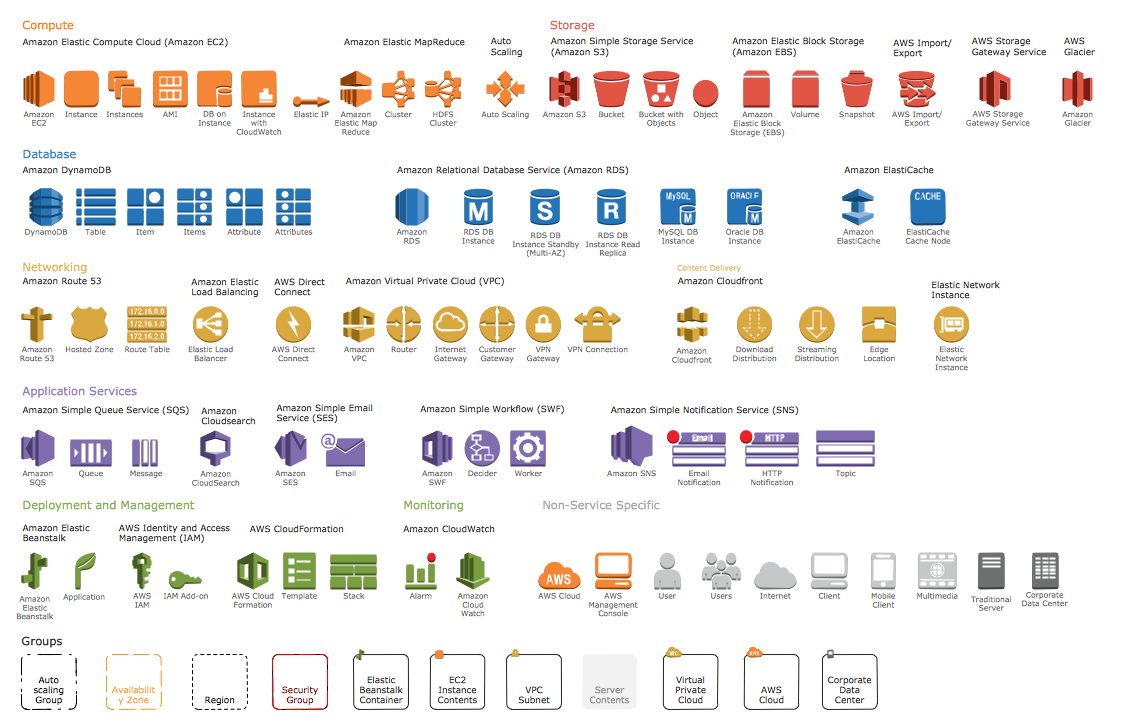
Picture: AWS Simple Icons for Architecture Diagrams
Drawing ISG Network Diagram using ConceptDraw DIAGRAM stencils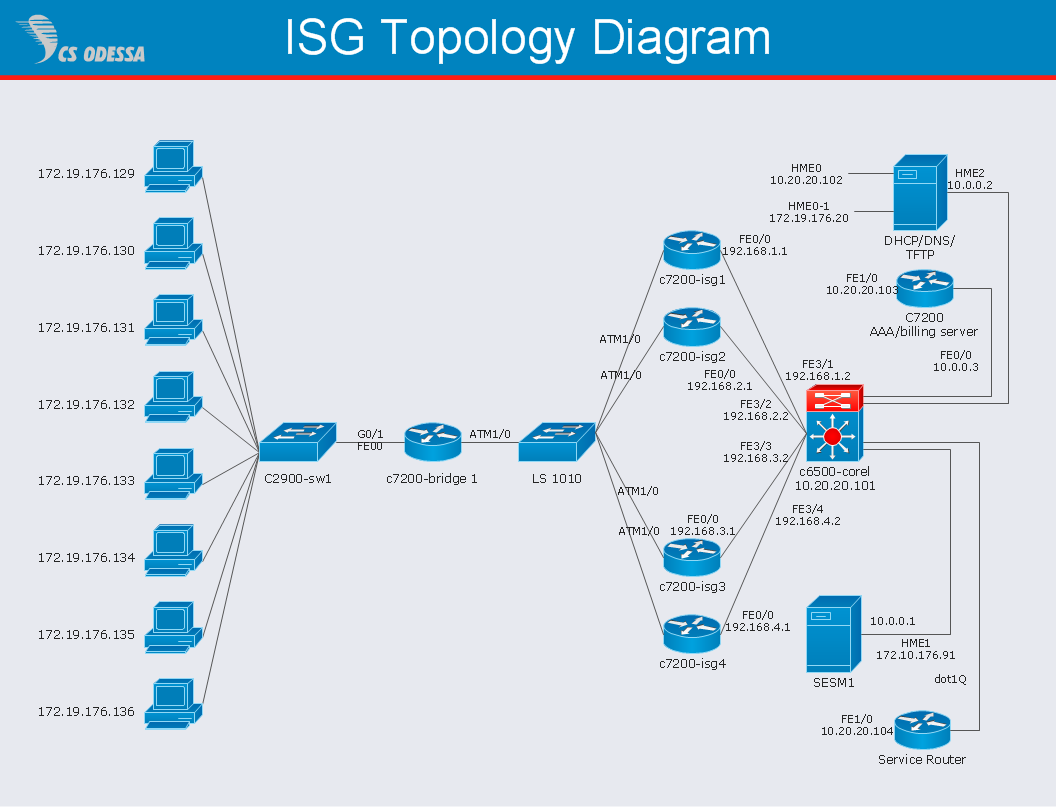
Picture: Network Diagram SoftwareISG Network Diagram
Computer networks nowadays are spread all across the world. The large number of parameters, such as geographic scale or communication protocols, can divide networks. One of the most common types of networks is called local area network (LAN). It convenient to represent network examples by means of diagrams.
This local area network (LAN) diagram provides an easy way to see the way the devices in a local network are interacted. The diagram uses a library containing specific symbols to represent network equipment , media and the end-user devices such as computers (PC, mac, laptop) , network printer, hubs, server and finally a modem. There are two types of network topologies: physical and logical. The current diagram represents precisely a physical type of LAN topology because it refers to the physical layout of a local network equipment.
Picture:
What is a Local Area Network?
Examples of LAN Diagrams
Related Solution:
Nodes of any computer network are somehow organized in a hierarchy or a layout. Some of the common layouts like star network topology are more reliable and some like ring topology withstand high loads better. It is also important to distinguish logical topologies from physical.
This diagram represents a typical view of the star network topology. The star network topology is one of the most frequently used network topologies in the majority of office and home networks. It is very popular because of its low cost and the easy maintenance. The plus of the star network topology is that if one computer on the local network is downed, this means that only the failed computer can not send or receive data. The other part of the network works normally. The minus of using star network topology is that all computers are connected to a single point-switch, or hub. Thus, if this equipment goes down, the whole local network comes down.
Picture: Star Network Topology
Related Solution:
ConceptDraw solution Computer and Networks provides Interactive Voice Response samples, templates and library of 35 vector stencils for drawing the IVR network diagrams.
Use ConceptDraw DIAGRAM diagramming and vector drawing software enhanced with solution Computer and Networks to visualize the logical and physical structure of IVR systems for inbound and outbound call centers and voice mail systems.
Picture: Interactive Voice Response Network Diagram
ConceptDraw DIAGRAM is perfect for software designers and software developers who need to draw IVR Network Diagrams.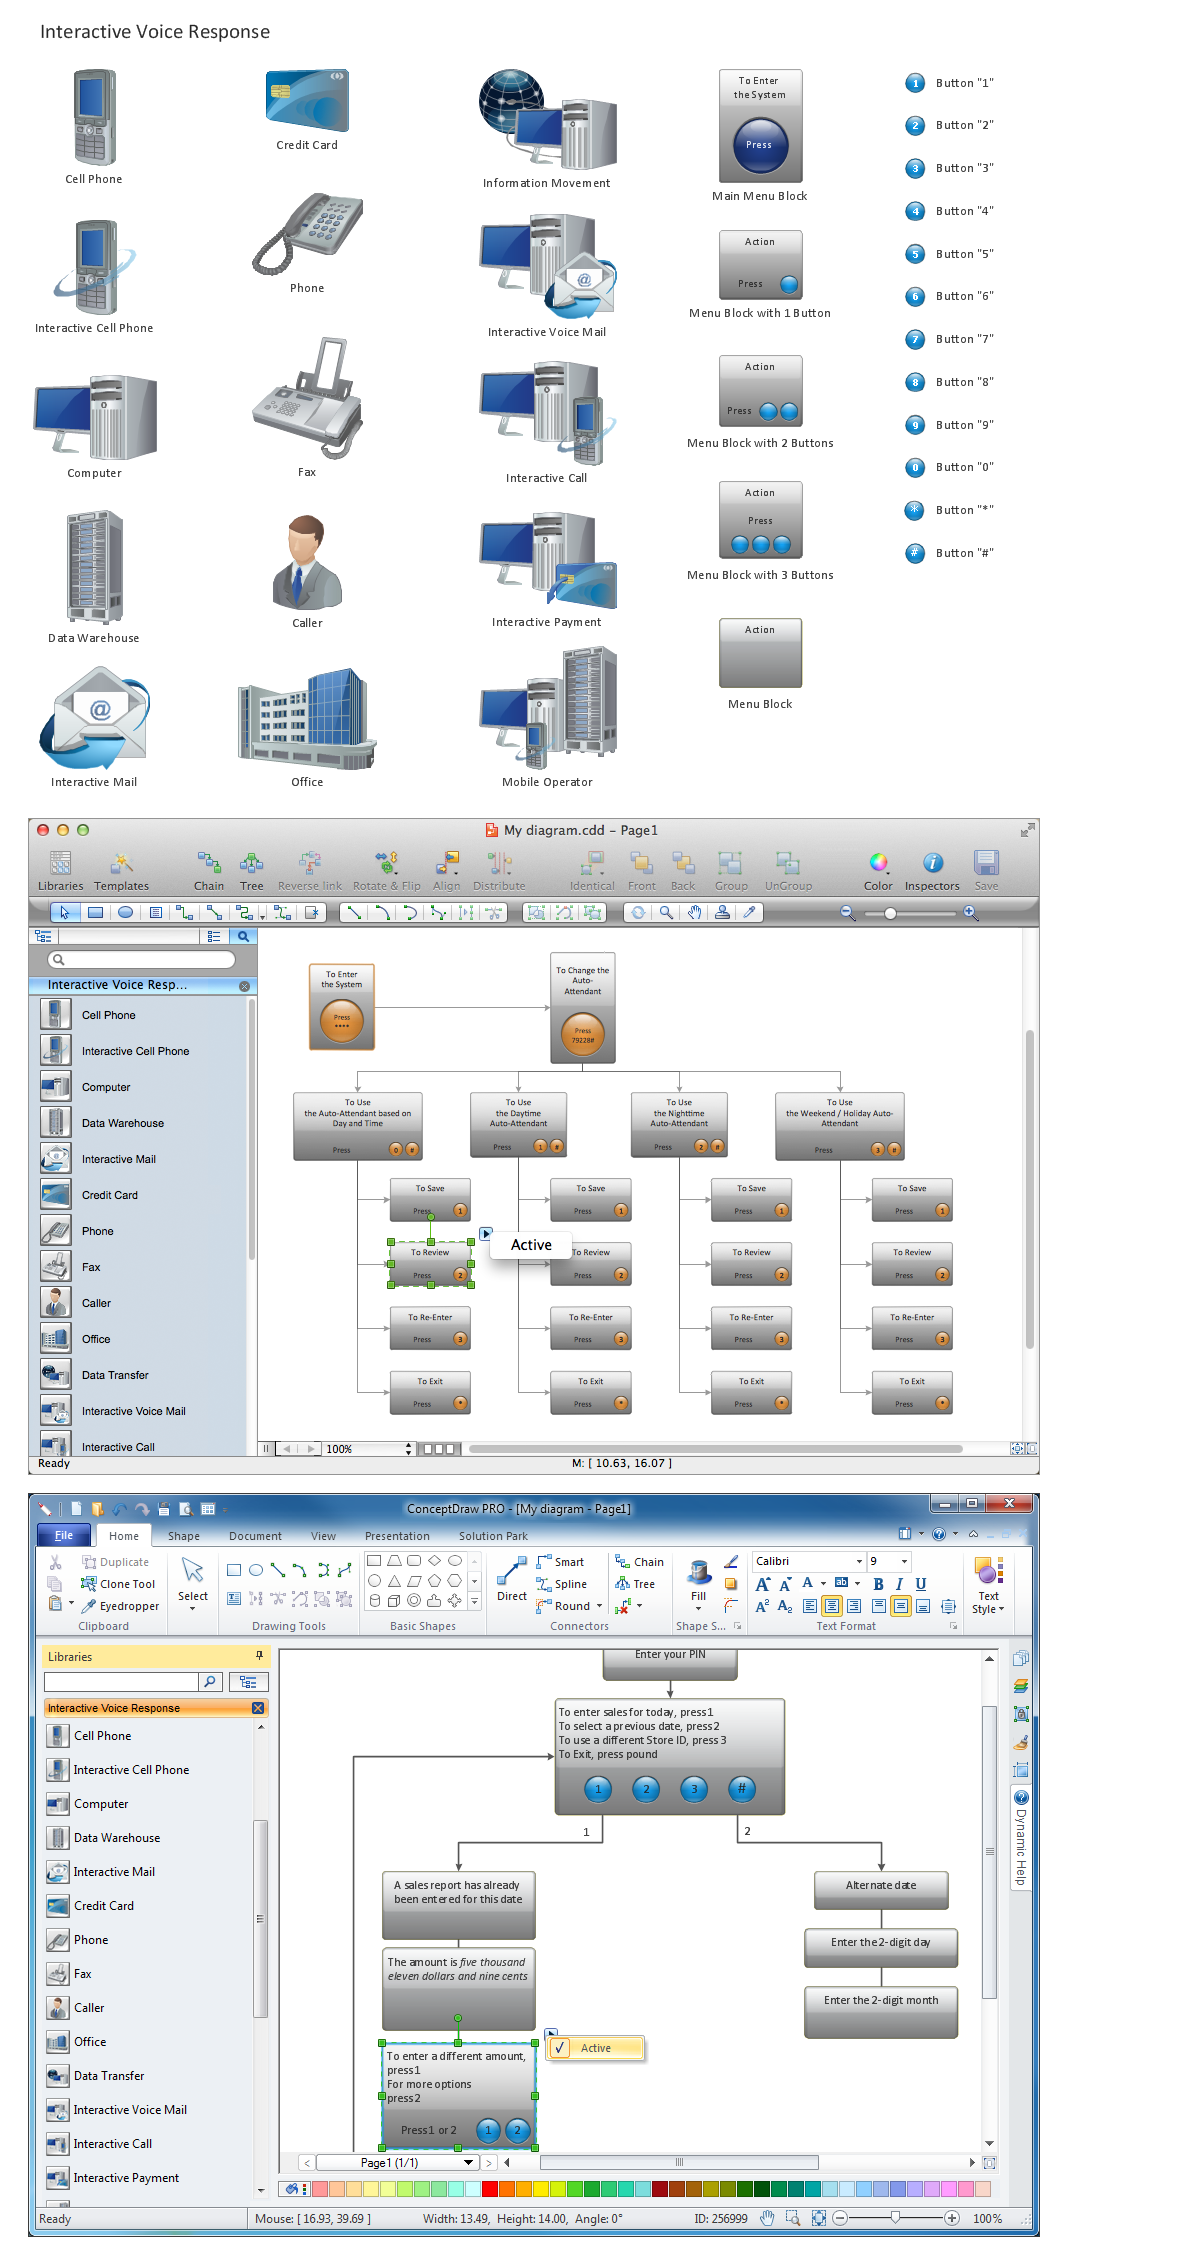
Picture: Network Diagramming Software for Design IVR Network Diagrams
Electrical plan is a document that is developed during the first stage of the building design. This scheme is composed of conventional images or symbols of components that operate by means of electric energy. To simplify the creation of these schemes you can use house electrical plan software, which will not require a long additional training to understand how to use it. You only need to install the necessary software ant it’s libraries and you’ll have one less problem during the building projection.
Any building contains a number of electrical systems, including switches, fixtures, outlets and other lightening equipment. All these should be depicted in a building electrical plans and included to general building documentation. This home electrical plan displays electrical and telecommunication devices placed to a home floor plan. On the plan, each electrical device is referenced with the proper symbol. Electrical symbols are used for universal recognition of the building plan by different persons who will be working on the construction. Not all possible electric symbols used on a certain plan, so the symbols used in the current home plan are included to a legend. The electrical home plan may be added as a separate document to a complete set of building plans.
Picture: How To use House Electrical Plan Software
Related Solution:
Storage icons - Amazon AWS pro diagrams - AWS diagrams are part of architecturing tools provided with ConceptDraw Solution Park.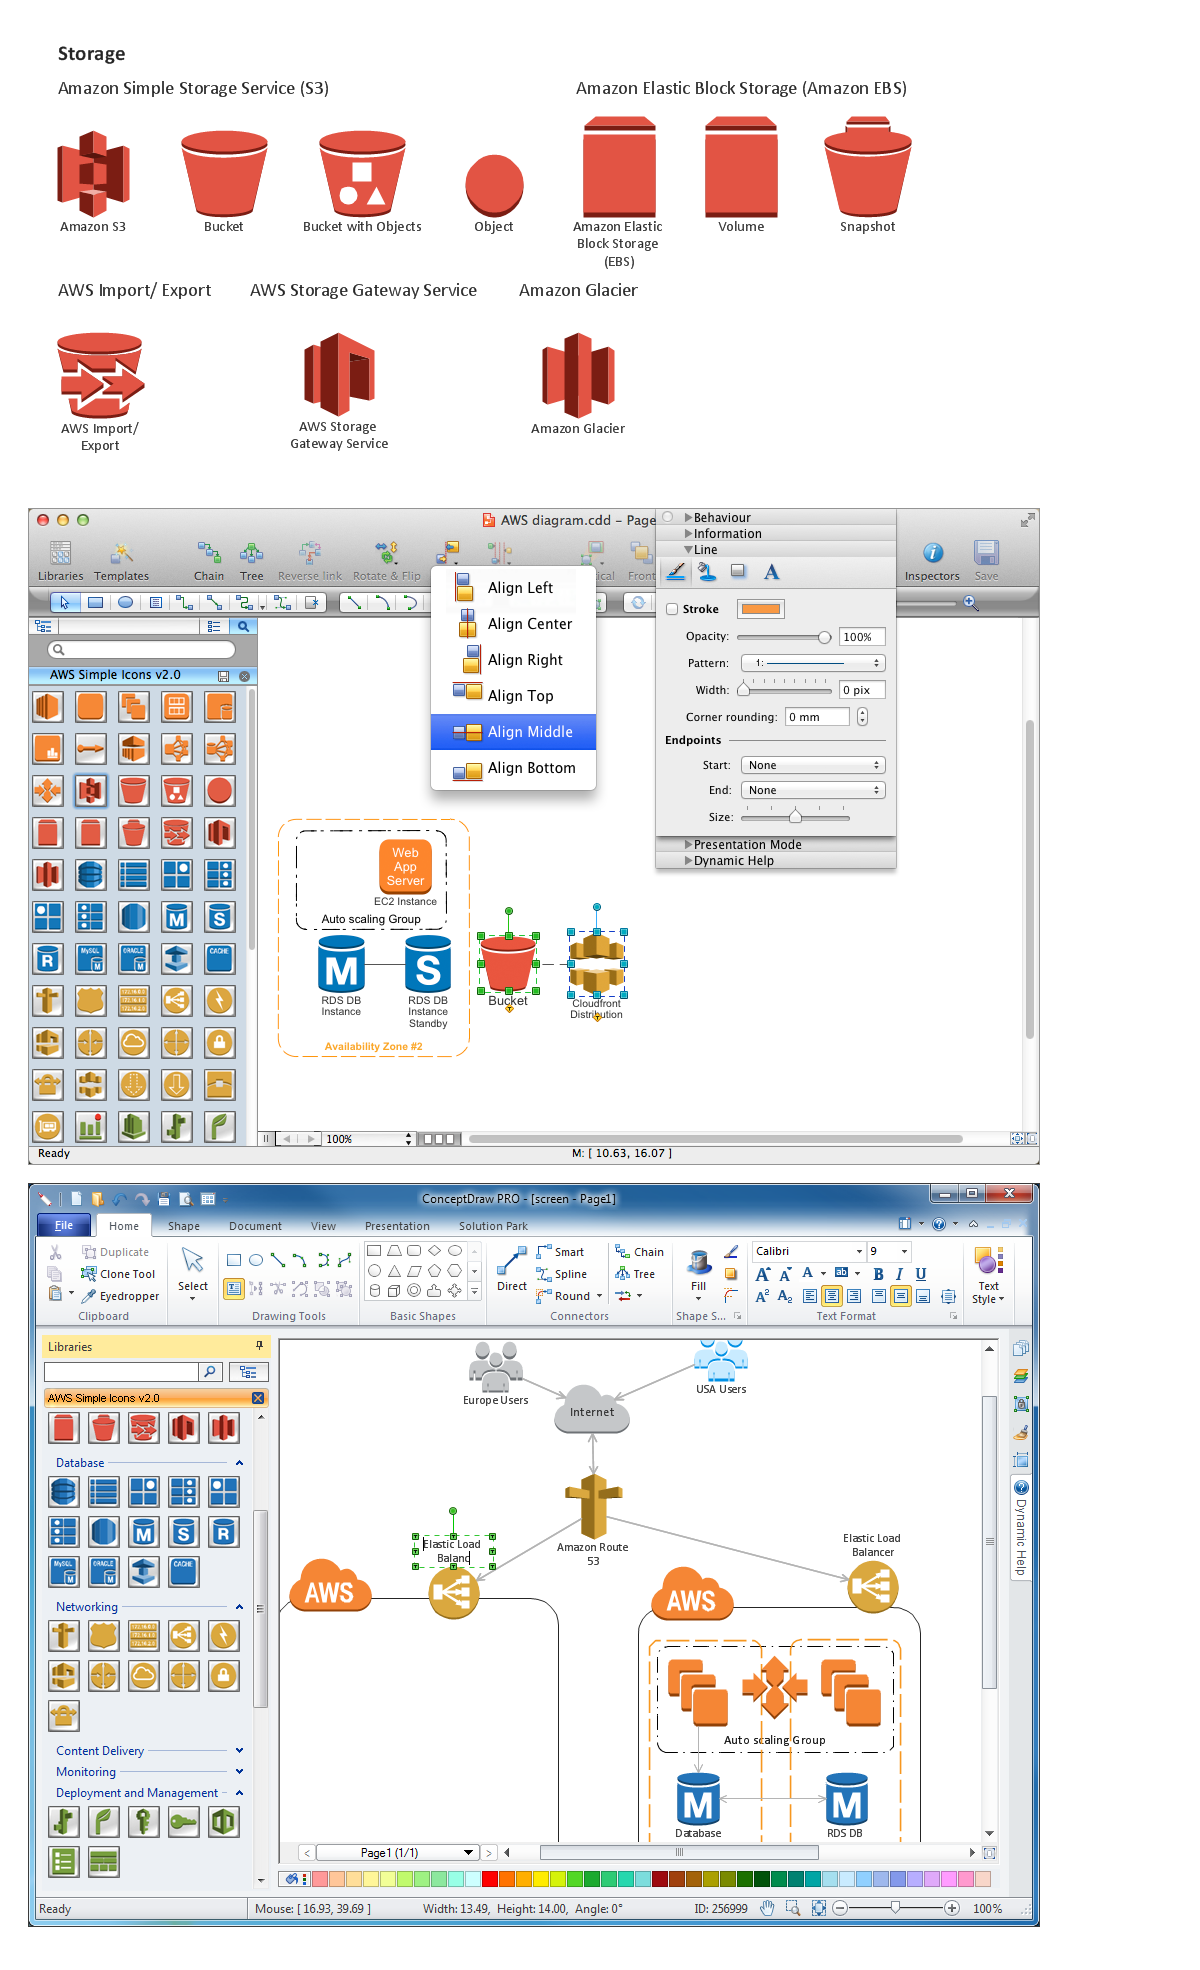
Picture: Diagramming software for Amazon Web Service icon set: Storage
DataBase icons - Amazon AWS pro diagrams - AWS diagrams are part of architecturing tools provided with ConceptDraw Solution Park.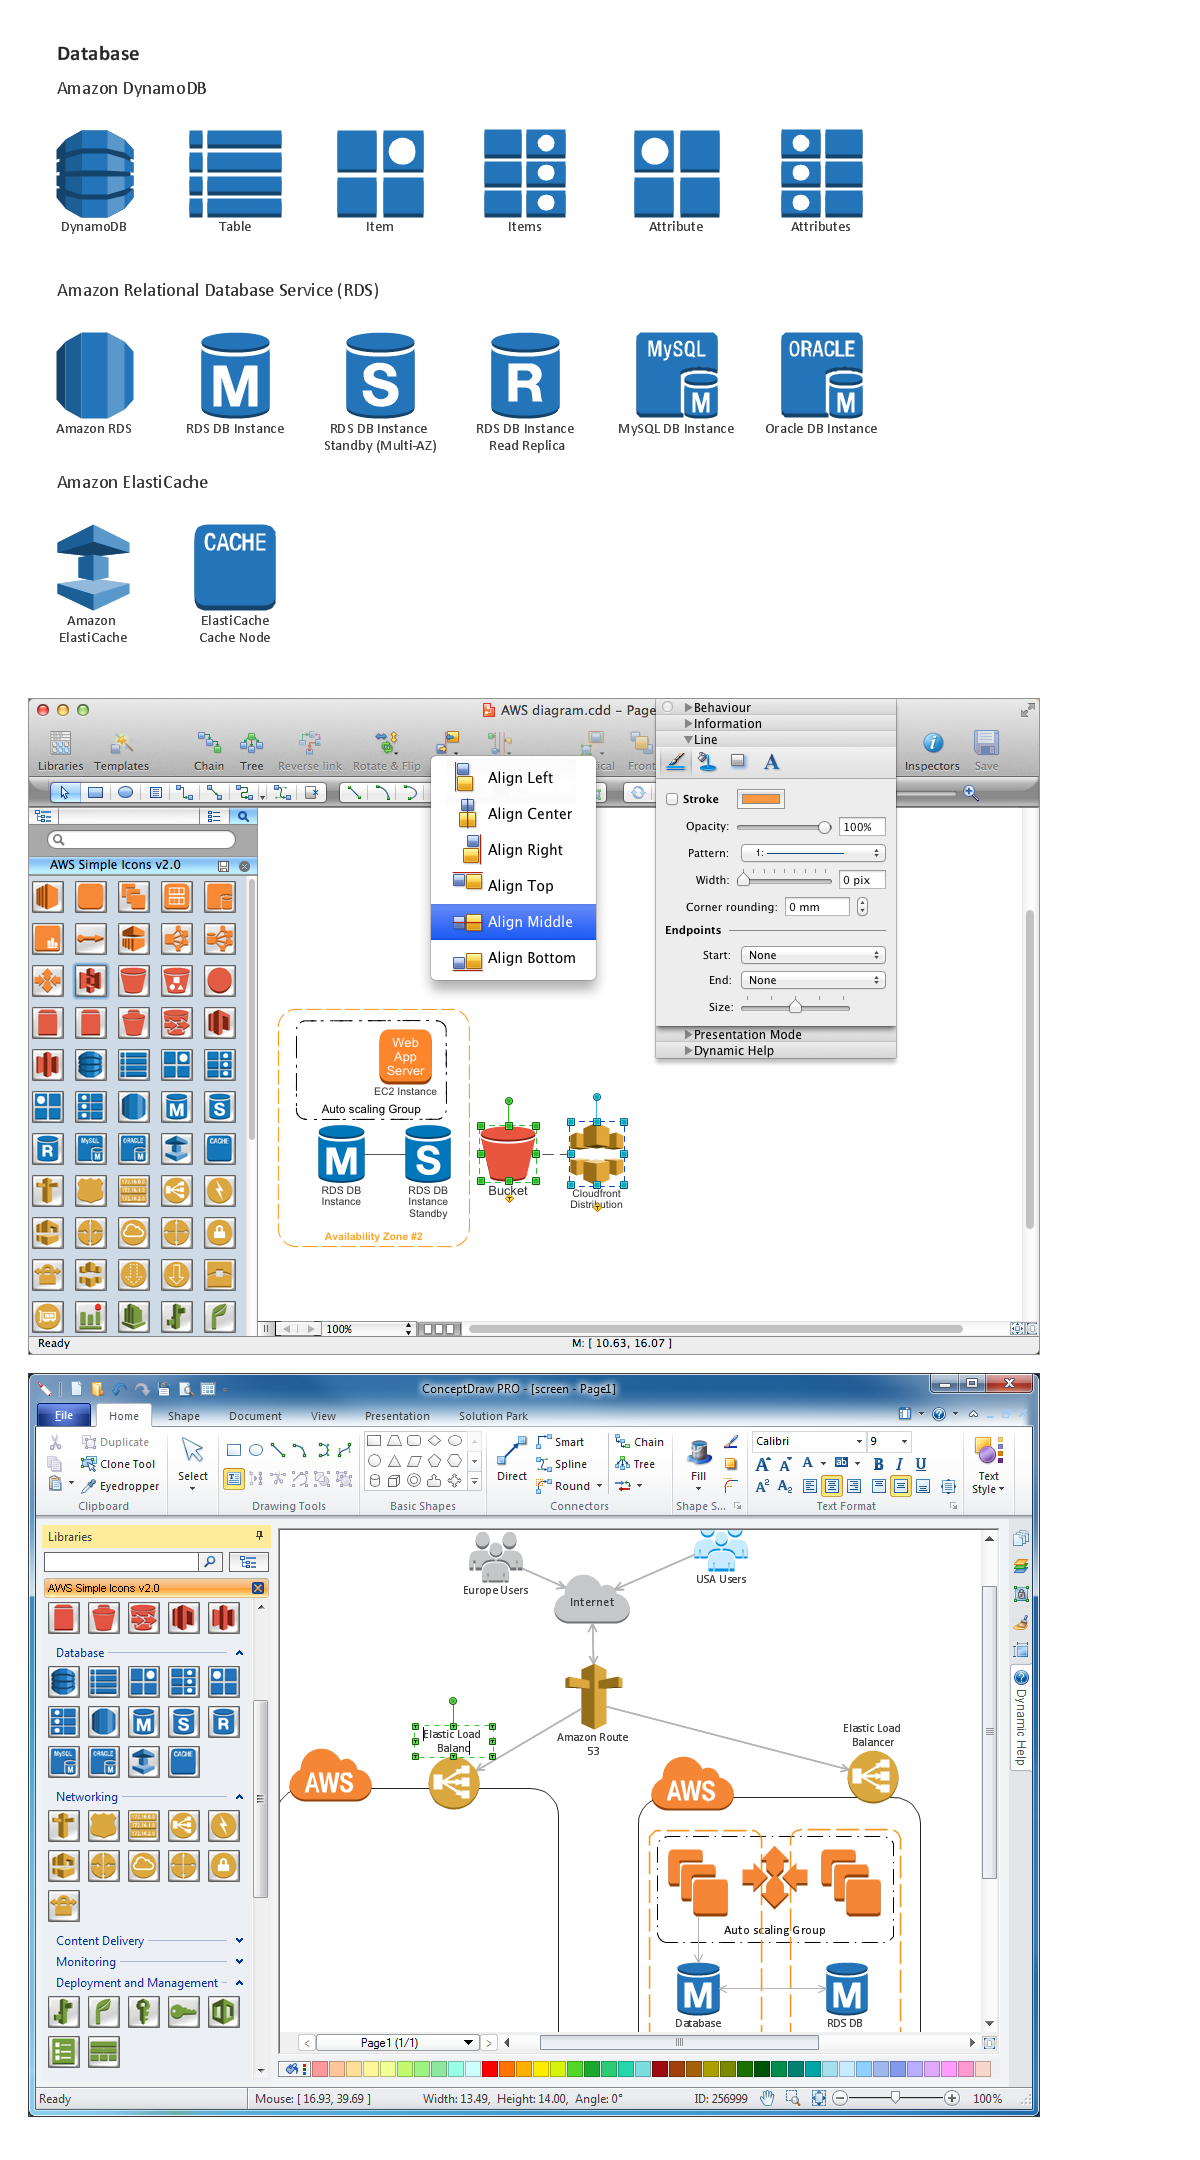
Picture: Diagramming software for Amazon Web Service icon set: Data Base
ConceptDraw
DIAGRAM 18