Functional Block Diagram
Functional block diagram in one of the types of the block diagram and it is very commonly used in the systems engineering field of activity as well as in software engineering by the IT specialists. If you are one of them, you might be interested in what exactly this diagram can be used for and so to get to know if you need to make it or not.
A functional block diagram as one of the types of existing block diagrams can be used for describing the functions and relationships between different elements within one particular system. Such functional block diagram can be used for illustrating the functions of one system using blocks to represent the elements of this system. It can also show the input and the output elements of a block using the lines. It can show the relationships between different functions as well as functional sequences and paths for matter or signals.
This type of the block diagrams can include the additional schematic symbols in order to show the particular properties. These functional block diagrams are very often necessary for being used in complex systems in order to understand the way some particular system works and so the relationships within this particular system are. With help of this diagram it is obvious to see each of the elements of a system and the way it functions in general as a whole.
The functional block diagram, which is a type of the block diagrams, can be represented as a combination of an ordinary functional block diagram and a flow chart at the same time. You can use one of so many different specific functional block diagrams technics in order to build different software development methodologies. A functional block diagram can be a very good example to the graphical language for the programmable controllers design used in the industrial computing field of business activity. That is because a functional block diagram is one of the languages (and there are five of them existing) for logic or control configuration, e.g. Programmable Logic Controller (PLC) or a Distributed Control System (DCS).
There are other languages, which are: ladder logic, sequential function chart, structured text and instruction list, but in case you want to use function block diagram, you have to make it first of all. In order to create a function block diagram, you can make your own graphic symbols and stencils or you can use already previously made design elements by those who know all about drawing such kinds of diagrams – the IT specialists with lots of years of experience in making similar icons. Having ConceptDraw DIAGRAM software on your desktop means having an opportunity to use these pre-made design symbols for your own drawings.
Downloading ConceptDraw DIAGRAM with ConceptDraw STORE (which is another product of CS Odessa) means getting all you need for making great looking drawings, such as charts, flowcharts, plans, schemes and diagrams, including all kinds of block diagrams. This ConceptDraw STORE application allows you to choose all of the solutions you need for making great looking charts, flowcharts, diagrams, schemes, etc.
Block diagram was named this way for the reason. Looking at its final version it is obvious to see that it is made of blocks, at least two. Making it is quite simple, but it can still take lots of time unless you use ConceptDraw DIAGRAM as well as its solutions. In each solution CS Odessa team provides there is at least one stencil libraries with all of the design elements you need for creating a great looking and professional drawing. Having such libraries means having pretty much everything for making the smart looking diagrams. Block Diagrams Solution contains 5 libraries with a variety of pre-designed vector objects. This is simple maker of Functional Block Diagram of any complexity.
Creating of a Functional Block Diagram requires a lot of attention and you will definitely want to focus on the structure of your diagram itself, rather than on the process of creating your own individual objects. All of the vector block elements, which potentially can be used while creating such diagram, were already created by the IT specialists of CS Odessa and they are available in the libraries of our Block Diagrams Solution.
You can use any of five stencil libraries from that Block Diagrams Solution, including Block Diagrams Library, Blocks with Perspective Library, Raised Blocks Library, Callouts Library and Connectors Library. Block diagrams library includes such elements, as Rectangle, Square, Rounded rectangle, Filleted rectangle, Circle, Ellipse, Curved Rectangle, Hexagon, Diamond, Octagon, Round Starburst, Starburst, Sharp starburst, Blunt starburst, Cloud, File, Tag, Table, Document, Partial layers, Brackets and parentheses, Add-on step block, Concentric layers, bars, Auto-height textboxes, etc.
There are all together 5 libraries which contain 190 vector stencils in the Block Diagrams solution, which can be downloaded both from ConceptDraw STORE or from this site. Another stencil library is called Blocks with Perspective one and it includes such design symbols, as Up arrow, Down arrow, Left arrow, Right arrow, Left/right arrow, Horizontal bar, closed both ends, Horizontal bar, open left end, Horizontal bar, open right end, Horizontal bar, open both ends, Vertical bar, close both ends, Vertical bar, open bottom end, Vertical bar, open top end, Vertical bar, open both ends, Up arrow, open, Down arrow, open, Left arrow, open, Right arrow, open, Up/down arrow, Elbow block, Square block, Frame block, Circle block and other.
You can also find the symbols called “Callouts” which represent what some people think or talk about, and for other purposes. Thus, you can find the Side line callout, Side line elbow, Annotation, Centre text callout, Bend callout, Braces with text, Callout, Balloon (Ellipse callout), Balloon (Rounded rectangle), Balloon (Cloud), Balloon (Ellipse), 2-D word balloon, Yellow note, Balloon horizontal, Balloon vertical, Angled stamp, Rounded stamp, etc.
You need design the Functional Block Diagram and dream to find the useful tools to draw it easier, quickly and effectively? ConceptDraw DIAGRAM offers the Block Diagrams Solution from the "Diagrams" Area which will help you!

Example 1. Functional Block Diagram — Porter's Five Forces Model
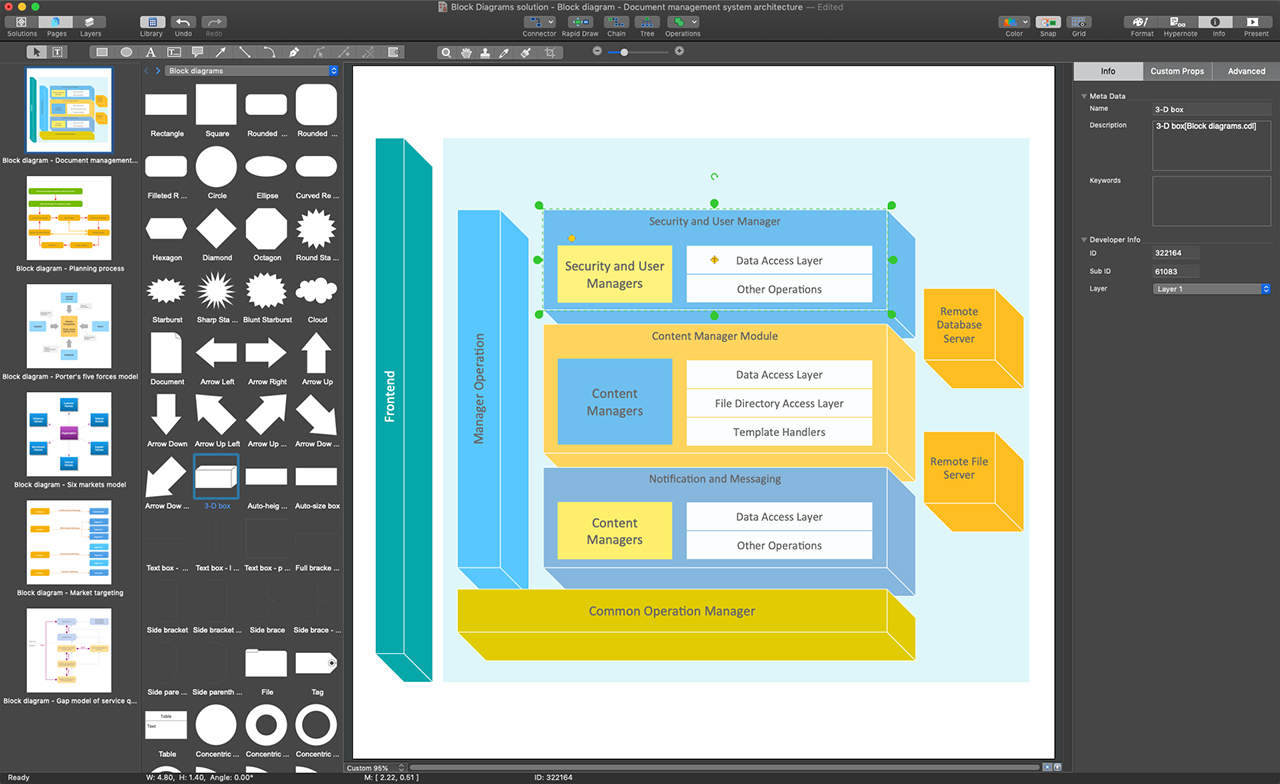
Creating of a Functional Block Diagram requires a lot of attention, you may focus on the structure of a diagram and not on the design of individual objects - all vector block elements have been created and are provided by the libraries of Block Diagrams Solution.


Block Diagrams Solution contains 5 libraries with variety of predesigned vector objects for fast and easy drawing Functional Block Diagram of any complexity.

Example 2. Block Diagrams Solution in ConceptDraw STORE
Another way of drawing a Functional Block Diagram in ConceptDraw DIAGRAM software is to use as the base the predesigned template or sample from the ConceptDraw STORE. The whole collection of templates and samples is available. It's very good start for you.

Example 3. Functional Block Diagram — Automotive HVAC System
The Functional Block Diagrams you see on this page were created in ConceptDraw DIAGRAM using the Block Diagrams Solution for ConceptDraw DIAGRAM An experienced user spent 10 minutes creating every of them.
Use the Block Diagrams Solution for ConceptDraw DIAGRAM software to create your own professional looking Functional Block Diagram of any complexity quick, easy and effective, and then successfully use it in your work activity.
All source documents are vector graphic documents. They are available for reviewing, modifying, or converting to a variety of formats (PDF file, MS PowerPoint, MS Visio, and many other graphic formats) from the ConceptDraw STORE. The Block Diagrams Solution is available for all ConceptDraw DIAGRAM or later users.