
Example 1. Block Diagram Software
Block Diagram Software with Block Diagrams Solution it's a powerful drawing tools, 5 libraries:
- Block Diagrams
- Blocks with Perspective
- Callouts
- Connectors
- Raised Blocks
with large number of predesigned vector shapes for drawing block diagrams and a lot of templates and samples. You can choose any sample or template from the offered in ConceptDraw STORE that meets your requirements and change it for your needs.

Example 2. Block Diagrams Solution in ConceptDraw STORE
If you can't find the required sample or template among the proposed, you can create new ConceptDraw document and draw your own Block Diagram from the beginning using the predesigned vector objects from the Block Diagrams Solution libraries.

Example 3. Block Diagram - Customer Decision Making
The following features make ConceptDraw DIAGRAM the best Block Diagram Software:
- You don't need to be an artist to draw professional looking diagrams in a few minutes.
- Large quantity of ready-to-use vector objects makes your drawing diagrams quick and easy.
- Great number of predesigned templates and samples give you the good start for your own diagrams.
- ConceptDraw DIAGRAM provides you the possibility to use the grid, rules and guides. You can easily rotate, group, align, arrange the objects, use different fonts and colors to make your diagram exceptionally looking.
- All ConceptDraw DIAGRAM documents are vector graphic files and are available for reviewing, modifying, and converting to a variety of formats: image, HTML, PDF file, MS PowerPoint Presentation, Adobe Flash, MS Visio.
- Using ConceptDraw STORE you can navigate through ConceptDraw Solution Park, managing downloads and updates. You can access libraries, templates and samples directly from the ConceptDraw STORE.
- If you have any questions, our free of charge support is always ready to come to your aid.
TEN RELATED HOW TO's:
The Wireless Network solution helps users to quickly transition from an idea to the implementation of a wireless computer network.
ConceptDraw DIAGRAM is well placed to provide experienced and comprehensive assistance in the workplace.
The vector stencils, examples, and templates included to solution is a strong toolset for network engineer.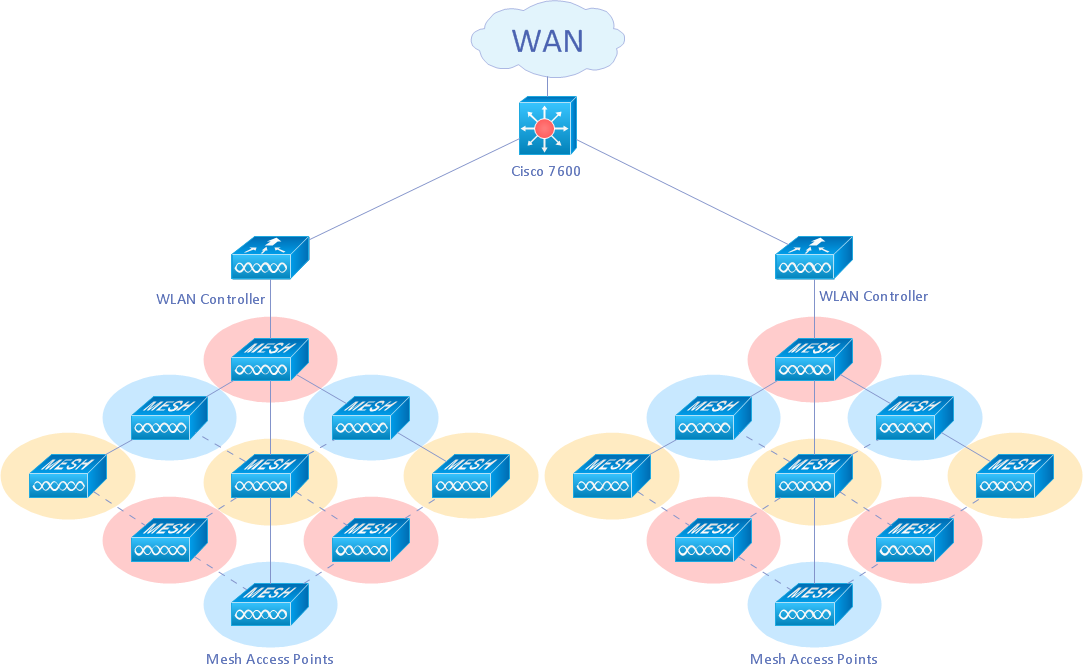
Picture: Wireless Network Drawing
Related Solution:
Block Diagrams solution makes ConceptDraw DIAGRAM a powerful system block diagram software. It enables you to work with all variety of tools you love in this software. The solution includes an enormous quantity of predesigned objects and connectors needed to design your Block Diagrams in minutes. The included templates and samples useful for a quick start. Use these tools to design extremely fast and simply Block Diagrams looking like those created by experts, even if you are a beginner.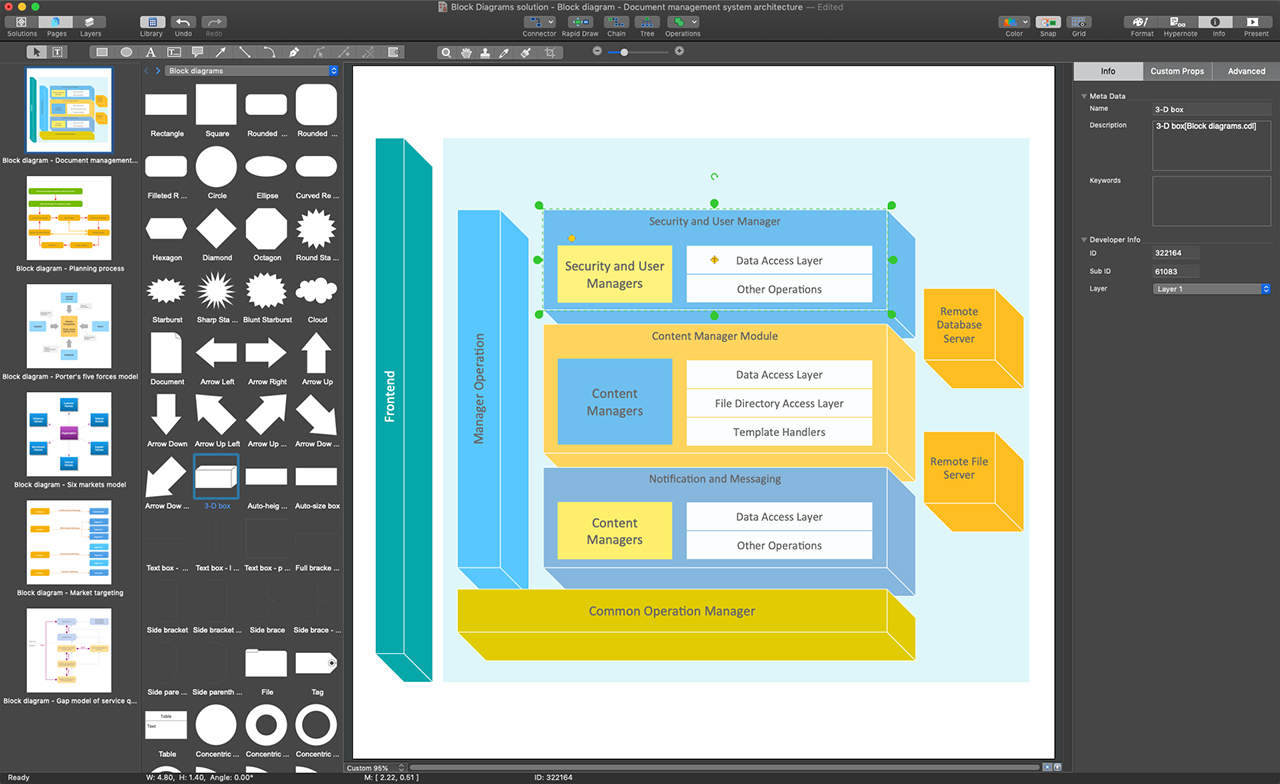
Picture: System Block Diagram Software
Related Solution:
The ER diagram is constructed from the specific ERD graphic elements. There are used 2 types of ERD notations: Chen and Crow's Foot.
A complete set of work flow shapes, notation & symbols for ERD, entity relationship stencils, included in Entity-Relationship Diagram (ERD) solution for ConceptDraw DIAGRAM software, makes drawing diagrams based on ERD notation as smooth as possible.
Picture: Notation & Symbols for ERD
Related Solution:
If neither of 45 vector shapes of the Cross-Functional Flowcharts solution don't fit your needs, you will want to learn How to create a unique Cross-Functional flowchart.
ConceptDraw Arrows10 Technology - This is more than enough versatility to draw any type of diagram with any degree of complexity.
Drawing software lets you to make horizontal and vertical, audit, opportunity and many more flowcharts.
Picture: How to Create a Cross Functional Flow Chart
The recruitment process often requires design and use of various HR flowcharts, diagrams, attractive illustrations.
Picture: Recruitment
Related Solution:
UML Diagrams Social Networking Sites Project. This sample was created in ConceptDraw DIAGRAM diagramming and vector drawing software using the UML Use Case Diagram library of the Rapid UML Solution from the Software Development area of ConceptDraw Solution Park.
This sample shows the Facebook Socio-health system and is used at the projection and creating of the social networking sites.
Picture: UML Use Case Diagram Example. Social Networking Sites Project
Related Solution:
A landscape plan depicts all the features of a future garden including buildings, plants, lawns or a patio. Such plan is a very important part of site adjustment because it gives a complete picture of future project.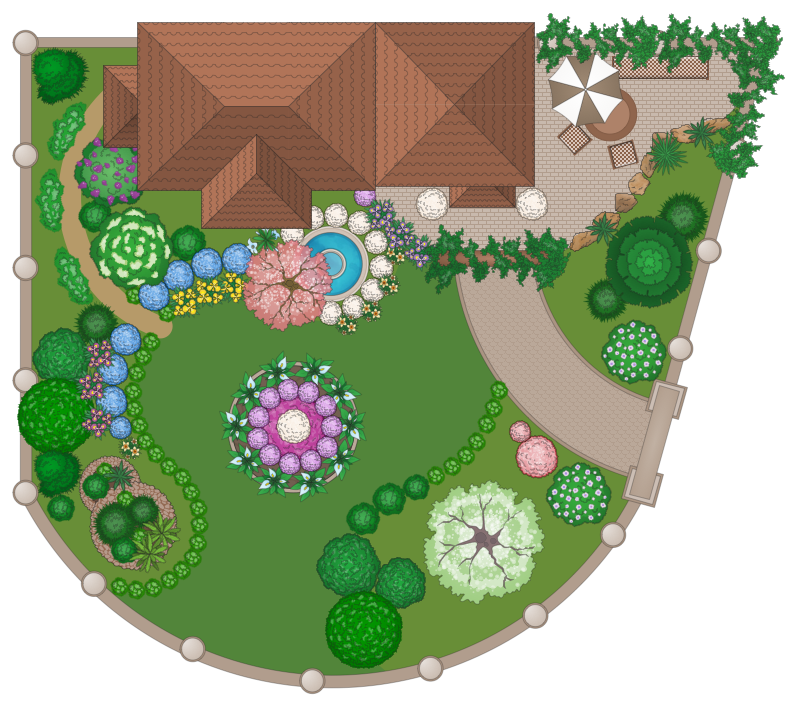
Picture: Landscape Plan
Related Solution:
The Nature Solution addition to ConceptDraw Solution Park for ConceptDraw DIAGRAM includes new libraries that provide a wide range nature objects and it can be used in many areas.
Picture: Drawing Illustration
Competitor analysis is a first and obligatory step in elaboration the proper corporate marketing strategy and creating sustainable competitive advantage. Use powerful opportunities of numerous solutions from ConceptDraw Solution Park for designing illustrative diagrams, charts, matrices which are necessary for effective competitor analysis.
Picture: Competitor Analysis
Related Solution:
ConceptDraw has several examples that help you to start using software for designing UML Use Case Diagrams.
Picture: UML Use Case Diagrams

