Organizational Structure Total Quality Management
A core definition of total quality management (TQM) describes a management approach to long–term success through customer satisfaction. In a TQM effort, every member of staff must be committed to maintaining high standards of work in every aspect of a company's operations.
The key concepts in the TQM include:
- Quality is defined by customers' requirements
- Top management has direct responsibility for quality improvement
- Increased quality comes from systematic analysis and improvement of work processes
- Quality improvement is a continuous effort and conducted throughout the organizational structure
The Total Quality Management Diagrams solution in ConceptDraw Solution Park with samples, templates, and a comprehensive library of vector shapes for drawing Total Quality Management Diagrams and TQM Flowcharts.
 symbols")
 solution")
Pic.1 Total quality management (TQM) solution.
The Total Quality Management Diagram solution helps you and your organization visualize business and industrial processes. TQM Diagrams demonstrate clearly a process step-by-step in a visual manner. TQM Diagrams allow one to compare visually the ideal and real stages of a process. TQM Diagrams are widely used in Quality Management projects.

Pic.2 Total quality management (TQM) diagram.
This example shows a business process diagram that can be then analyzed for ways to improve the process effectiveness and diagnose quality issues that require resolution.
Implementation of TQM business philosophy into enterprise includes developing anorganisational structure and business processes providing involvement of all employees into continuous quality improvement of the products and services.
See also Samples:
TEN RELATED HOW TO's:
The Total Quality Management Diagram solution helps your organization visualize business and industrial processes. Create Total Quality Management diagrams for business process with ConceptDraw software.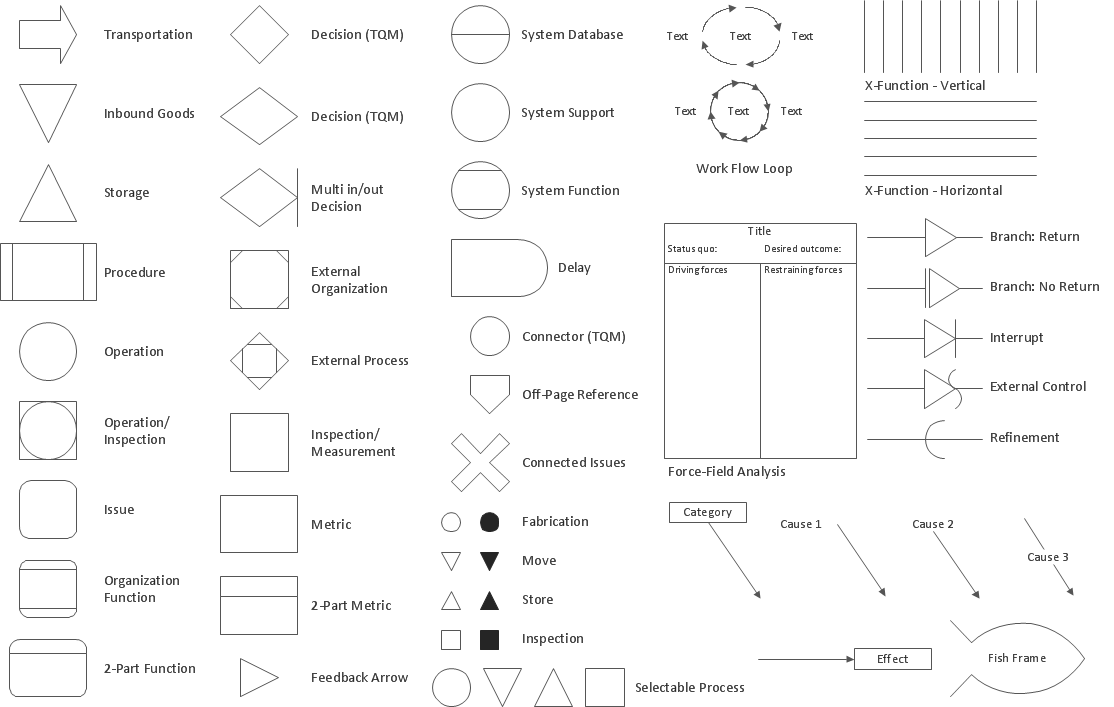
Picture: The Fifty Two Elements of TQM
Related Solution:
ConceptDraw Mind maps can be used to depict a quality process.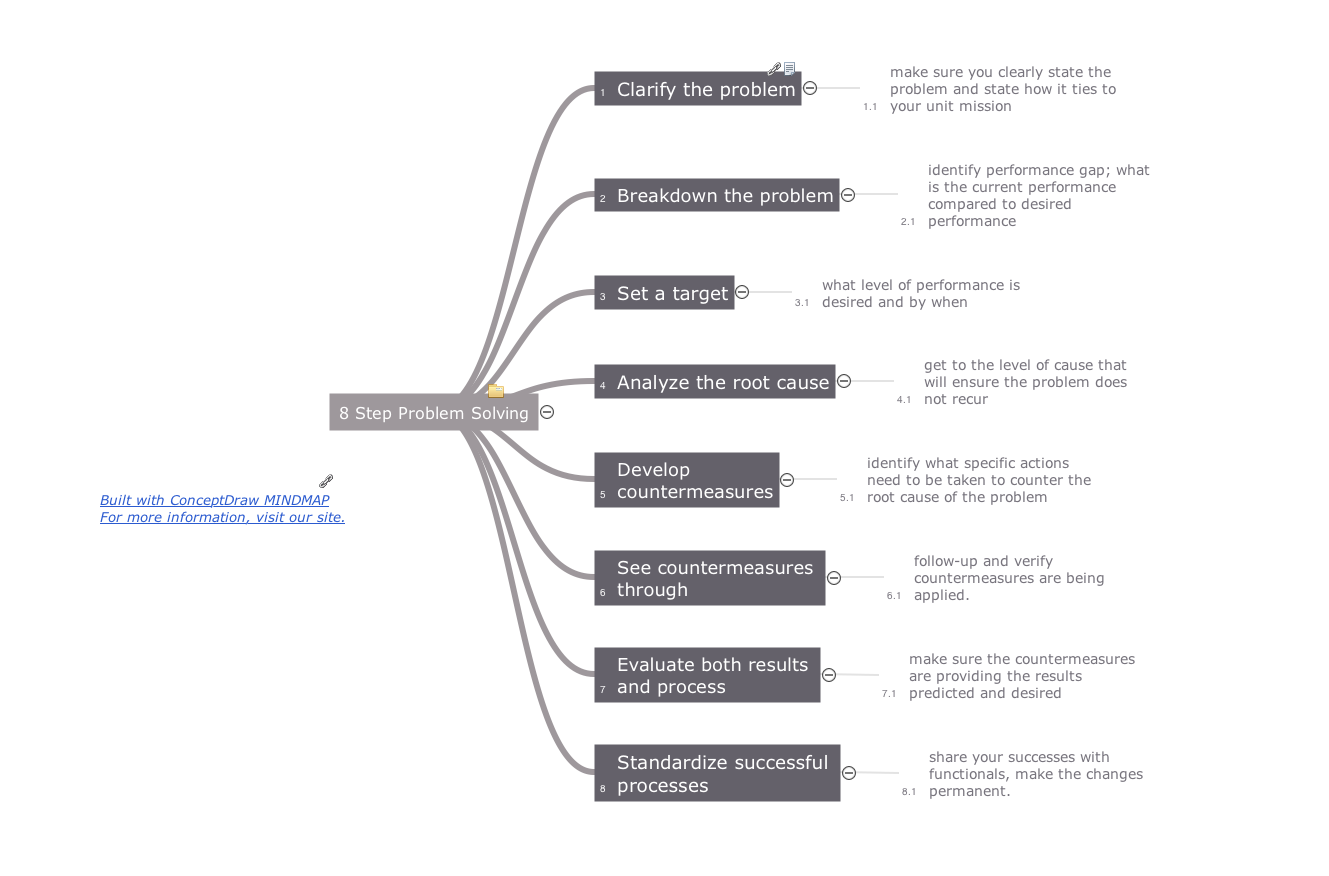
Picture: Helpful in all stages of quality management
Related Solution:
Fishbone diagram is a powerful tool used for solving business problems and obstacles. ConceptDraw DIAGRAM software extended with Fishbone Diagrams solution from the Management area of ConceptDraw Solution Park is a helpful tool for cause and effect analysis. It gives the ability to easy identify many possible causes and factors which cause the effects and to draw Fishbone Diagrams for problem solving.
Picture: Cause and Effect Analysis - Fishbone Diagrams for Problem Solving
Related Solution:
ConceptDraw DIAGRAM diagramming and vector drawing software offers a powerful Seven Basic Tools of Quality solution from the Quality area of ConceptDraw Solution Park which contains a set of useful tools for easy drawing Flow Chart of any complexity.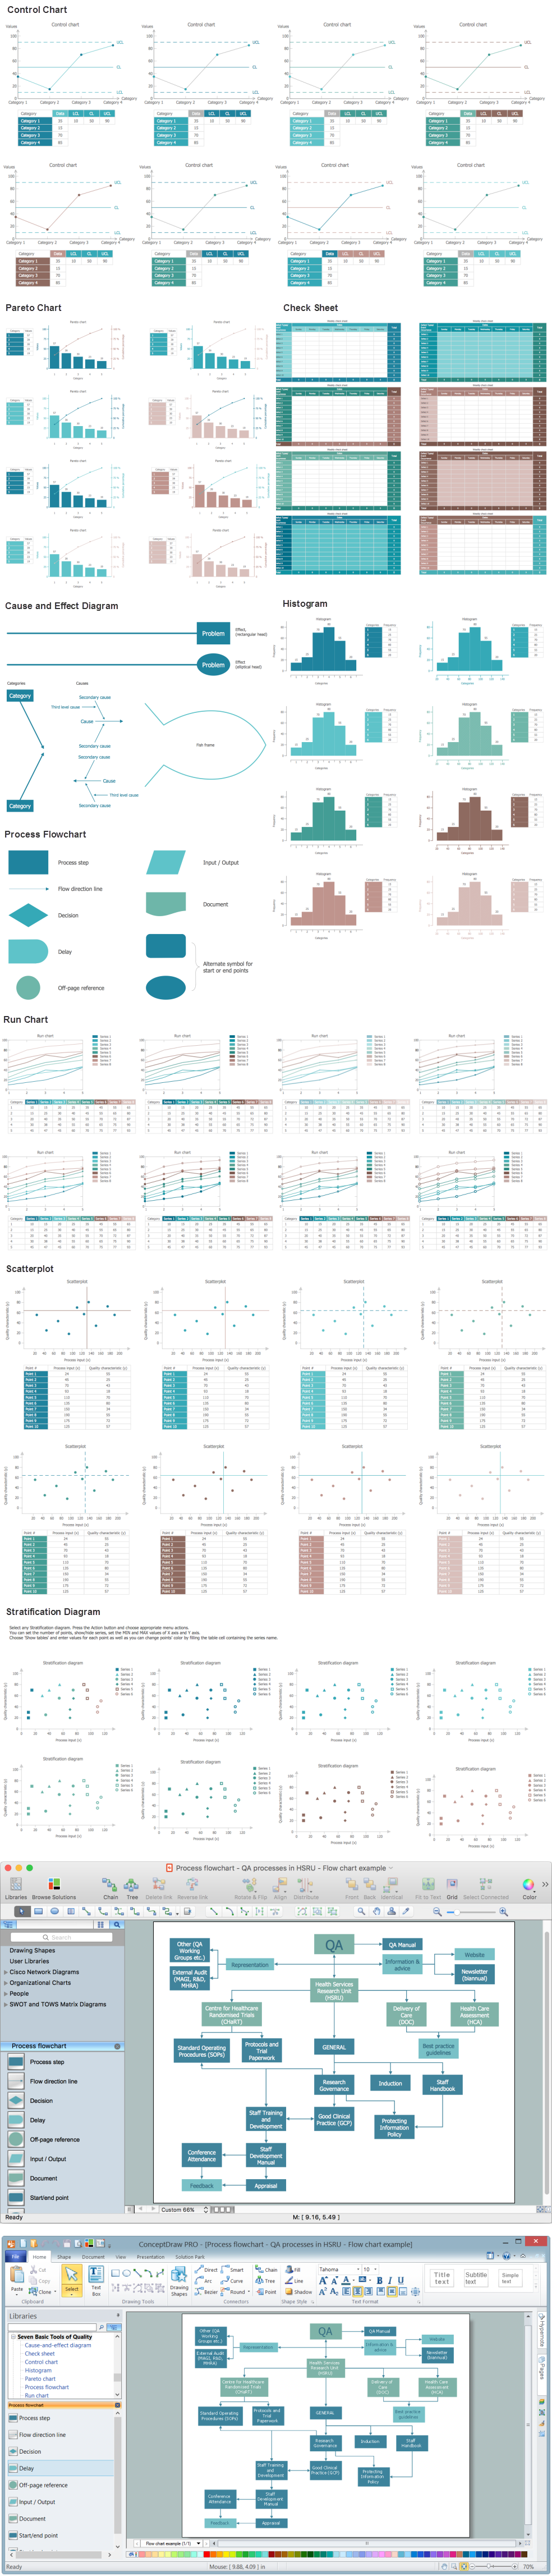
Picture: Seven Basic Tools of Quality - Flow Chart
Related Solution:
Also included are standardized hr flowchart symbols, meaning your diagrams will be relevant and understood by all business associates.
Picture: HR Flowchart Symbols
Related Solution:
Take a look on an example of Cross-Functional-Flowchart, showing the software service cross-function process flowcharts among the different departments. It presents a simple flowchart among the customer, sales, technical support, tester and development.
Try now Flowchart Software and Cross-Functional library with 2 libraries and 45 vector shapes of the Cross-Functional Flowcharts solution. Then you can use built-in templates to create and present your software service cross-function process flowcharts.
Picture: Cross Functional Flowchart Examples
ConceptDraw DIAGRAM software extended with Fishbone Diagrams solution from the Management area of ConceptDraw Solution Park is perfect for Cause and Effect Diagram creating. It gives the ability to draw fishbone diagram that identifies many possible causes for an effect or a problem. Causes and Effects are usually grouped into major categories to identify these sources of variation. Causes and Effects in the diagram show relationships among various factor. Fishbone diagram shows factors of Equipment, Process, People, Materials, Environment and Management, all affecting the overall problem.
Picture: Cause and Effect Diagram
Related Solution:
An organizational chart is a diagram that shows the structure of an organization and the relationships of its parts. ConceptDraw DIAGRAM extended with Organizational Charts Solution from the Management Area is powerful Organizational Chart Software.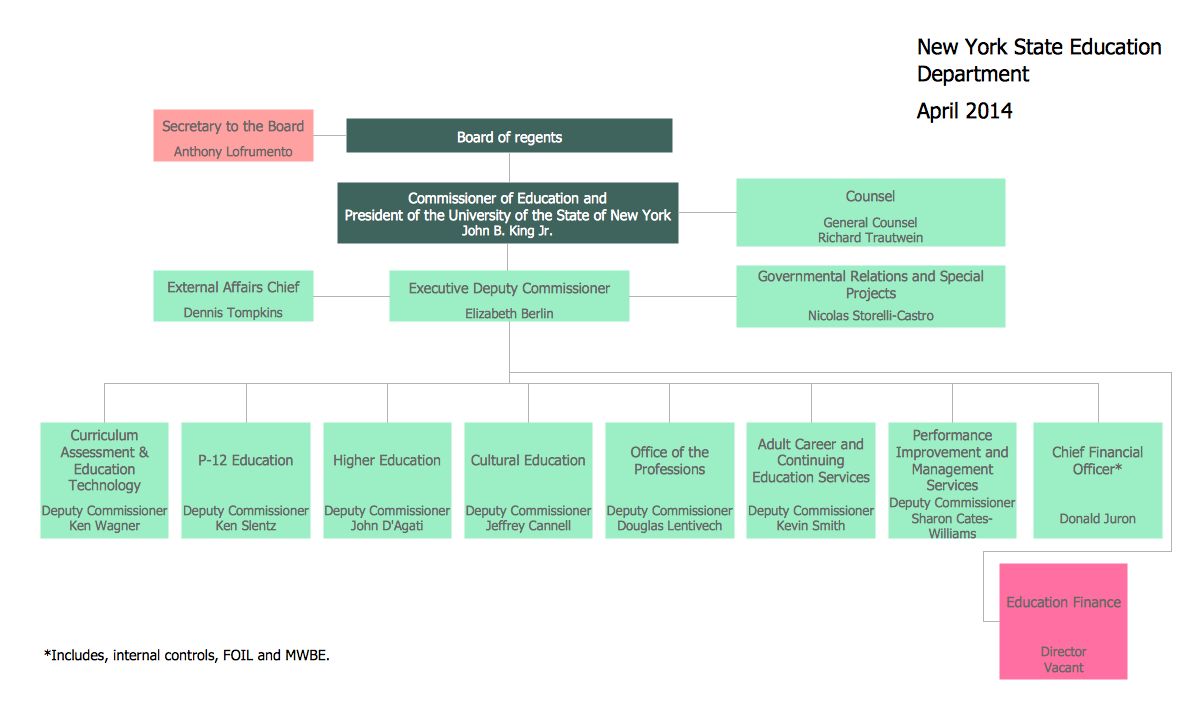
Picture: Organizational Chart
Related Solution:
UML Diagrams Social Networking Sites Project. This sample was created in ConceptDraw DIAGRAM diagramming and vector drawing software using the UML Use Case Diagram library of the Rapid UML Solution from the Software Development area of ConceptDraw Solution Park.
This sample shows the Facebook Socio-health system and is used at the projection and creating of the social networking sites.
Picture: UML Use Case Diagram Example. Social Networking Sites Project
Related Solution:
It can be tough to get straight into business papers and processes.Otherwise, you can learn how to create flowcharts for an accounting information system and visualize these documents. Accounting diagrams are clear and easy to understand for all the participants of the process.
There are symbols used for creating accounting flowcharts using ConceptDraw DIAGRAM and its Accounting Flowcharts solution. Accounting flow charts are a special kind of flow charts. Actually a variety of flowcharts are often used to facilitate many aspects of a workflow of accounting department. Accounting flowcharts are utilized to support creating accounting documentation, to depict positions responsible for fulfillment of each phase of accounting workflow.
Picture:
How to Create Flowcharts for an
Accounting Information System
Related Solution:
 symbols")
 solution")