IDEF0 Flowchart Symbols
IDEF (Integration Definition for Function Modeling) relates to the family of modeling languages in the field of systems and software engineering. IDEF covers a wide range of uses, from the functional modeling to the object-oriented analysis and design. There are many types of IDEF diagrams and methods, two among them are used as the base for business process models - IDEF0 and IDEF3.
The IDEF0 method is built on the functional modeling language Structured Analysis and Design Technique (SADT) and focuses on activity modeling. The modeling of the entire business and its processes is always difficult process, because even for small-size businesses the business processes are complex. The IDEF0 method facilitates the modeling of the business as a complex system and makes it simple for understanding.
The IDEF0 Diagrams are succesfully used for documenting the business, for analysis, development, reengineering, integration of information and software systems. The IDEF0 notation is based on the Air Force Wright Aeronautical Laboratories Integrated Computer-Aided Manufacturing (ICAM) Architecture and was standardized in 1993 by the National Institute of Standards and Technology.
The ability to create the IDEF0 flowcharts and business diagrams rapidly and without efforts is made possible thanks to wide range of intuitive tools of ConceptDraw DIAGRAM software and IDFE0 notation supplied by IDEF0 Diagrams solution from the Software Development area. This solution is rich for the ready-to-use specific IDEF0 flowchart symbols grouped in IDEF0 Diagram library.

Example 1. IDEF0 Diagram Library
The IDEF0 Diagram library contains 18 IDEF0 flowchart symbols. All they are vector, so you can resize them without loss of quality, change their color to make your flowcharts and diagrams more attractive.

Example 2. IDEF0 Flowchart Symbols
Note that one more set of IDEF0 flowchart symbols is also offered by IDEF0 library from the IDEF Business Process Diagrams solution from the Business Processes area of ConceptDraw Solution Park. You can combine the objects from both these libraries at your diagram, if required.

Example 3. IDEF0 Library Design Elements
The flowcharts and diagrams are the major components of IDEF0 models and are used to model the decisions, actions, and activities of an organization or other system. An IDEF0 model is made up of several diagrams, each diagram describes in more detail a box from a more general diagram.
Follow the next few steps to create the IDEF0 diagram:
- You can start design with Diagram Box element from the IDEF0 Diagram library.

Example 4. Adding the Diagram Box
- Then add the boxes that represent functions such as activities, actions, processes or operations by dragging them from the library into the Diagram Box. Arrange the boxes and resize the Diagram Box, if needed.

Example 5. Adding the Boxes at IDEF0 Diagram
- To make changes to IDEF0 objects, use the Action button menu at the object's right top corner.

Example 6. IDEF0 Object's Action Menu
- The data and objects which interrelate with the functions are represented by arrows, connect the IDEF0 elements with arrow connectors. Add the text and make color changes.

Example 7. IDEF0 Diagram — Application Development
The IDEF0 Diagrams solution offers also large quantity of predesigned templates and samples that are available from ConceptDraw Solution Park. Use any of them to create your own IDEF0 Diagram on its base.

Example 5. IDEF0 Diagrams Solution
The ConceptDraw DIAGRAM software allows you create the IDEF0 digrams and flowcharts of complex processes more easily by providing variety of drawing tools, connector tools, samples, templates and drag-and-drop IDEF0 flowchart symbols contained in IDEF0 Diagrams library from the IDEF0 Diagrams solution of Software Development area and IDEF0 library from the IDEF Business Process Diagrams solution of Business Processes area.

Example 5. Export IDEF0 Diagram to PDF, PPT, Visio.
Any IDEF0 Diagram designed in ConceptDraw DIAGRAM software can be then easy printed, exported to various formats, including PPT, PDF, MS Visio, HTML, and many other graphic formats.
NINE RELATED HOW TO's:
A flowchart is a powerful tool for examining processes. It helps improving processes a lot, as it becomes much easier to communicate between involved people, to identify potential problems and to optimize workflow. There are flowcharts of different shapes, sizes and types of flowchart vary from quite basic process flowcharts to complex program flowcharts. Nevertheless, all these diagrams use the same set of special symbols like arrows to connect blocks, parallelogram to show data receiving or rectangles for showing process steps.
Basic flowcharts are used to represent a simple process algorithm. A basic flowchart notation consists of rectangles (business processes), arrows (the flow of information, documents, etc.). The same notation is used in items such as the "decision", which allow you to do the branching. To indicate the start of the entire business process and its termination can be used the "Terminator" element. The advantages of Basic Flowchart are simplicity and clarity. With it you can quickly describe the business process steps. Creating of Basic Flowchart does not require any special knowledge, as easily understand by employees with different levels of education and IQ.
Picture: Types of Flowchart: Comprehensive Overview
Related Solution:
Internal auditing is an independent, objective assurance and consulting activity designed to add value and improve an organization's operations.
ConceptDraw DIAGRAM diagramming and vector drawing software extended with Audit Flowcharts solution from the Finance and Accounting area perfectly suits for the Internal Audit Process. You can make sure this right now!
Picture: Internal Audit Process
Related Solution:
ConceptDraw DIAGRAM Software is a cross-platform flowcharting tool with extended HTML capabilities. It contains more than 10 000 pre-created objects and many templates, available for PC and Macintosh.
Creating great designs and diagrams involves having the right drawing software. ConceptDraw is the business diagram software of choice for business professionals who need to quickly and easily visualize, explore, and communicate information.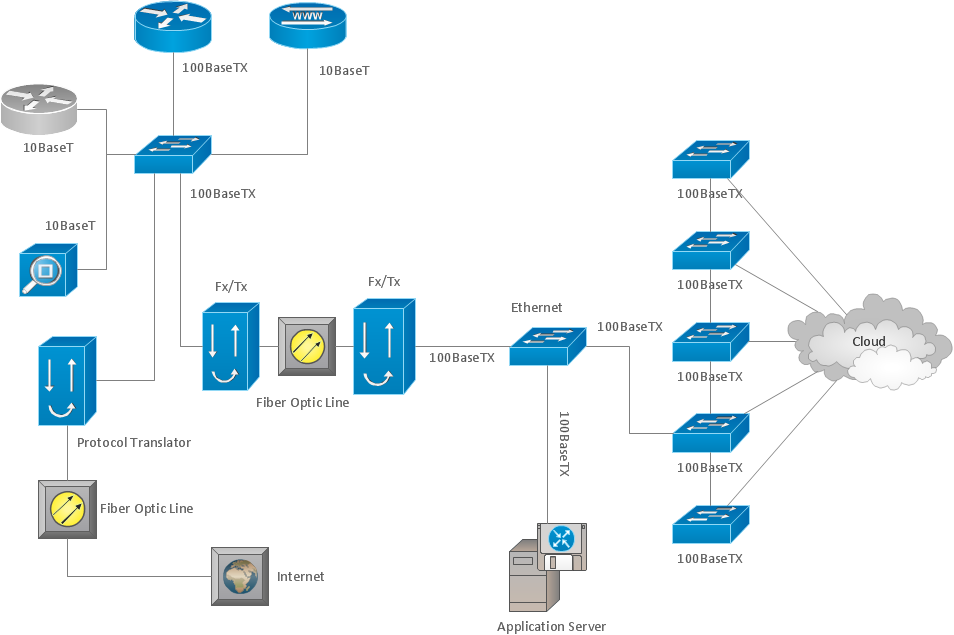
Picture: Business and Software Diagrams
ConceptDraw DIAGRAM software is the best Mac software for drawing workflow diagrams. Its rich set of samples and templates, and specific features to draw diagrams faster make this software as comfortable as possible for drawing workflow diagrams.
Use the ConceptDraw DIAGRAM professional Mac OS X software for drawing workflow diagram. The Workflow Diagrams solution with its libraries and templates set make the possibility to identify resources that are required for work goal implementation. The process flow diagram identify flow which occurs as network of process dependencies, organizational decisions and interactions between departments. Usually workflow diagrams show business participants actions that carry product or service to the final destination, the consumer.
Picture: Workflow Diagram Software Mac
Related Solution:
ConceptDraw DIAGRAM is a software for simplу depicting the business processes based on BPMN 2.0.
Business Process Diagrams Cross-Functional-Flowcharts, Workflows, Process Charts, IDEF0 and IDEF2, Timeline, Calendars, Gantt Charts, Business Process Modeling, Audit and Opportunity Flowcharts and Mind Maps (presentations, meeting agendas).
Picture: Business Process Modeling Notation
Related Solution:
Services UML Diagram. ATM system. This sample was created in ConceptDraw DIAGRAM diagramming and vector drawing software using the UML Use Case Diagram library of the Rapid UML Solution from the Software Development area of ConceptDraw Solution Park.
This sample shows the scheme of the servicing using the ATMs (Automated Teller Machines) and is used at the working of ATM banking systems, at the performing of the banking transactions.
Picture: UML Use Case Diagram Example. Services UML Diagram. ATM system
Related Solution:
ConceptDraw DIAGRAM extended with Cross-Functional Flowcharts Solution from the Business Processes Area is a powerful software which offers a variety of Cross Functional Flowchart examples. The use of predesigned examples as the base for your own Cross Functional Flowchart Diagrams is a timesaving and useful way.
Picture: Cross Functional Flowchart Examples
Related Solution:
Do you like the professional schemes that you can find on the Internet? Take into account that the most part of them is made using the Best Flowchart Software and Flowchart Symbols. Try you own powers in creating such diagrams!
Flowcharts are the most business diagramming tool. If you are a business manager, you can use flow chart to depict work flow in your organization, develop the effective organizational structure and present the information to investors or other stakeholders. Combining the smart management solutions with ConceptDraw DIAGRAM diagramming engine delivers the set of comprehensive flowchart tools necessary to support professionals in their creativeness and business activity.
Picture: Best Flowchart Software and Flowchart Symbols
Related Solution:
Use Case Diagrams technology. IDEF4 standard implies not only graphical presentation but the additional information about diagrams of heredity, methods systematization and types which are contained in specifications.
Picture: IDEF4 Standard


