
Example 1. Organic Chemistry Symbols
Chemistry Solution offers 6 libraries with 726 chemical equation symbols and organic chemistry symbols professionally designed for ConceptDraw DIAGRAM users. You can simply drag and arrange them at your document, add the text if need.
Chemistry Solution includes also variety of predesigned samples and examples. All they are available from ConceptDraw STORE which is the best for easy navigation through a ConceptDraw Solution Park. It is convenient that ConceptDraw STORE gives a quick access to all libraries, templates and samples directly from it.

Example 2. Organic Chemistry Drawing — Phenols
The samples you see on this page were created in ConceptDraw DIAGRAM software using the organic chemistry symbols from the libraries of Chemistry Solution. These organic chemistry schemes successfully demonstrate solution's capabilities and professional results you can achieve. An experienced user spent 5-15 minutes creating each of them.
Use the Chemistry Solution for ConceptDraw DIAGRAM software to create your own professional looking chemical drawings, diagrams, illustrations and schemes of any complexity quick, easy and effective.
All source documents are vector graphic documents. They are available for reviewing, modifying, or converting to a variety of formats (PDF file, MS PowerPoint, MS Visio, and many other graphic formats) from the ConceptDraw STORE. The Chemistry Solution is available for all ConceptDraw DIAGRAM or later users.
TEN RELATED HOW TO's:
The UML diagrams in this Solution are divided into three broad categories: Structure Diagrams; Behavior Diagrams; Interaction Diagrams.
The 13 diagrams contained in the Rapid UML Solution offer an essential framework for systems analysts and software architects to create the diagrams they need to model processes from the conceptual level on through to project completion.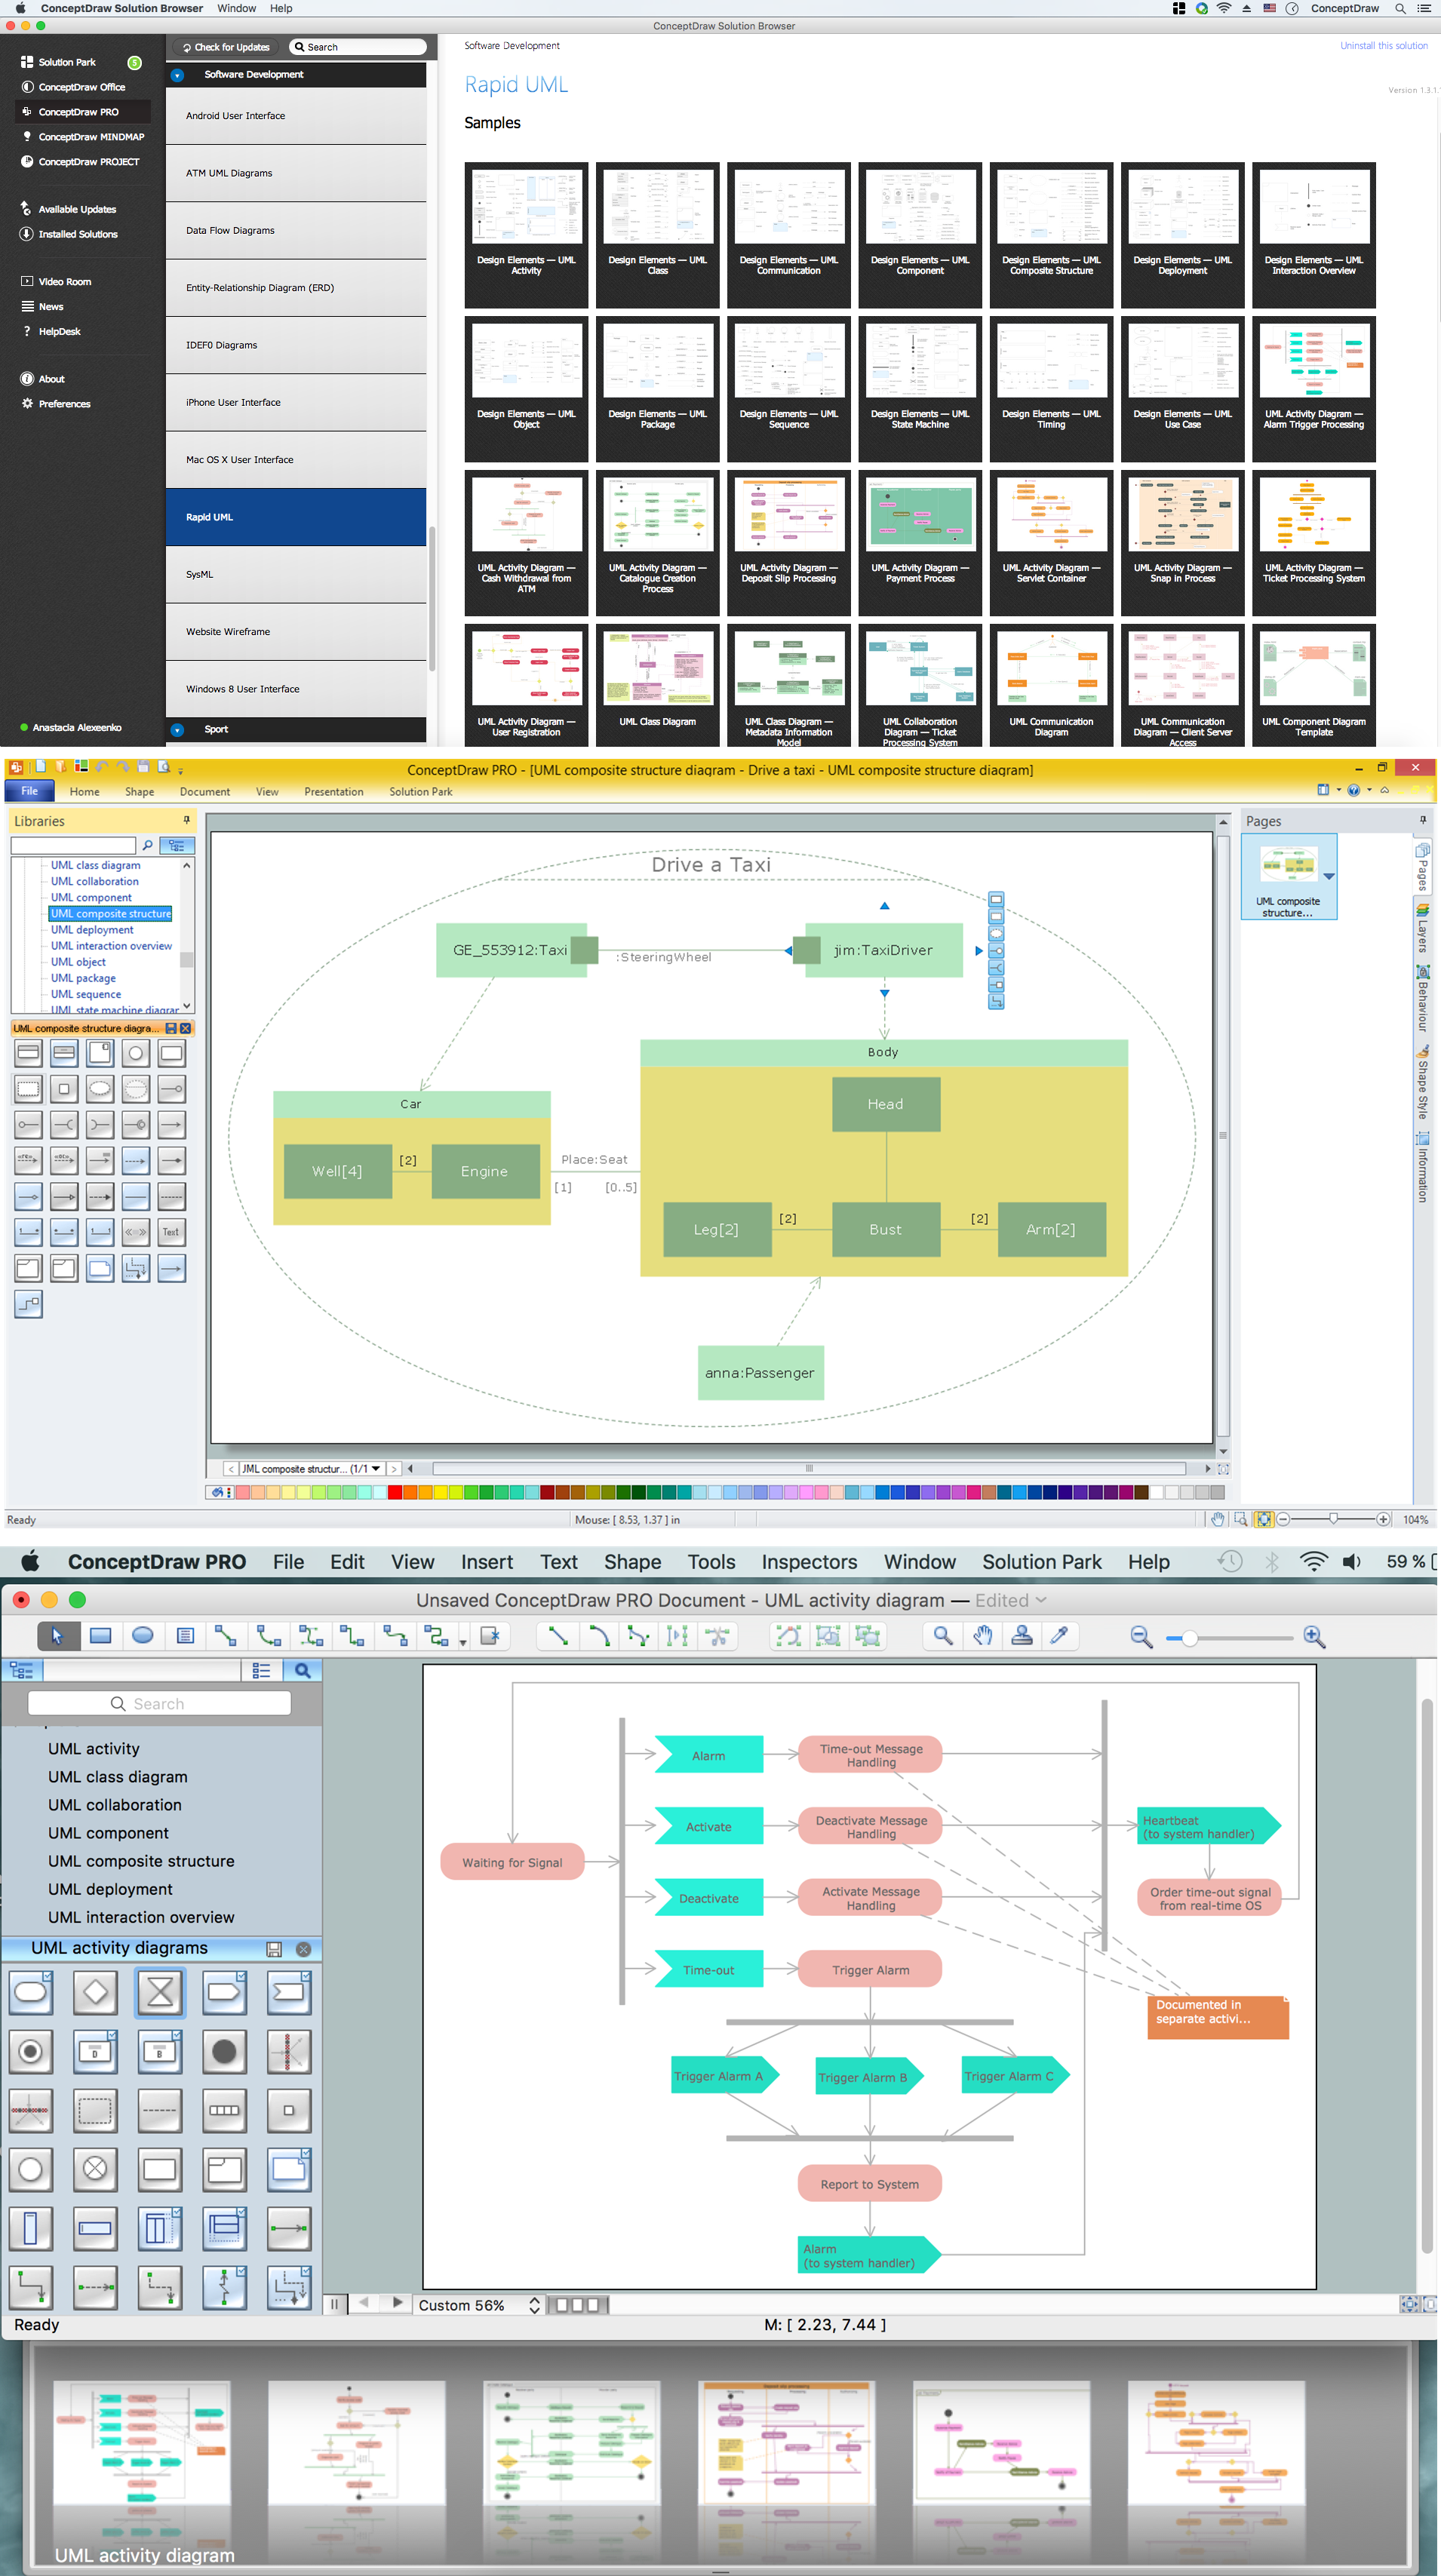
Picture: How to create your UML Diagram
Related Solution:
Nature solution expands our software possibilities to create beautiful illustrations and cliparts with the new library which contains 17 vector objects.
Picture: Beauty in nature Illustrations and Clipart
Designing a workspace or office involves careful consideration of form and function. Conceptdraw offers you all nessesary office design elements in one library. Combine, match, design and create!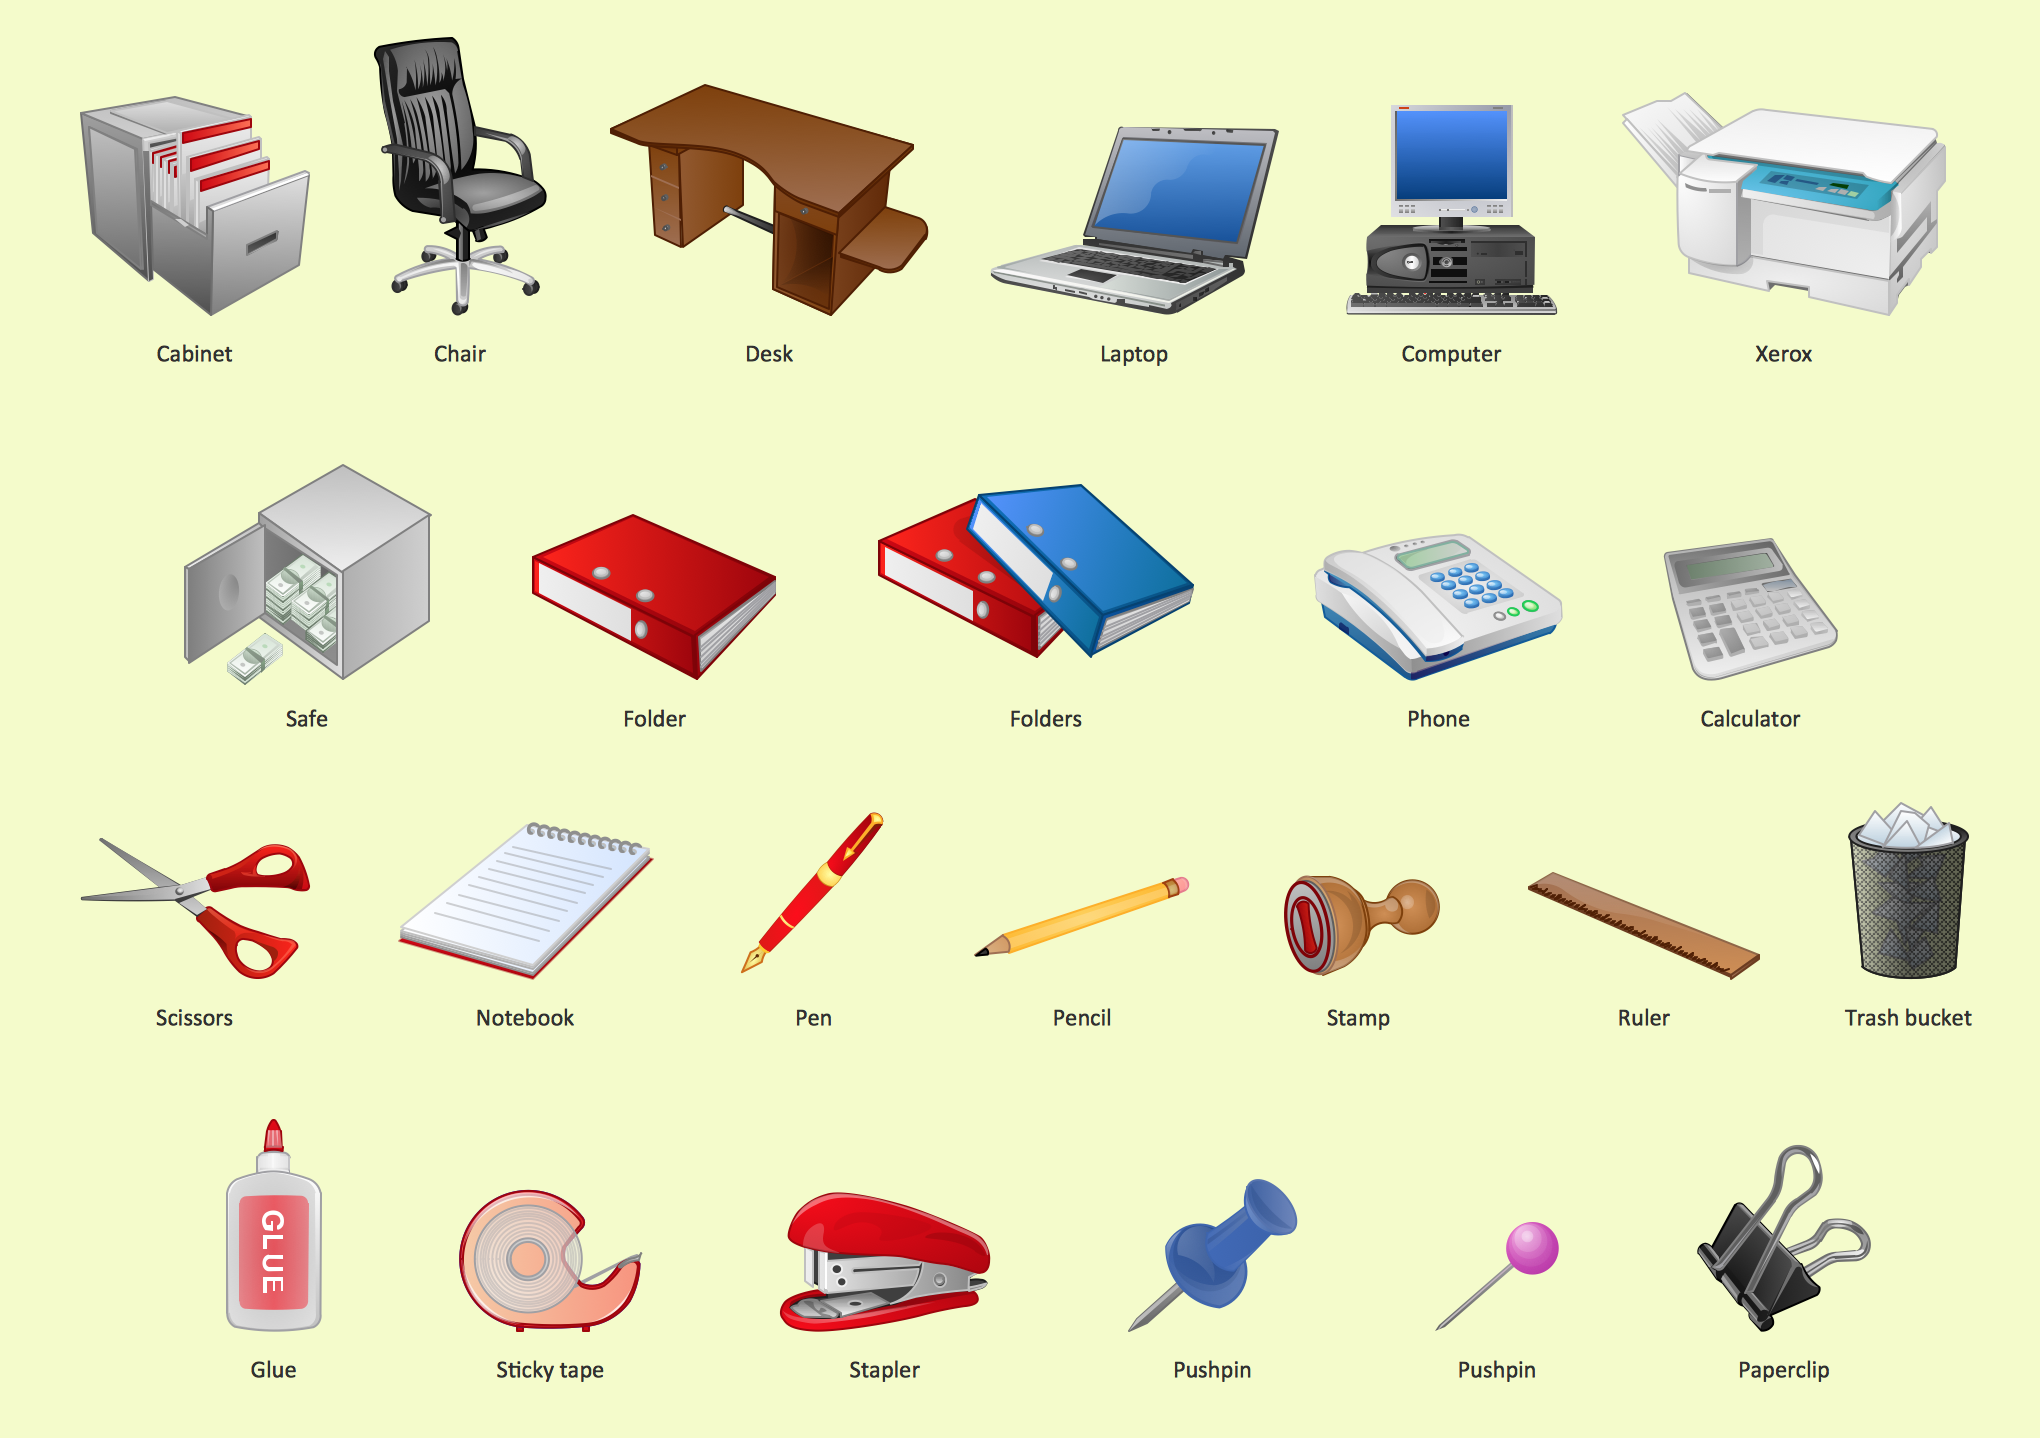
Picture: Office - Design Elements
Related Solution:
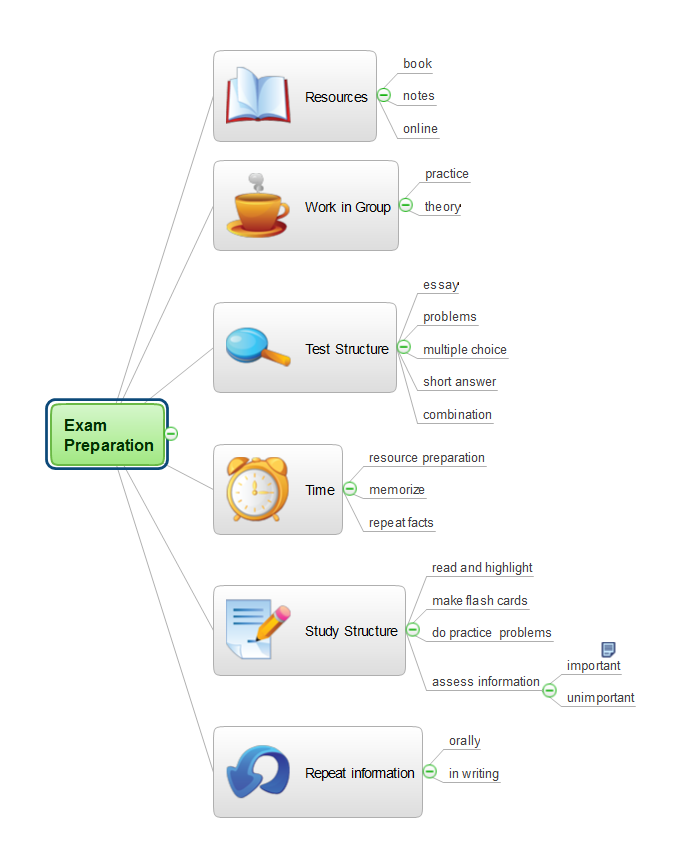
Picture: Exam Preparation Mind Map
Related Solution:
There are many ways to track the system in a critical situation. To model a system behavior, uml notation is widely used. Usually, an UML diagram consists of elements such as actor and a case.
This diagram represents the structure of UML notations. Unified Modeling Language (UML) is used in software engineering to depict graphically the software modeling process. UM Language uses graphic notations for developing models of object-oriented systems. These notations displays requirements, sub-systems, logical and physical elements, etc. We created this diagram using ConceptDraw DIAGRAM reinforced with Rapid UML solution. It can be helpful for students on software engineering, when learning UML.
Picture: UML Notation
Related Solution:
Use diagrams and infographics designed in ConceptDraw DIAGRAM to explain efficiently ✔️ basics of the baseball game, ✔️ rules, ✔️ positions, ✔️ strategies, ✔️ defensive and offensive insights, ✔️ game situations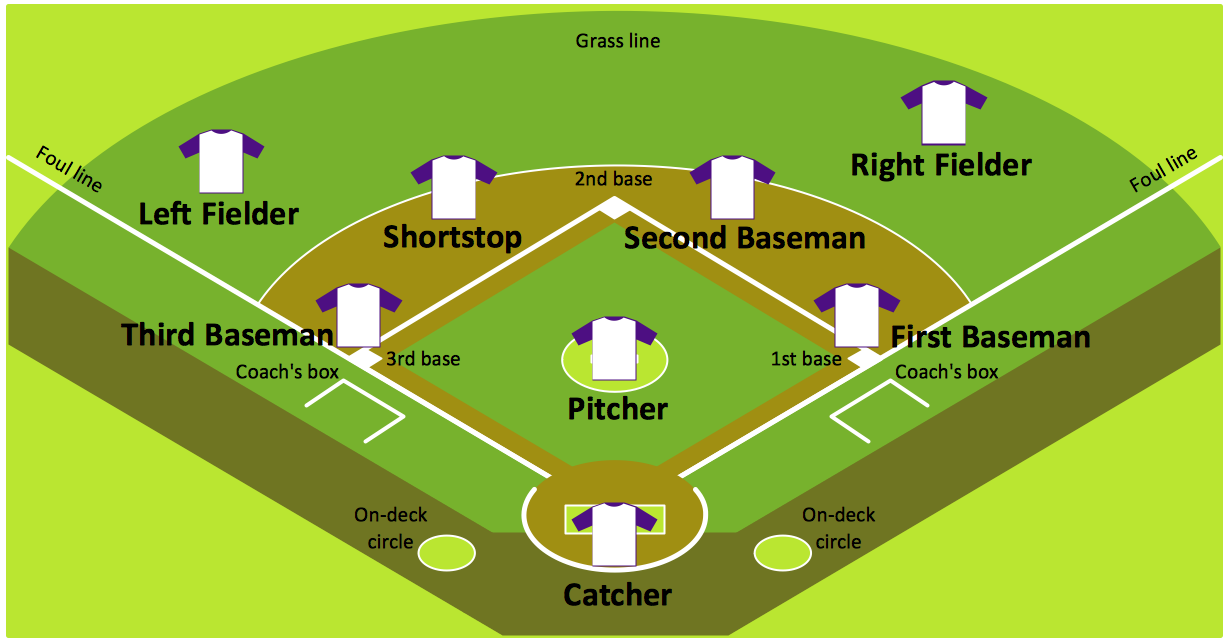
Picture:
Baseball Diagram
Baseball Field — Corner View — Sample
Related Solution:
Any business process consists from a number of tasks carrying out the certain business goal. It is useful to diagram business processes to ensure that they are as foolproof, logical and sequential as possible. This business process diagram describes a typical booking process flow by the example of a cab booking process. It can be used as a roadmap for any booking system implementation. Diagramming a business process allows you to look at the entire project and take into account all types of possible scenarios. Business process diagram helps you investigate and clarify the process thoroughly so that you can find out how it can be improved. Business process diagram supports team communications by ensuring that each process element is clear and everyone in the team is on the same page.
Sometimes your company brings you less profit than you expect it to be, and it’s difficult to reveal the causes. Maybe it’s time to learn new technologies, because business diagram are easily developed by means of special software, so you won’t make any extra effort. In return, you will increase your productivity and get more done in a less time.
Picture: Business Diagram Software
Related Solutions:
Two types of diagrams are used in UML: Structure Diagrams and Behavior Diagrams. Behavior Diagrams represent the processes proceeding in a modeled environment. Structure Diagrams represent the elements that compose the system.
Picture: UML Diagram Types List
Related Solution:
Automatically create a presentation-quality diagram in one click with ConceptDraw DIAGRAM.
Picture: Visual Presentations Made Easy with Diagramming Software
Related Solution:
Nowadays, any architect or landscape designer can't do without a pack of digital tools for designing and projecting. Thus, there will be no problem to develop any landscape architecture plan with ConceptDraw DIAGRAM , especially since there are so many ready-to use templates and examples included. It's just as easy as drawing sketches on paper.
If you using ConceptDarw DIAGRAM there is no needs to have a professional skills on landscape and garden design. As well as you don't need to be an expert in architectural charts and plans drawing. The all you need is the Landscape and Garden solution. This solution contains a unique collection of the professional designed vector objects depicting flower and grass, bushes and trees, garden furniture, pools and accessories. In one word - the full set of graphical elements enabling to focus on the creativeness while creating your landscape and garden plan.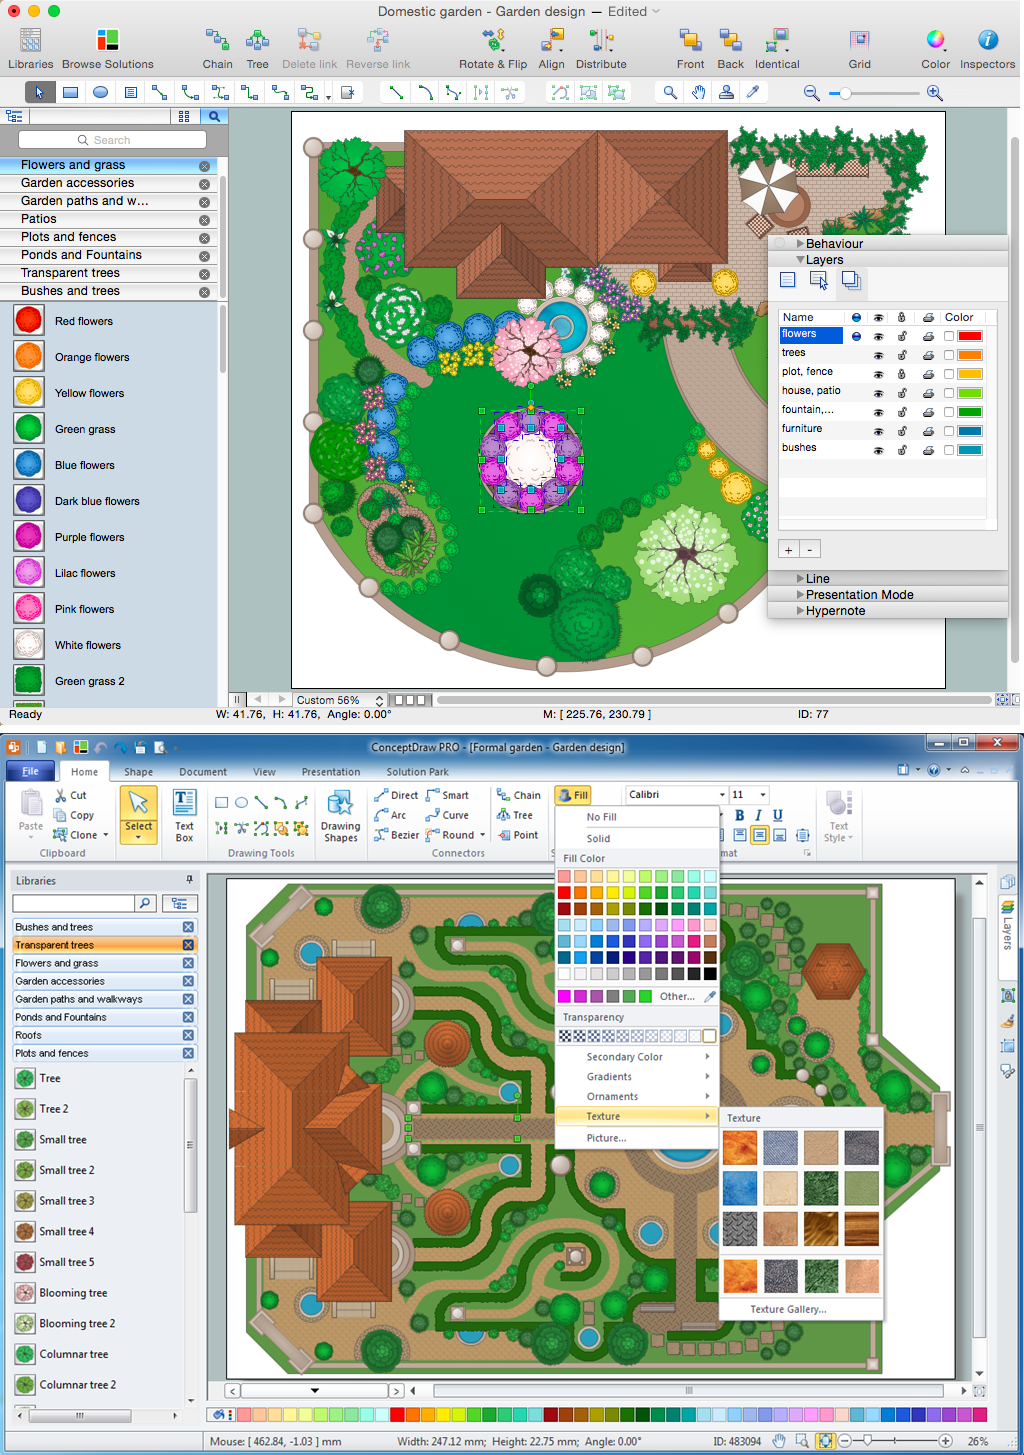
Picture: Landscape Architecture with ConceptDraw DIAGRAM
Related Solution:


