Chemistry Drawings
Chemistry is a well-known branch of so called “physical science”, studied in most of the schools all over the globe. It studies the structure, properties, change of matter and composition, including topics about atoms, about how they form the so called “chemical bonds” for creating the chemical compounds, etc. With help of chemistry it is possible to explain the interactions of substances through the well-known within chemistry as a science “intermolecular forces” and so giving the matter its general properties. Studying chemistry means getting to know the interactions between substances by learning different chemical reactions for forming different substances.
Chemistry is one of the “central sciences” bridging other natural sciences, such as physics, biology, geology and other. The history of chemistry can be started to be told from the time when alchemy was popular, which is simply a protoscientific as well as philosophical tradition which was very popular in Africa, in Asia and in Europe long time ago, being practiced for several millennia.
The so called “modern scientific method” of its development was quite slow, but at the same time an early one for chemistry began among chemists in the 9th century when a well-known chemist of that time Jābir ibn Hayyān, also known as "Geber" was treated as "the father of chemistry" for introducing an experimental and systematic approach to scientific research. This approach was based in the laboratory, being after reshaped into a scientific discipline. At the same time as the "Father of Modern Chemistry" Antoine-Laurent de Lavoisier was considered.
The so called “theory of phlogiston” was popular to be discussed by Georg Ernst Stahl in the early 18th century who was a German citizen. The mentioned theory was overturned by another chemist Antoine Lavoisier from France by the end of the century, who basically established the “new science” in a way of elucidating the so called “conservation of mass” principle as well as developing a new system of the nomenclature which is still widely used in chemistry.
The very well-known scientist Dmitri Mendeleev developed a periodic table predicting the existence of seven new elements in it, placing 60 at the time in their correct places. After, another scientist John Dalton from England proposed another theory — theory of atoms. He described it as the one insisting on all substances being composed of different indivisible “atoms of matter” when different atoms have the varying atomic weights.
The development of another theory occurred in the 19th century named as an “electrochemical theory of chemical combinations”. It was a result of the work of two scientists Humphry Davy and J. J. Berzelius. The first mentioned scientist discovered 9 new elements. Among them there also were the alkali metals. He discovered them by extracting from their oxides with the electric current.
British scientist William Prout proposed to order all the elements by their atomic weight. He insisted on all atoms having their own weight and J. A. R. Newlands devised one of the first versions of the “table of elements”. The mentioned table was later developed into the modern periodic table of elements. It was done by Dmitri Mendeleev who we already mentioned above in the 1860s. Later, it was improved by a few other scientists. The so called “organic chemistry” was the one being developed by Justus von Liebig.
Nowadays the model of atomic structure is known to be the “quantum mechanical” one. The traditional chemistry starts with the study of molecules, elementary particles, substances, metals, atoms, crystals, etc. It can be studied in liquid, gas or solid states, in combination or in isolation. The reactions, transformations and interactions studied in chemistry are usually the result of interactions between different atoms. Such interactions may lead to the re-arrangements of the chemical bonds holding atoms together, being studied in a chemistry laboratory.
A transformation of some particular substances into one or more than one different substances is known to be called “chemical reaction”. Its basis is basically the re-arrangement of electrons in the chemical bonds between different atoms being depicted through a so called “chemical equation”. Such “chemical equations” usually involve atoms as subjects and the number of atoms on the right as well as on the left in the equation for a chemical transformation is known to be equal. The energy changes accompanying an undergoing of a type of chemical reactions a substance are known to be constrained by the so called “chemical laws” widely used within the chemistry as a science.
Both entropy and energy considerations are very important in almost all of the existing chemical studies. Most of the chemical substances are known to be classified in terms of their phase, structure and their chemical compositions, being analyzed by using the different tools of “chemical analysis”. Such “tools” may be, for example, chromatography or spectroscopy.
All scientists who are engaged in any chemical research are known to be called as “chemists”, being specialized in one or more than one “sub-disciplines”. If you are one of them working in this field of the scientific activity or you simply need to draw any chemistry drawings within your business project, then you can rely upon a modern software which is ConceptDraw DIAGRAM In case you need some help for making all your chemistry drawings look simply great, which means smart and professional, then you can always download, apart from ConceptDraw DIAGRAM another application — ConceptDraw STORE. The last product of CS Odessa was developed for a reason of providing all the ConceptDraw DIAGRAM users with the pre-made examples and templates of different drawings, such as charts, flowcharts, diagrams, maps, plans as well as other schematics, including the mentioned chemistry drawings.
ConceptDraw DIAGRAM software extended with Сhemistry solution from the Science and Education area is a powerful chemistry drawing software that is ideal for quick and easy designing of various:
chemistry drawings,
scientific and educational chemistry illustrations,
schemes and diagrams of chemical and biological lab set-ups,
images with chemical formulas, molecular structures,
chemical reaction schemes,
schemes of labware,
that can be then successfully used in the field of science and education, on various conferences, and so on.

Sample 1. Chemistry Drawing — Cycloalkanes Conformations
To help you design your chemistry drawings, Chemistry Solution offers 6 libraries with variety of chemistry equation symbols and organic chemistry symbols. All symbols and clipart from ConceptDraw DIAGRAM libraries are vector objects. It’s so easy to drag the predesigned shapes from the libraries to create the desired chemical illustration in minutes.
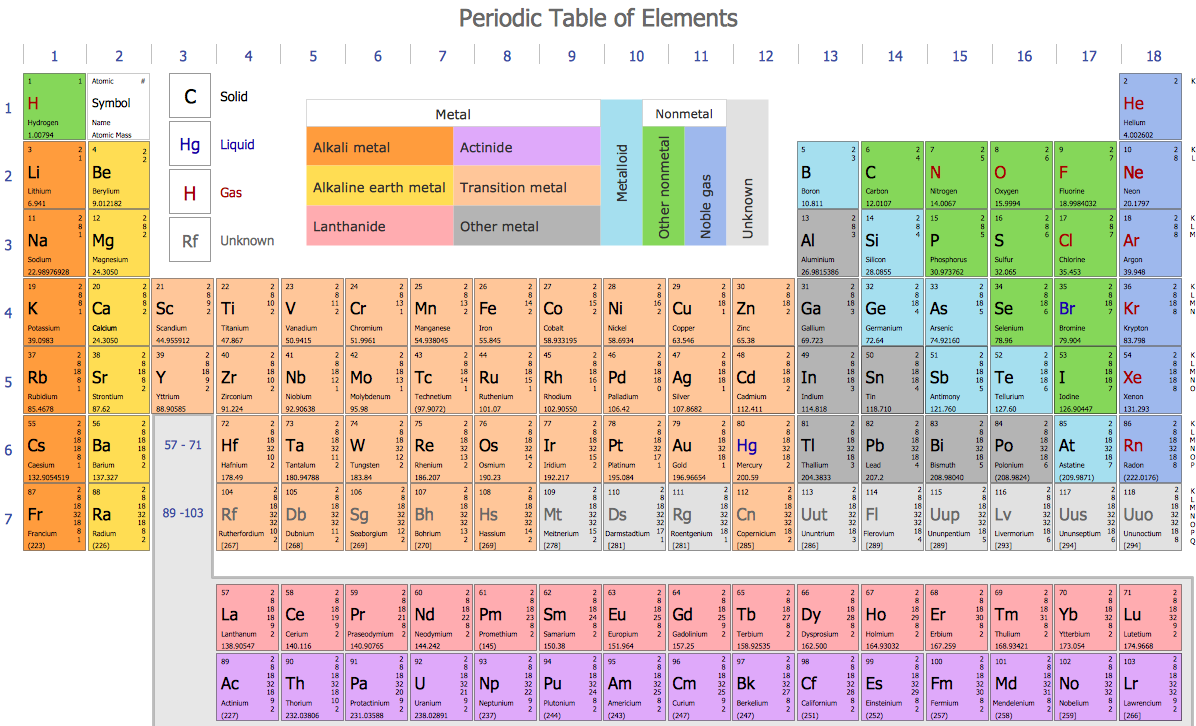
Sample 2. Chemistry Drawing — Chemistry Periodic Table of Chemical Elements Standard Form
Chemical solution contains also a set of different examples of chemical drawings, schemes and diagrams. All chemical samples and templates are available from ConceptDraw STORE, you can open them and change something as needed, and thus get already other illustration — your own new chemical drawing.
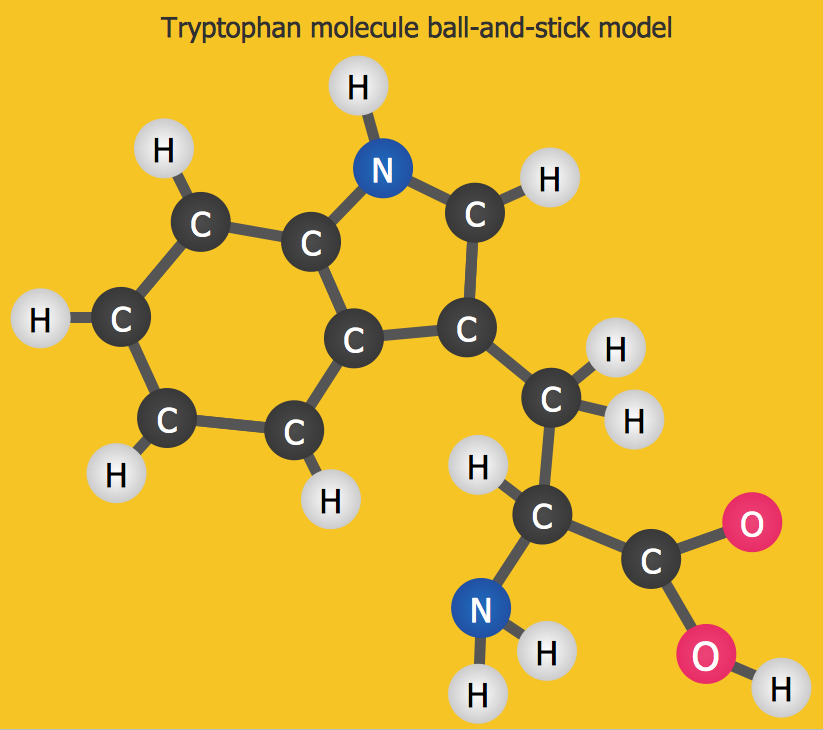
Sample 3. Chemistry Drawing — Chemistry Tryptophan
The samples you see on this page were created in ConceptDraw DIAGRAM using the Chemistry Solution for ConceptDraw DIAGRAM These chemical drawings successfully demonstrate solution's capabilities and professional results you can achieve. An experienced user spent 10 minutes creating every of these samples.
Use the Chemistry Solution for ConceptDraw DIAGRAM software to create your own professional looking chemical drawings, diagrams, illustrations and schemes of any complexity quick, easy and effective, and then successfully use them in your scientific or education activity.
All source documents are vector graphic documents. They are available for reviewing, modifying, or converting to a variety of formats (PDF file, MS PowerPoint, MS Visio, and many other graphic formats) from the ConceptDraw STORE. The Chemistry Solution is available for all ConceptDraw DIAGRAM or later users.


ConceptDraw DIAGRAM diagramming and vector drawing software provides the unique Flowcharts Solution from the Diagrams Area of ConceptDraw Solution Park with variety of vector objects libraries and collection of examples Flowchart. Each example flowchart included in Flowcharts solution is a real help in drawing process, it can be the good base or perfect source of inspiration.


