How to Build a Flowchart
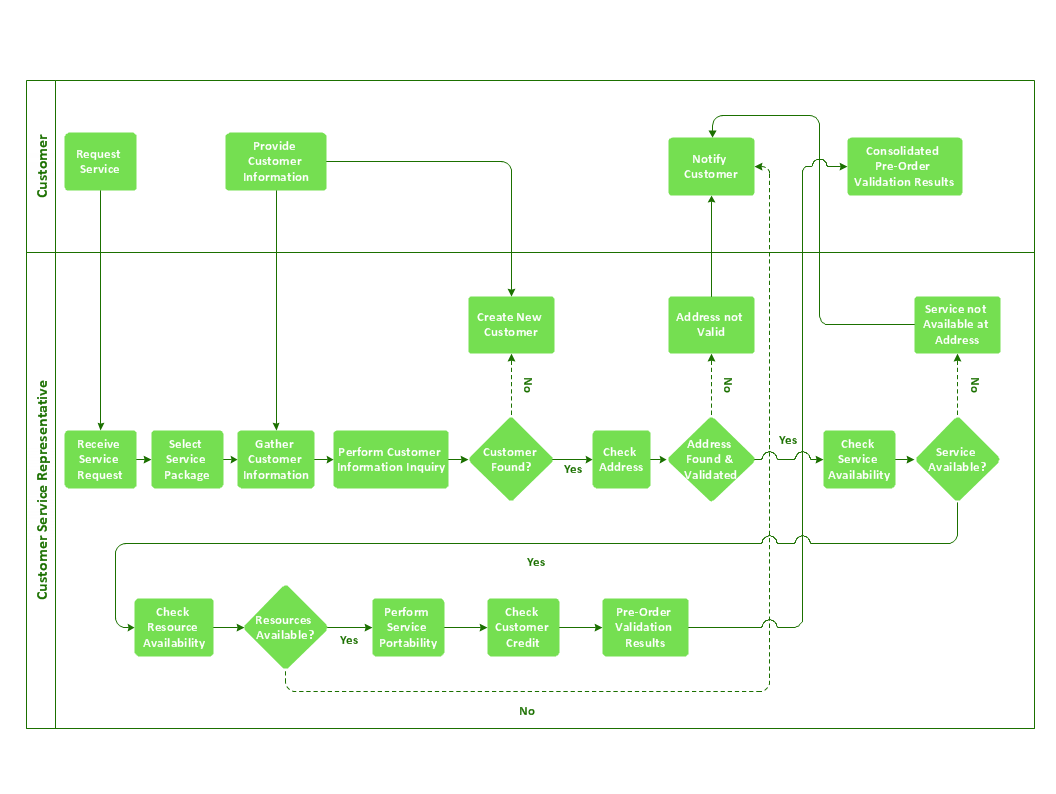
A Flowchart is a type of diagram used for designing, analyzing, documenting, and managing processes and programs, it visually represents an algorithm, workflow, or process using the boxes objects to show the steps, connecting them with arrows, and applying a diamond symbol to represent a decision.
Flowchart diagrams are often used as a visual guide to projects. Being used in marketing and project management they help to visualize stages of marketing activities, a process flow of project management, project steps or a project life cycle that is basic for most project management methods. Breaking a project into phases allows it to be tracked in the proper manner.
Through the separation of phases, the total workflow of a project is divided into some foreseeable components, thus making it easier to follow the project status. A project life cycle commonly includes: initiation, definition, design, development, and implementation phases. It is also a distinguished method to show parallel and interdependent processes, as well as project life cycle relationships.
Benefits of Using Flowcharts in Various Industries
Flowcharts are multi-functional and provide a lot of benefits when used in different industries, including:
- software development,
- manufacturing,
- business,
- finance,
- marketing,
- sales,
- logistics,
- healthcare,
- pharmaceuticals,
- education,
- construction,
- consulting, and other industries.
They act as a universal language for any industry, are adaptable, provide a simple understanding of processes, systems, procedures, or workflows regardless of industry, and help teams from different departments or disciplines communicate more effectively.
Flowcharts help standardize procedures and ensure high quality, safety, and performance by clearly documenting. They provide support for training and onboarding, help to mitigate risks early, develop contingency plans, make it easier for individuals to follow logical steps, streamline issue resolution, and assist in making informed decisions. Flow diagram helps to reduce waste, optimize resource allocation, identify areas for improvement, and increase accountability in project management, construction, healthcare, and other fields.
Flowcharts in Business
Being used in business, Flowcharts enable visualization of business strategies, processes, and multiple solutions. They help optimize business processes, identify and solve problems efficiently reducing the likelihood of recurrence, and provide a more structured approach to decision-making. Flowcharts help to improve efficiency in diagnosing issues and handling them, as well as prevent oversights and mistakes.
Flowcharts enhance communication, collaboration, and strategic planning. By identifying inefficiencies, redundancies, and bottlenecks, they help organizations optimize workflows, reduce downtime and errors, identify potential risks, problem areas, or weak points in operations, improve overall productivity in various sectors, and reduce time spent on troubleshooting.
Flowcharts help teams stay on track and deliver results efficiently, identify root causes, and develop structured approaches to solve problems. This makes them a flexible tool for industries experiencing rapid change, such as tech and e-commerce. Flowcharts are also used to monitor and improve quality control, ensure consistency and safety.
Flowcharts in Software Development
Flowcharts are widely used in software development. They are one of the key tools for software engineers and developers at all stages from planning to maintaining or updating software. Flowcharts help to document software logic and functionality, visualize the expected software behavior, clear project scope definition, and realize efficient requirement analysis.
Flowchart are useful for designing efficient and understandable algorithms, analysis, and making better code structures. They speed up the software development cycle and support agile development, help to retrace the process and except logical errors. Flowcharts show the system’s architecture and data flow, make the debugging process more systematic and less time-consuming, can reflect changes in the system design or logic, and improve testing and quality assurance.
Flowchart diagram helps to onboard new developers faster, facilitates collaboration with non-technical stakeholders, reduces misunderstandings, simplifies problem-solving, and helps the team stay aligned with evolving project requirements. Flowcharts also ensure that everyone involved in the development process is aligned with the project’s goals and logic.
Flowcharts in Project Management
One of the fields of Flowcharts application is planning and project management. In this area, they simplify project review by providing a visual representation of project tasks, milestones, and dependencies. They make reporting and tracking project progress easy, enhance understanding of the project's scope and objectives, help to simplify complex processes, ensure better resource allocation, risk management, and issue resolution, as well as minimize waste and delays.
Easy Way to Draw Flowchart
Are you confused about how to build a Flowchart? The ConceptDraw DIAGRAM is a professional software for the quick and easy building of great-looking Flowcharts of various types and any degree of complexity. ConceptDraw DIAGRAM helps you to perform as a real specialist even if you never had any experience in creating any kind of chart before. Moreover, it helps you to make your Flowcharts looking professionally good and smart.
ConceptDraw DIAGRAM flow diagram maker will help you in flowchart drawing due to the included templates, samples, and vector object libraries, which are offered in great quantity by the Flowcharts solution from the Diagrams area. With the help of our tutorials as well as stencil libraries and lots of examples and templates, you will make the best-looking Flowcharts, diagrams, schemes, plans, and charts as long as you have ConceptDraw DIAGRAM downloaded to your computer. To understand the system and its flow as well as to track its processes, you definitely need our professional software.
Steps of the RapidDraw
The ConceptDraw's RapidDraw technology plays an important role in the simplicity of drawing the Flowcharts. It assists in adding objects with just a single click and creating professional-looking Flowcharts in a few steps.
The vector stencils from the object libraries allow you to use the RapidDraw technology. By clicking on direction arrows one can add a new object to the Flowchart. This technology gives ConceptDraw users the ability to create visualization for the structural data fast and simply.
Follow the next steps:
- Start a new ConceptDraw document.
- Open Flowcharts Rapid Draw library from the Flowcharts solution.
- Add a first object to the page.
- Place the cursor on the object and you will see blue arrows with the drop-down object.
- Pick the needed object.
- A new object is added and connected with the connector.
Note: The new object will also have a Rapid Draw functionality.

- Add new objects using the same method.
Note: New object will be added at the same side as a blue arrow points.

- Continue to draw a Flowchart.

- Flowchart base is ready, let's fill it out.
Note: When you work with rapid draw objects, once you reach the left or bottom edge of the page, its size will double automatically.

- Zoom in the drawing for your convenience. Use mouse scroll with held Command (Ctrl).
- Change size and fill the text in the needed object.

- Align objects using Align options on the ribbon. All objects will be aligned based on the object highlighted in green.
- Add text and change size, if needed.

- Change object's disposition regarding one another.
- Change the path of the connector using yellow control dots. In this case connector will stick to the new trajectory, even if you move the connected object.

- Align objects horizontally.

- Fill in the text.
- Allign text center using Inspector.

- Add missing connectors to the objects. Connection points will appear as crosses.

- Add new connectors, if needed.
- Connect connector with object's center; in this case, when you move an object, the connector will follow the closest path side.

- Adjust the page size to the drawn flowchart file using the Document Properties - Page Size menu.

- Select the connector and add the text to it.
- Adjust its angle and object box.

- Add text to other objects and connectors.
- Adjust its position with a yellow control dot.

- Select all objects with Command + A.
- Use Shape menu - Make Same - Size, to equalize it.
- Select a few objects with the held Shift button.
- Align objects.
- Select few objects.
- Open Inspector from ribbon.
- Set the color and switch off the stroke.

- Repeat actions for another group of objects.
- Again, adjust the page size to the File.
- Select connectors.
- Change colors and end objects.
- Change connector's text color.

- Double click on a page name at Pages inspector.
- Enter the page's name.

- Check your document.
- Adjust objects and connectors, if needed.
- Revert connectors, if needed.

- Your Flowchart is ready!

- All exporting commands are available at ConceptDraw DIAGRAM from the File menu. You can immediately apply them when your Flowchart is ready.


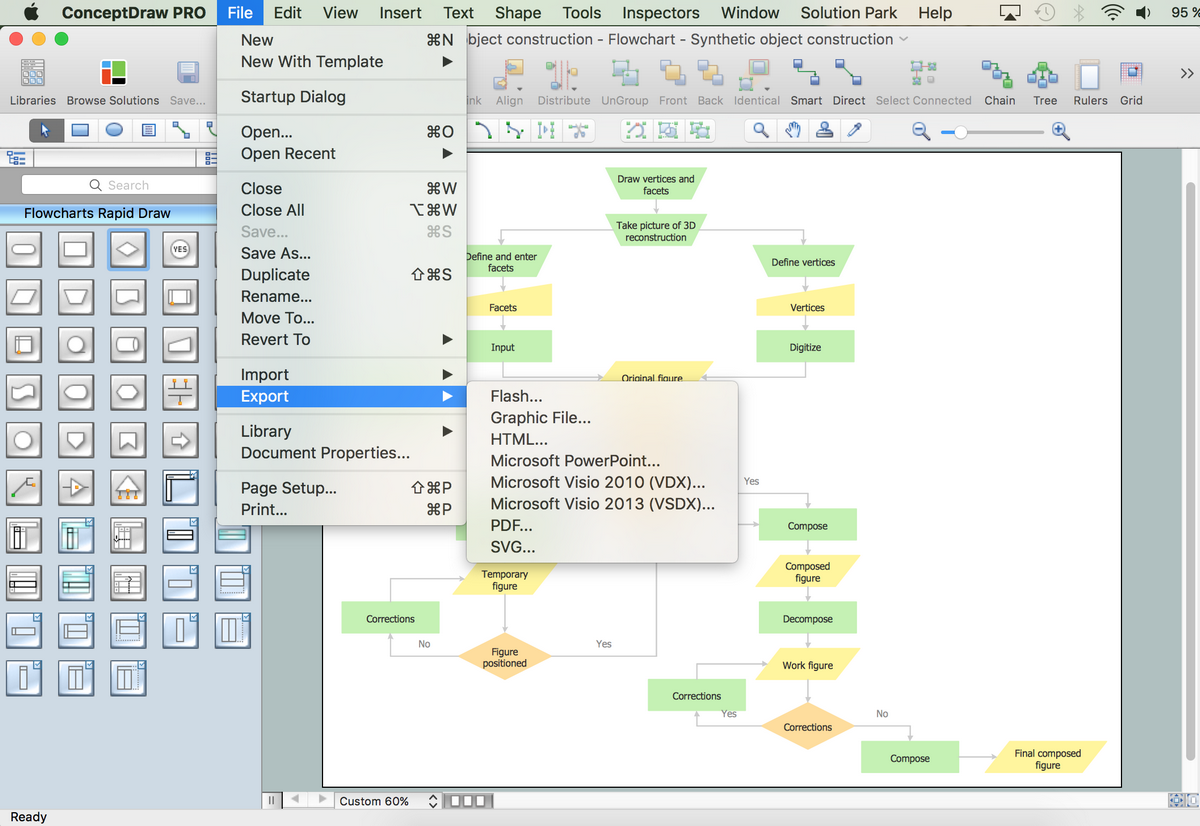
The possibility of exporting to variety of popular graphical formats (PNG, JPEG, JPG, GIF, TIF, TIFF, BMP, DIB, EMF, SVG) and file formats, such as Microsoft PowerPoint (PPT), Adobe Acrobat (PDF), Microsoft Visio (VDX, VSDX), Adobe Flash (SWF), Encapsulated PostScript (EPS), HTML, opens wide opportunities for you.


Now, you can fast and easy create your Flowcharts with powerful ConceptDraw DIAGRAM software. And thanks to the wide export capabilities effectively collaborate and exchange information with other people, demonstrate your Flowcharts to wide auditory and your colleagues, even if they don't have the ConceptDraw DIAGRAM software.
Video: How to Build a Flowchart (1min 49sec)
Conclusion
Drawing charts, diagrams, flowcharts, and network layouts has long been the monopoly of Microsoft Visio, making Mac users struggle when needing such Visio alternatives like Visio for Mac, which provides only viewing features, making a minor edit to, or printing a diagram or chart. ConceptDraw DIAGRAM software, a cross-platform charting and business process management tool to create flow diagram, is a perfect alternative to MS Visio. With this Visio alternative, any sort of diagram is not a problem anymore.
Create easily professional-looking Flowchart diagrams of any complexity and any degree of detailing in the best flowchart maker ConceptDraw DIAGRAM with Flowcharts solution included. Succeed in drawing the Flowcharts using quick-start templates, predesigned samples, and extensive libraries of ready-made flowchart symbols, blocks, and icons.