Entity Relationship Diagram Symbols
About Entity-relationship Diagram
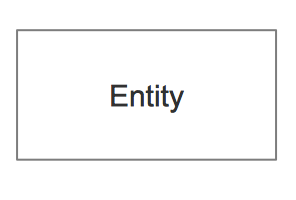
The so-called semantic modeling method nowadays is commonly used in database structure design. Semantic modeling is modeling data structures, based on the meaning of these data. Different variants of the entity-relationship diagrams are used as a tool for the semantic modeling. ER-model based diagrams have three main components: an entity, a relation and attributes. An entity is a class of similar objects, information about which should be taken into account in the model. Each entity must have a name, expressed by a noun in the singular. Examples of entities can be such classes of objects as "Supplier", "Employee", "Invoice". Each entity in the model is depicted in the form of a rectangle with the name.
While determining the type of entity it is necessary to be sure that each instance of an entity may be indistinguishable from any other instance of the same entity.
Relation is presented in the form of non-directional line connecting two entities or leading from the entity to itself. In the place of "docking" an entity uses:
- three-point entry to the entity rectangle, if many instances of the entity may be used for this relation
- single-point entry, if relation can (or should) participate in only one instance of the entity.
Relation between entities "ticket" and "passenger" connects passengers and tickets. One side of the relation with a label "for" is a many-to-many relation which allows to relate more than one ticket to a passenger, and each ticket must be linked to any passenger. Another side of the relation with a label "have" is a zero or one relation, which shows that each ticket can belong to only one passenger, and the passenger is not obliged to have at least one ticket.
Attribute of an entity is a detail or feature that is used for verification, identification, classification, numerical characteristics or expressing status of the entity. Attribute names are recorded in the rectangle representing an entity under entity name. For instance, an entity "human being" may have such attributes as gender, year of birth, first name, etc.
It is the specialized Entity Relationship diagram symbols, and the meanings of those symbols
Entity Relationship Diagram Symbols — Chen notation
Symbol | Shape Name | Symbol Description |
Entities | ||
![]() |
Entity | An entity is represented by a rectangle which contains the entity’s name. |
![]() |
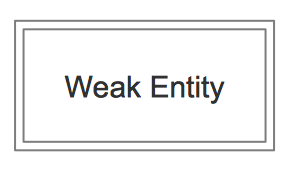
Weak Entity | An entity that cannot be uniquely identified by its attributes alone. The existence of a weak entity is dependent upon another entity called the owner entity. The weak entity’s identifier is a combination of the identifier of the owner entity and the partial key of the weak entity. |
![]() |
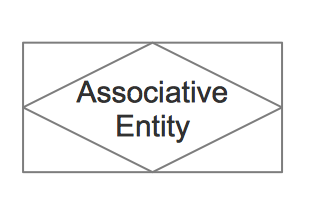
Associative Entity | An entity used in a many-to-many relationship (represents an extra table). All relationships for the associative entity should be many |
Attributes | ||
![]() |
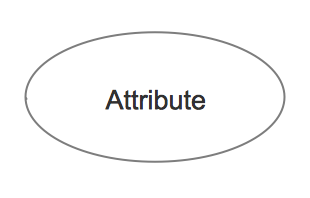
Attribute | In the Chen notation, each attribute is represented by an oval containing atributte’s name |
![]() |
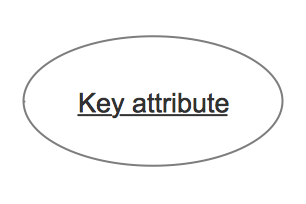
Key attribute | An attribute that uniquely identifies a particular entity. The name of a key attribute is underscored. |
![]() |
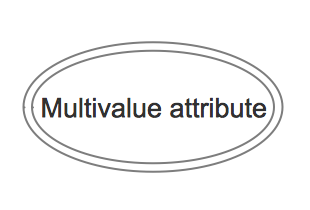
Multivalued attribute | An attribute that can have many values (there are many distinct values entered for it in the same column of the table). Multivalued attribute is depicted by a dual oval. |
![]() |
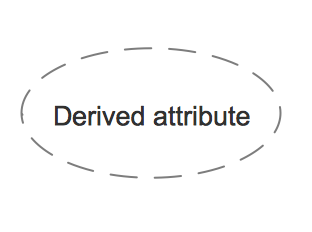
Derived attribute | An attribute whose value is calculated (derived) from other attributes. The derived attribute may or may not be physically stored in the database. In the Chen notation, this attribute is represented by dashed oval. |
Relationships | ||
![]() |
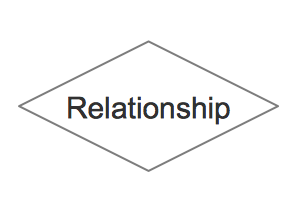
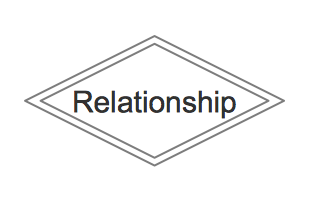
Strong relationship | A relationship where entity is existence-independent of other entities, and PK of Child doesn’t contain PK component of Parent Entity. A strong relationship is represented by a single rhombus |
![]() |
Weak (identifying) relationship | A relationship where Child entity is existence-dependent on parent, and PK of Child Entity contains PK component of Parent Entity. This relationship is represented by a double rhombus. |
Entity Relationship Diagram Symbols — Crow’s Foot notation
Symbol | Meaning | |
Relationships (Cardinality and Modality) | ||
![]() |
Zero or One | |
![]() |
One or More | |
![]() |
One and only One | |
![]() |
Zero or More | |
Many - to - One | ||
![]() |
a one through many notation on one side of a relationship and a one and only one on the other | |
![]() |
a zero through many notation on one side of a relationship and a one and only one on the other | |
![]() |
a one through many notation on one side of a relationship and a zero or one notation on the other | |
![]() |
a zero through many notation on one side of a relationship and a zero or one notation on the other | |
Many - to - Many | ||
![]() |
a zero through many on both sides of a relationship | |
![]() |
a zero through many on one side and a one through many on the other | |
![]() |
a one through many on both sides of a relationship | |
![]() |
a one and only one notation on one side of a relationship and a zero or one on the other | |
![]() |
a one and only one notation on both sides |
There are many notation styles that express cardinality:
- Information Engineering Style;
- Chen Style;
- Bachman Style;
- Martin Style;

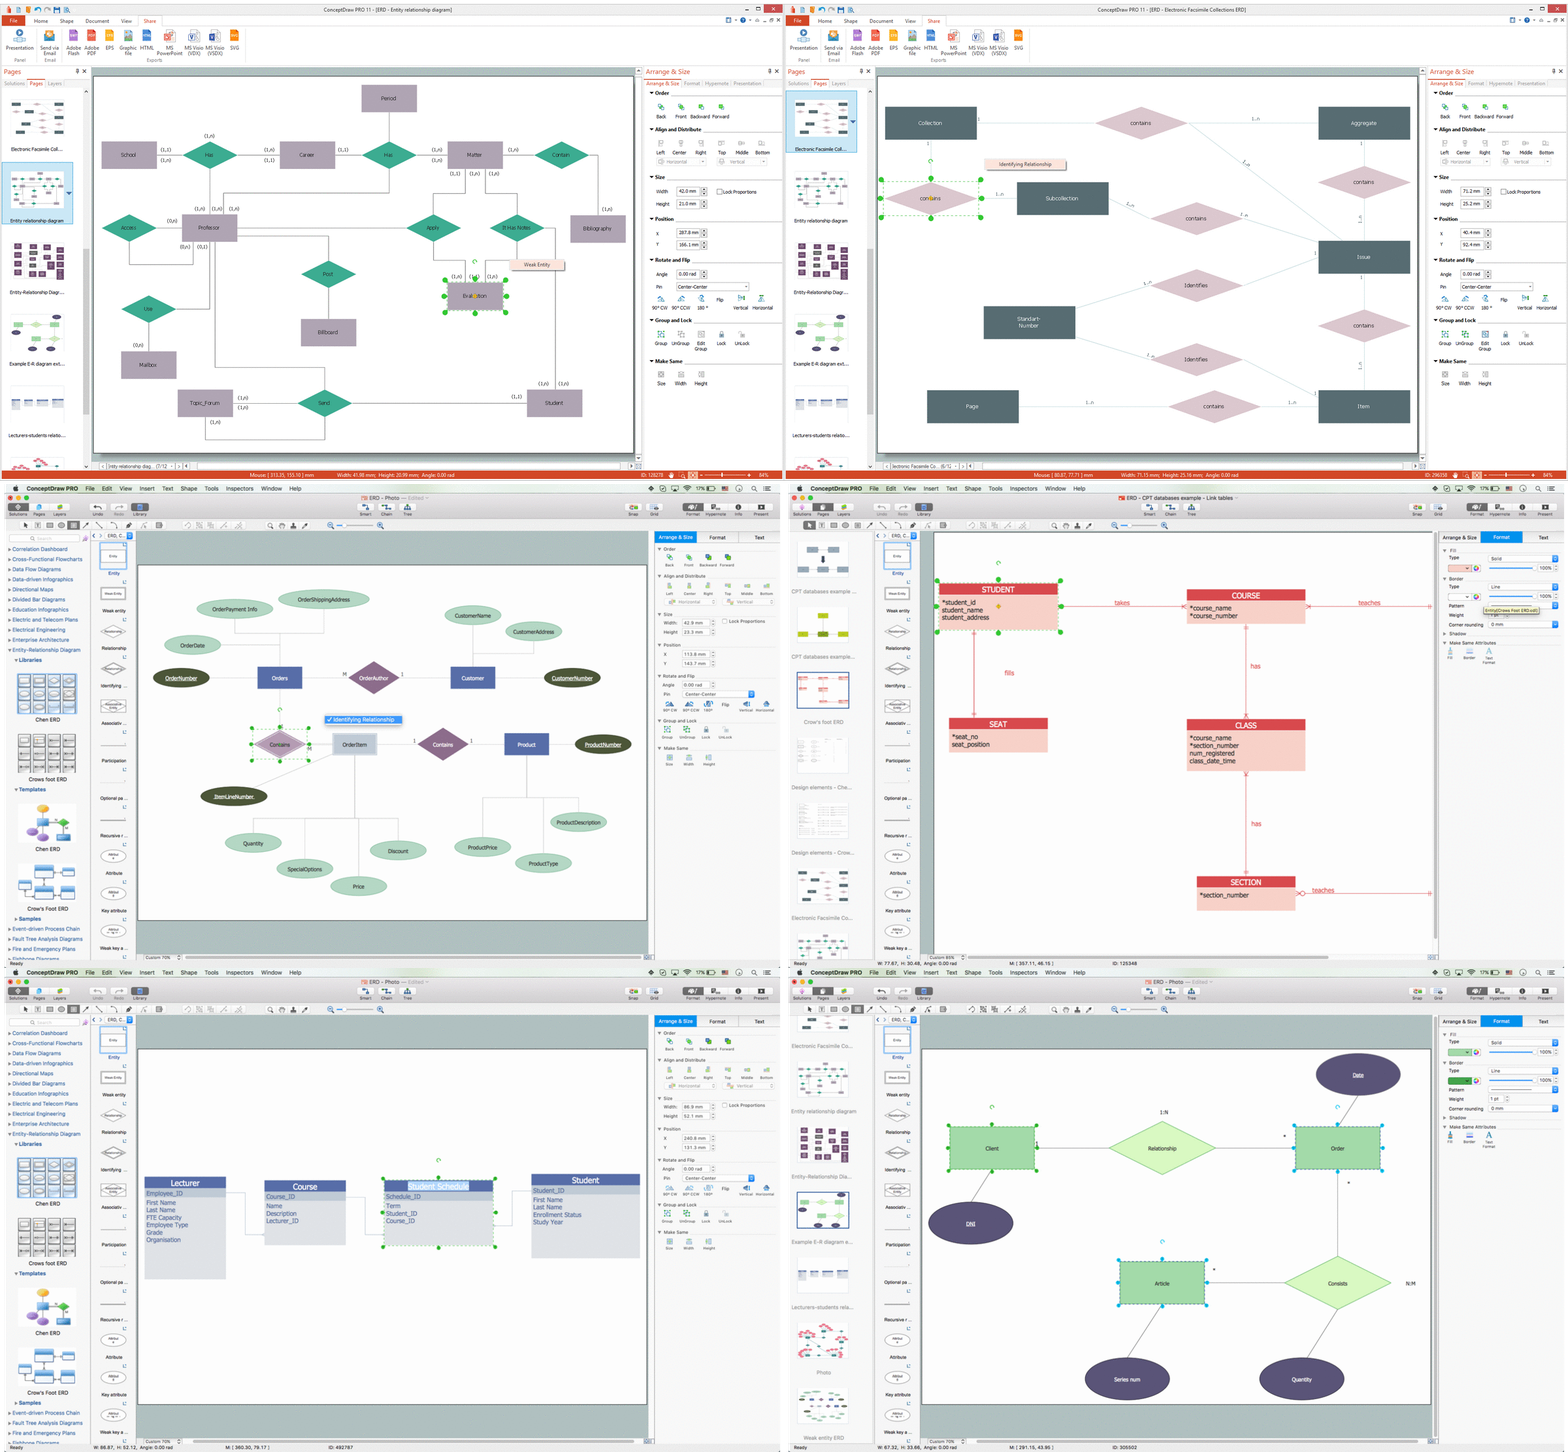
Example 1. Entity relationship diagram symbols, Chen's and Crow’s Foot notation
Entity-Relationship model making possibility to describe a database by abstract way. The data in database tables can be the point to data in other tables - for instance, your entry in the database could point to several entries.
Example 2. Entity Relationship Diagram (ERD) Software (Windows)
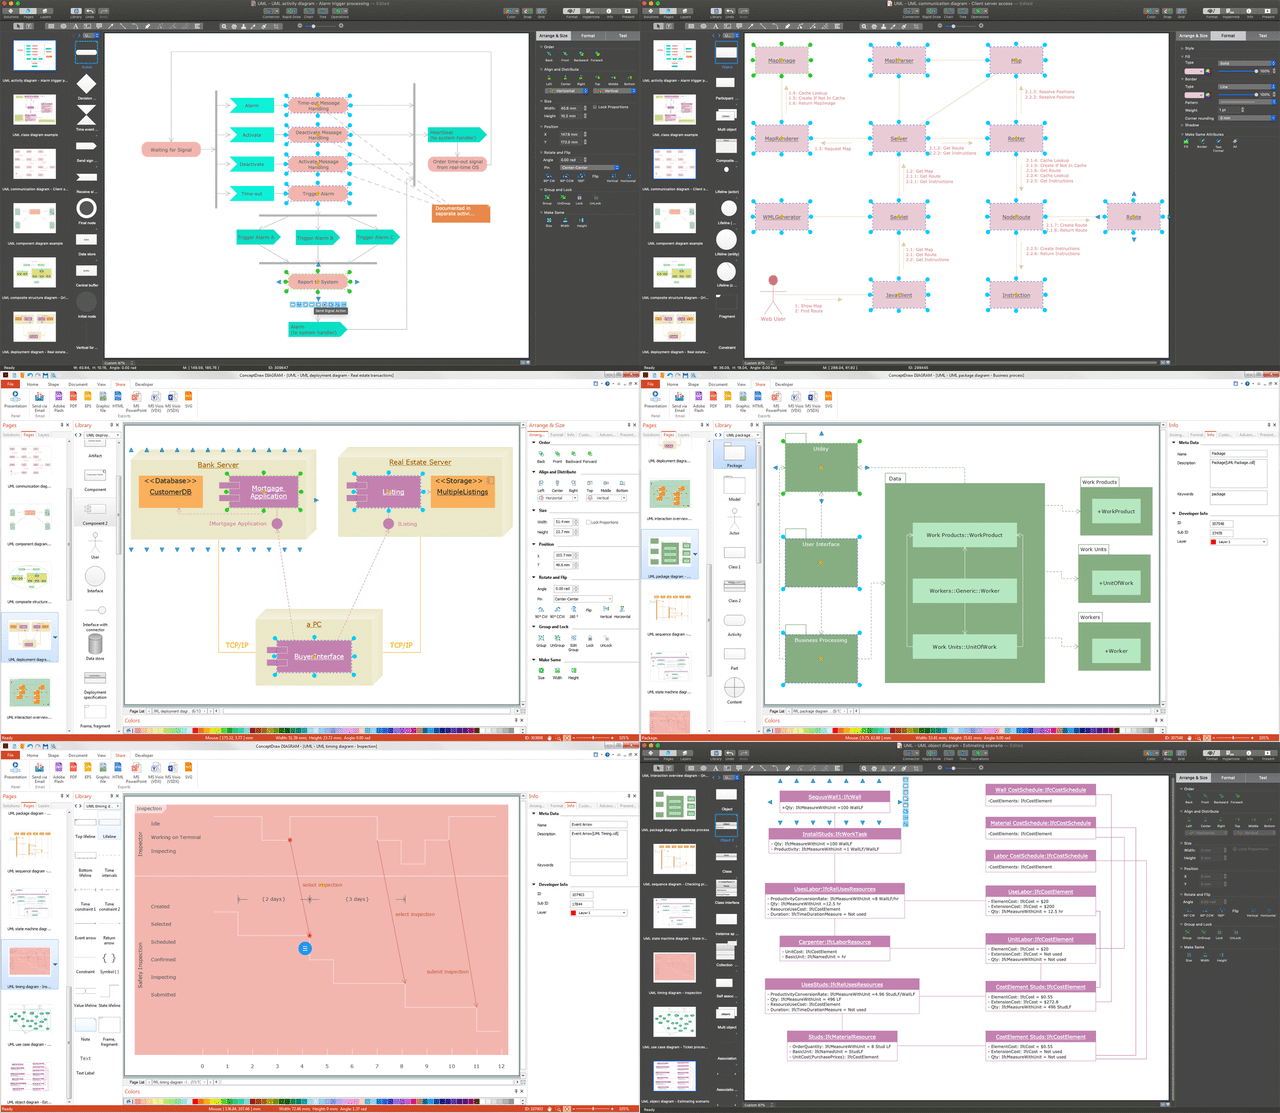
ConceptDraw DIAGRAM software thanks to the included Entity-Relationship Diagram (ERD) solution gives the ability to describe visually a database using the Chen's and Crow’s Foot notation icons for drawing ER diagrams (ERD).
Example 3. Entity Relationship Diagram (ERD) Software (macOS)
Very commonly used in the database structure design, the sematic modelling method is one the ways of describing data structures as well as its modelling, based on the meaning of this data. ER-model based diagrams (ERD) consist of these main components: relation, entity and attributes. To be able to create such diagram, you have to mention the entities with their names presented in a form of a rectangle and the relations in a way of non-directional line connecting two entities. To help you to create this chart, we developed ConceptDraw STORE product full of libraries with vector elements you can use for your flowchart. Also we provide you with Solutions section on this site where you can find the numerous stencil libraries, samples and examples to simplify your work with software called ConceptDraw DIAGRAM which is the only one offering that many symbols and templates for making professionally looking smart and mature diagrams.
TEN RELATED HOW TO's:
ERD Symbols and Meanings →
A database is a data collection, structured into some conceptual model. Two most common approaches of developing data models are UML diagrams and ER-model diagrams. There are several notations of entity-relationship diagram symbols and their meaning is slightly different. Crow’s Foot notation is quite descriptive and easy to understand, meanwhile, the Chen notation is great for conceptual modeling. An entity relationship diagrams look very simple to a flowcharts. The main difference is the symbols provided by specific ERD notations. There are several models applied in entity-relationship diagrams: conceptual, logical and physical. Creating an entity relationship diagram requires using a specific notation. There are five main components of common ERD notations: Entities, Actions, Attributes, Cardinality and Connections. The two of notations most widely used for creating ERD are Chen notation and Crow foot notation. By the way, the Crow foot notation originates from the Chen notation - it is an adapted version of the Chen notation.
Flowchart design. Flowchart symbols, shapes, stencils and icons →
When thinking about data visualization, one of the first tools that comes to mind is a flowchart design. You can find flowchart symbols, shapes, stencils and icons easily on the Internet, but it might take time to systematize this information. Nevertheless, once you start flowcharting, you’ll love its simplicity and efficiency. This diagram consists from standard flowchart symbols, approved by ANSI (American National Standard Institute) for drawing flowcharts. A flowchart is a diagram that represents a step-by-step algorithm of any process, displaying the process stages as boxes that are connected with arrows. Flowchart design makes it clear and readable. Flowchart designed using ConceptDraw DIAGRAM flowchart software allows to make attractive and clear process presentation, it makes interpretation of the business process flow fresh and versatile. Great flowchart design view is a big advantage over the diagram created manually on a paper.
Electrical Symbols, Electrical Diagram Symbols →
Electrical Engineering Solution used together with ConceptDraw DIAGRAM drawing facilities makes short a work of drawing various electrical and electronic circuit schemes. A library of vector objects composed from symbols of Analog and Digital Logic elements of electric circuit includes 40 symbolic images of logic gates, bistable switches of bi-stable electric current, circuit controllers, amplifiers, regulators, generators, etc. All of them can be applied in electronic circuit schemes for showing both analog and digital elements of the circuit. Electrical Engineering Solution used together with ConceptDraw DIAGRAM drawing facilities makes short a work of drawing various electrical and electronic circuit schemes. A library of vector objects composed from symbols of Analog and Digital Logic elements of electric circuit includes 40 symbolic images of logic gates, bistable switches of bi-stable electric current, circuit controllers, amplifiers, regulators, generators, etc. All of them can be applied in electronic circuit schemes for showing both analog and digital elements of the circuit.
Components of ER Diagram →
It is easy to recreate any informational system structure using diagrams. There are three main components of any ER diagram: entity, attribute and relationship. Basing on these three components, one can define other, less used elements, such as weak entity or relationship, derived attribute, recursive relationship etc. This is the set of graphic elements of ERD Chen's notation. This ERD notation is used to represent an entity–relationship models. It involves the set of geometric forms: rectangles - depicting entities, ovals - representing attributes and diamonds depicting relationships assigned for first-class objects, that can have relationships and attributes of their own. Connections are displayed with arrowed lines. It is known that the Chen's ERD notation is used to show a detailed view of entities and relationships. ConceptDraw Entity-Relationship Diagram solution from the Software Development section of Solution Park provides the ability to create ERD of database structure for software development purposes using the Chen’s notation elements.
Basic Flowchart Symbols and Meaning →
While creating flowcharts and process flow diagrams, you should use special objects to define different statements, so anyone aware of flowcharts can get your scheme right. There is a short and an extended list of basic flowchart symbols and their meaning. Basic flowchart symbols include terminator objects, rectangles for describing steps of a process, diamonds representing appearing conditions and questions and parallelograms to show incoming data. This diagram gives a general review of the standard symbols that are used when creating flowcharts and process flow diagrams. The practice of using a set of standard flowchart symbols was admitted in order to make flowcharts and other process flow diagrams created by any person properly understandable by other people. The flowchart symbols depict different kinds of actions and phases in a process. The sequence of the actions, and the relationships between them are shown by special lines and arrows. There are a large number of flowchart symbols. Which of them can be used in the particular diagram depends on its type. For instance, some symbols used in data flow diagrams usually are not used in the process flowcharts. Business process system use exactly these flowchart symbols.
Entity Relationship Diagram Examples →
An abstract representation is usually the first thing you will need while developing a database. To understand the ways that databases are structured, you should look through entity-relationship diagram examples and see the notations features and attributes. With an entity-relationship model you can describe a database of any complexity. This Entity-relationship diagram is a tool for software developers. It enables every element of database to be managed, communicated and tested before release. This ERD was created using symbols advocated by Chen's notation. Because of a linguistic origin of the Chen’s notation, the boxes representing entities could be interpreted as nouns, and the relationships between them are in verb form, shown on a diagram as a diamond.
Anyone Have an ERD Symbols Quick Reference? →
ERD drawing becomes easier with predesigned entity relationship symbols, work flow shapes, entity relationship stencils. All variety of ERD symbols you may need for ERDs design is packed into libraries and templates from Entity-Relationship Diagram (ERD) Solution for ConceptDraw DIAGRAM diagramming and vector drawing software. But anyone have an ERD symbols quick reference? Detailed reference information for them is represented at the tables.
Formalization and Verification of Event-driven Process chain →
EPC or The Event - driven Process Chain diagrams that provide Enterprise Resource Planning improvement. ConceptDraw DIAGRAM - software that reduces the time needed to create a business process model.
Design Element: Chen for Entity Relationship Diagram - ERD →
It is very difficult to get into database model idea without any examples. To create one, you can use Chen’s notation for Entity Relationship Diagrams (ERD) and try to see all the peculiarities yourself. This notation describes entities and relations as basic geometric shapes like rectangles and diamonds. Chen notation for Entity-relationship diagrams is used for designing relational databases. It depicts the database entities as a set of subjects. For example events, people, ideas, etc. All entities has common characteristics (attributes). Any object of the system is identified as the sole and unique. The name of entity should indicate the class or type of the the whole object, not a given example. The connection commonly represents a relationship between entities. Conceptdraw Entity-Relationship Diagrams (ERD) solution provides the libraries with ready-to-use ERD element fitting Chen's notation objects and relationships.
ER Diagram Styles →
When creating ER diagrams, you can apply different color ER diagram styles and also notation styles. ConceptDraw DIAGRAM enhanced with Entity-Relationship Diagram (ERD) Solution gives the ability to draw visual and attractive ER Diagrams using the style icons from Crow’s Foot notation and Chen's notation professionally designed and offered by ERD Chen's Notation and ERD Crow’s Foot Notation libraries.