Swim Lane Diagrams
In each company business-processes are allotted among workers and departments. One the same process may be fulfilled by several workers simultaneously or by turns. In such cases it is quite difficult to define the reasons of delays, defects and narrow places during the process. The documenting of business-processes in the company is required. One of the tools for documenting of business-processes is the Swim Lane diagram.
Swim Lane diagrams are the variety of process flow diagrams and are based on the IDEF3 standard. They were developed by Lynn Shostack for usage in projecting. With their help organization diagrams are combined with process flow, as they visually display an object of the production system which is charged with given concrete processes in general flow of processes of the production system.
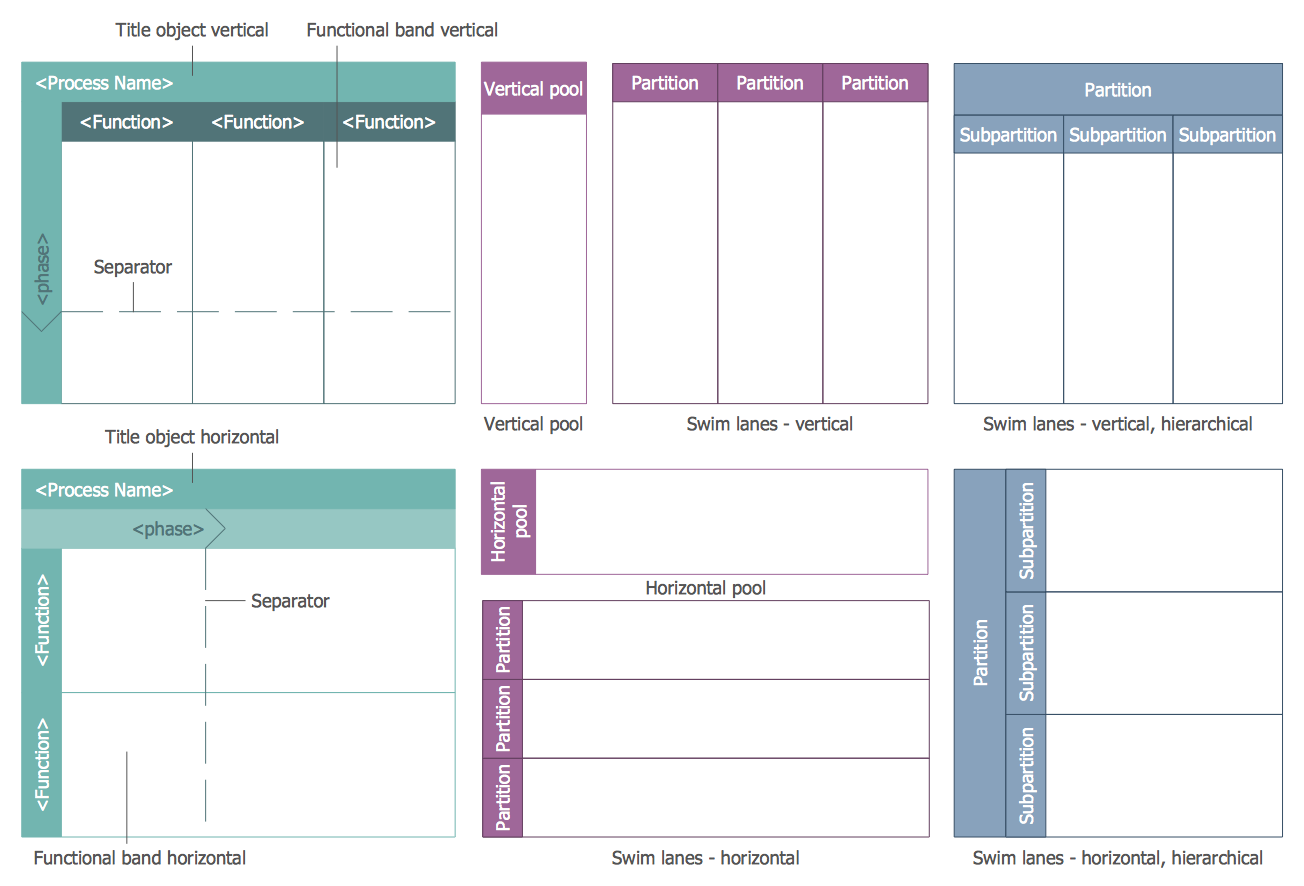
Swim Lane diagram was named this way because all blocks which denote compound parts of processes are located on the definite lanes accordingly to belonging to responsible worker. Thus the diagram resembles a swimming pool with lanes. Lanes may be located either horizontally or vertically, depending on the existing process flow diagram. These lanes are denoted accordingly to resource name, which is charged with execution of the given part of the process.
Pic 1. Swim Lane Diagram
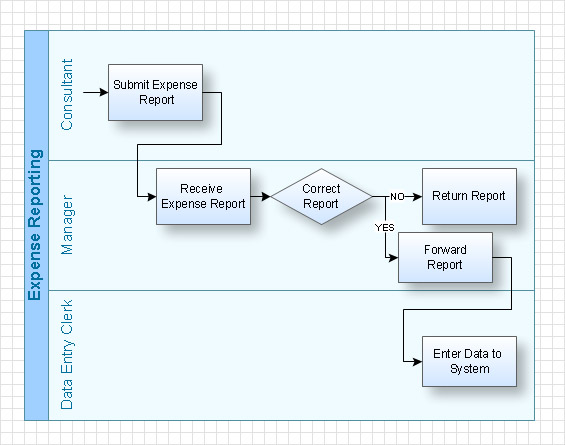
As s result, working process is found divided into parts, with indication of the responsibility for fulfillment of the given part of the process. This significantly facilitates the comprehension of the working process in general and helps to discover weak points, reasons of delays and defects and people responsible for them.
Pic 2. Swim Lane Diagram - Working Process
With the help of Swim Lane diagrams you can always represent working processes of any complication in a simple and visual graphic form and define participants of separate parts of the working process. Besides, Swim Lane diagrams is a simple way to show responsibility zones of personal and interaction points of separate participants of the working process.
Swim Lane diagrams are used in modelling of business processes BPMN and in UML methodology. Such diagrams are called Line of Visibility charts in IBM and Cross-Functional Flow Charts in MS Visio.

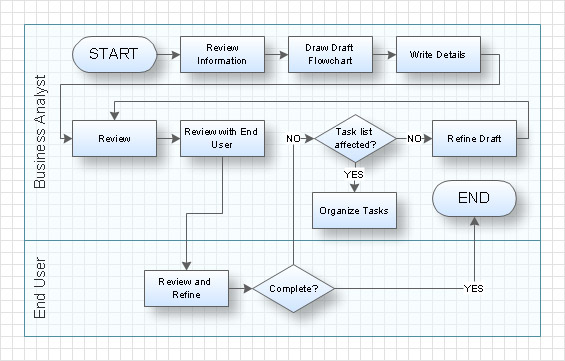
Pic 3. Swim Lane Diagram Example
How to Create a Swim Lane Diagram Using ConceptDraw DIAGRAM
It's incredibly convenient to develop Swim Lanes Flowchart in ConceptDraw DIAGRAM using the predesigned vector objects offered by Swim Lanes library of Business Process Mapping Solution.
Drag the Swim Lanes Vertical object from the Swim Lanes library to the document’s page.
Next add text to the diagram and format the objects.
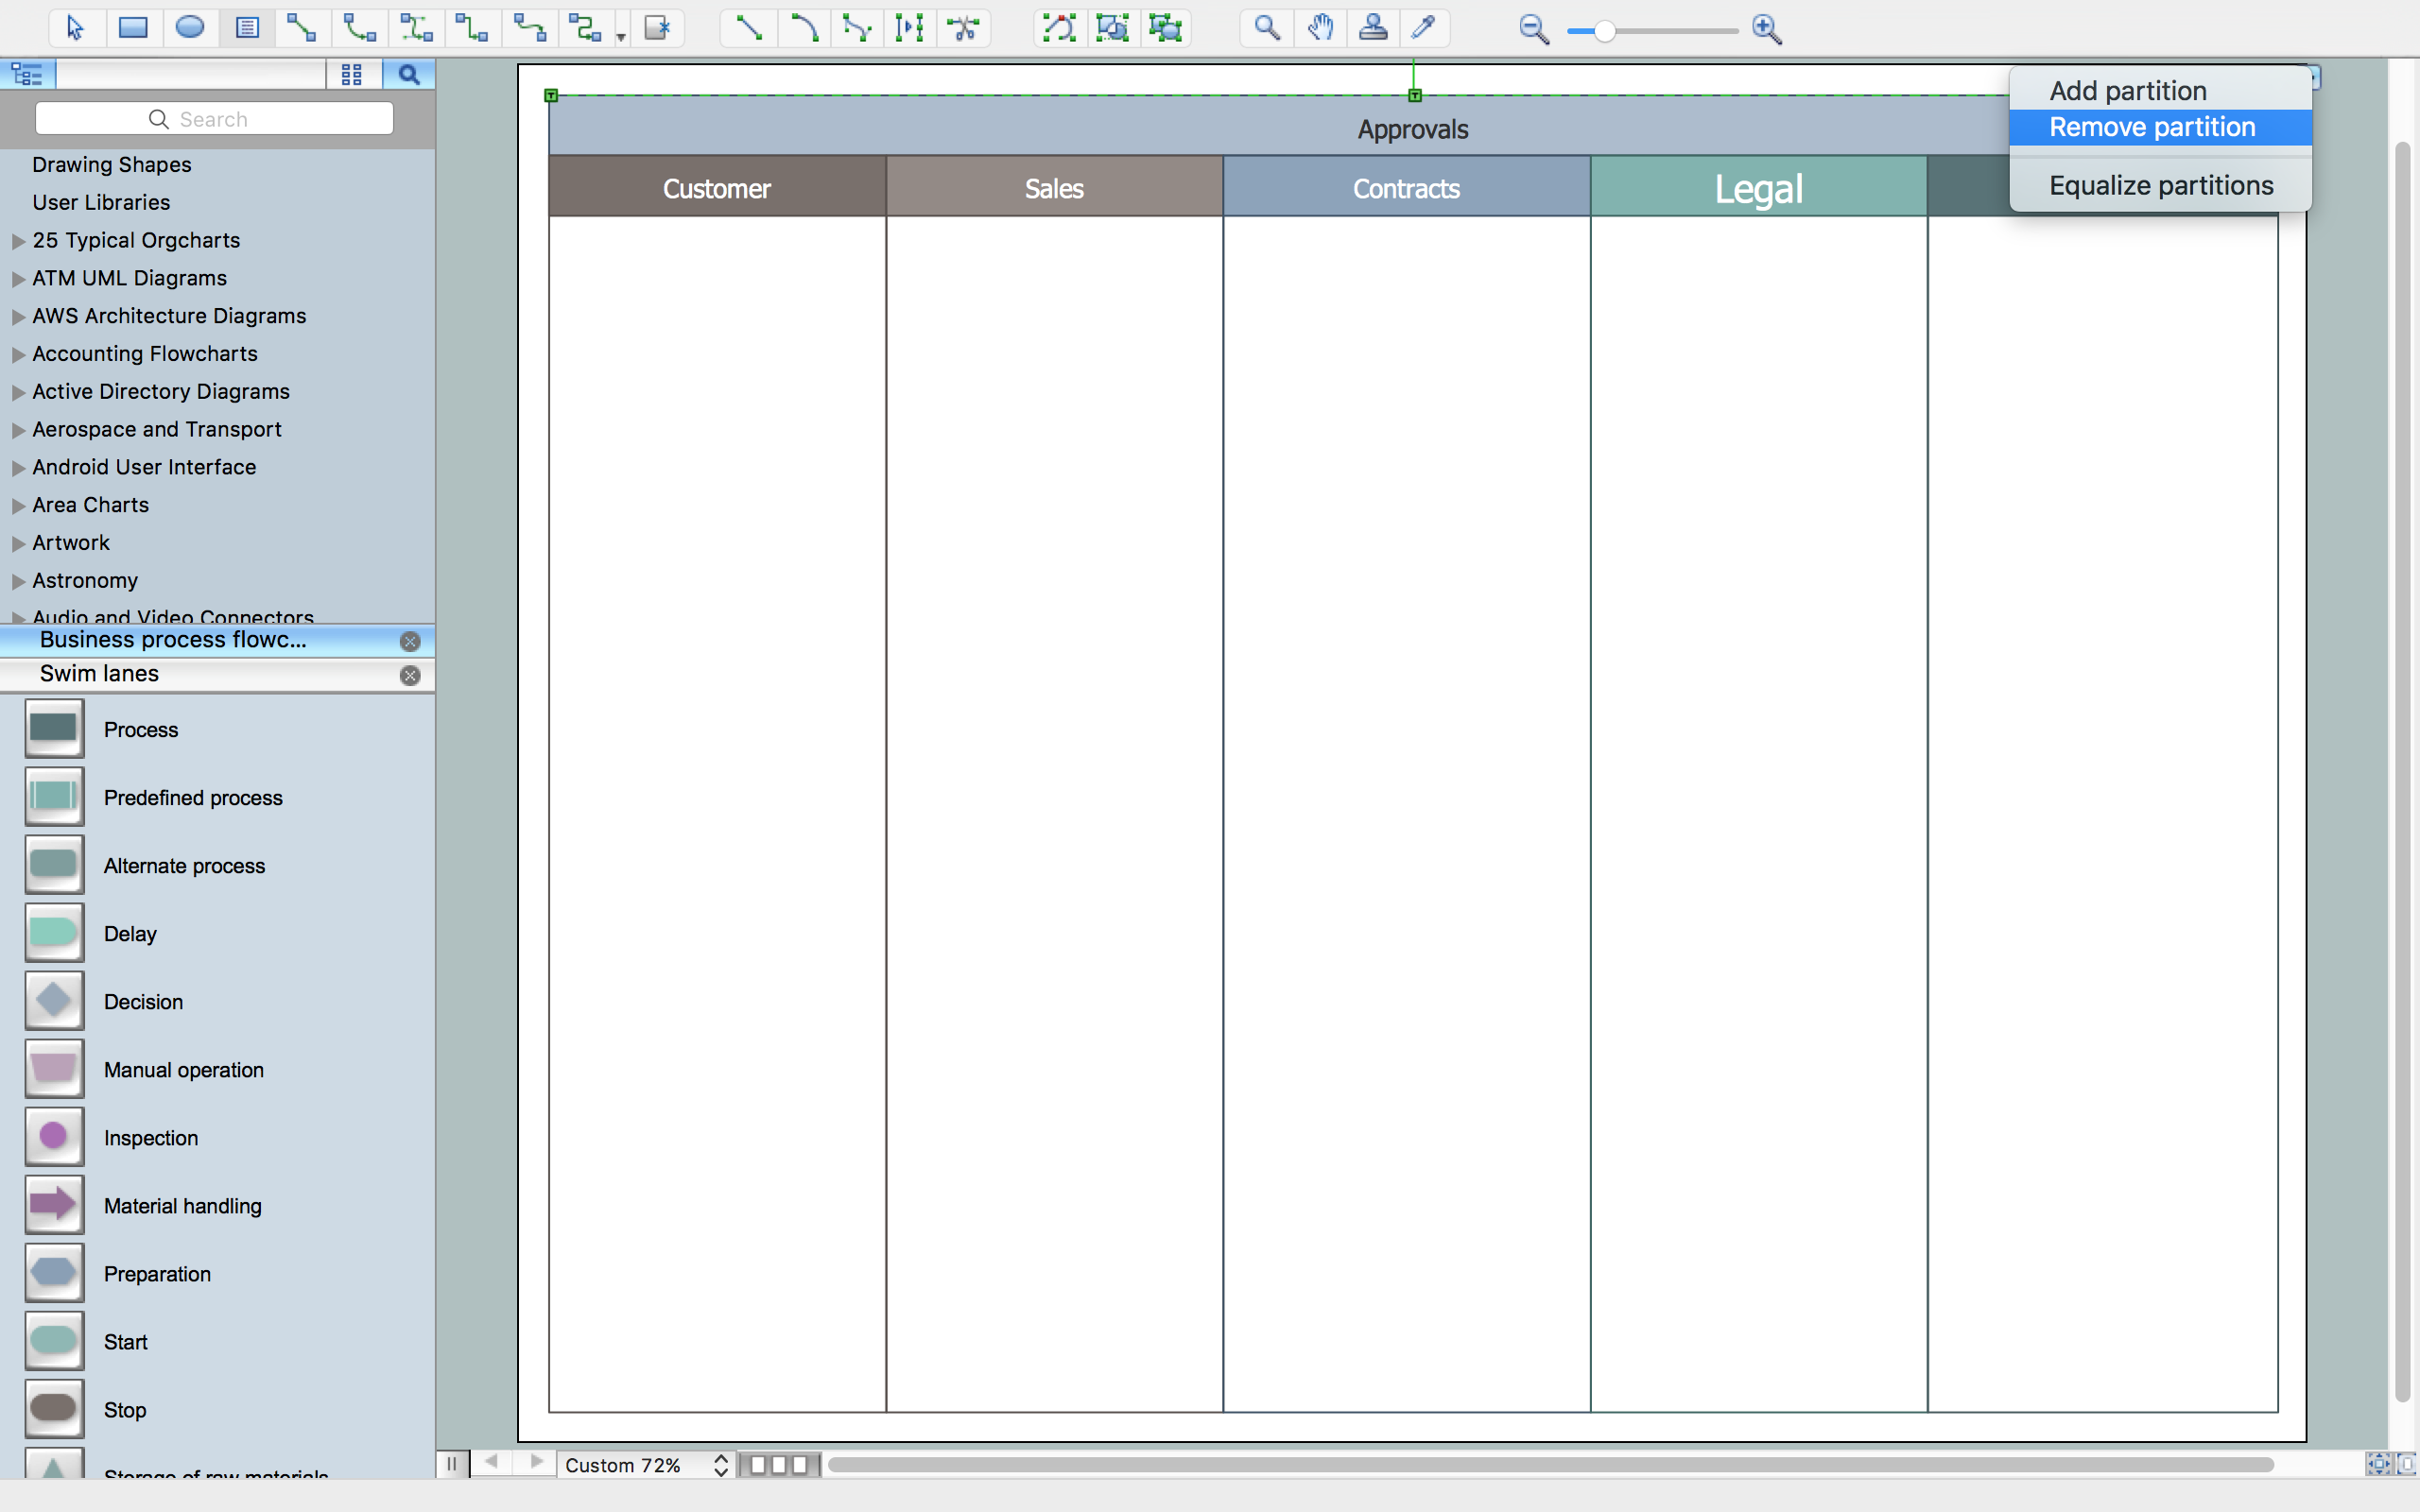
When releasing the mouse button, the object automatically resizes according to the page size. The Action button chain mode button mac allows you to easily add lanes and then equalize them.
Add the shapes to the diagram from the Cross-Functional Flowchart library. They appear on the flowchart as connected objects.
Result: A professional-looking flowchart, that demonstrates the document flow in your organization.
NINE RELATED HOW TO's:
This pyramid chart example is supplied with the ConceptDraw Pyramid Diagrams solution. This is a model of Information Management Systems classification. It is made in a form of a four-level pyramid. The top level shows the information system developed for an executive management. Below, there is a level depicting the system of decision making process for the managers of the senior level. A schematic representation of the middle management information system, following to logic, is in the middle of the pyramid. And at least, the lowermost level represents an information processing system for employees.
Picture: Pyramid Diagram
Related Solutions:
ConceptDraw DIAGRAM diagramming and vector drawing software offers the Pie Charts solution from the Graphs and Charts area which includes the tools for quick and easy designing any kind of Donut Chart.
Picture: Donut Chart
Related Solution:
Definition, examples, layout options, best practices, and common mistakes for cross functional flowcharts (swimlane diagrams).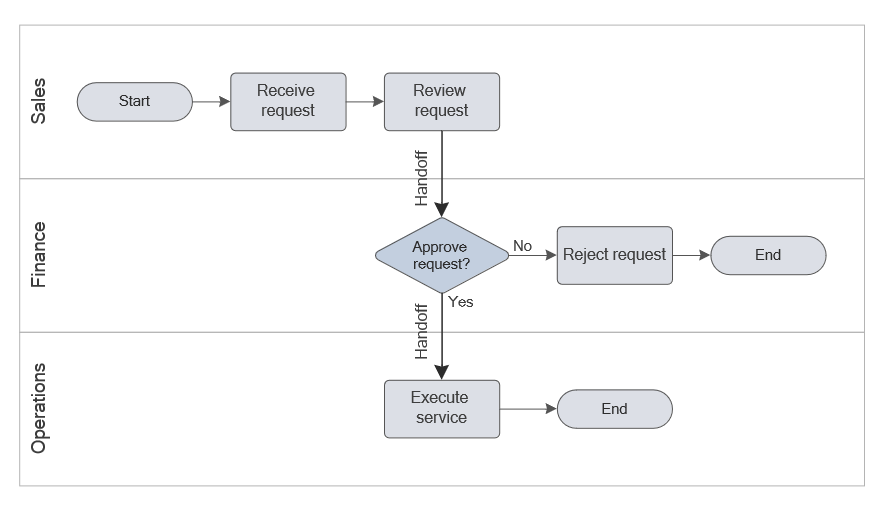
Picture: Cross Functional Flowchart (Swimlane Diagram): Definition, Structure, Examples, and How to Create
Related Solution:
The Total Quality Management Diagram solution helps your organization visualize business and industrial processes. Create Total Quality Management diagrams for business process with ConceptDraw software.
Picture: Definition TQM Diagram
Related Solution:
This sample shows the Business Report Pie Chart. The Pie Chart visualizes the data as the proportional parts of a whole, illustrates the numerical proportion. Pie Charts are very useful in the business, statistics, analytics, mass media.
Picture: Business Report Pie. Pie Chart Examples
Related Solution:
ConceptDraw DIAGRAM extended with Cross-Functional Flowcharts Solution from the Business Processes Area is a powerful software which offers a variety of Cross Functional Flowchart examples. The use of predesigned examples as the base for your own Cross Functional Flowchart Diagrams is a timesaving and useful way.
Picture: Cross Functional Flowchart Examples
Related Solution:
ER diagram is the most popular database design tool which lets create graphical representations of database tables, their columns and also relationships. As for the Mac users, they are very interested in powerful database diagramming tools and ER diagram tool for OS X to design professional looking E-R Diagrams and ERD drawings. ConceptDraw DIAGRAM software on Mac OS X gives the ability to easy draw ERDs.
Picture: ER diagram tool for OS X
Related Solution:
Use case diagrams are used at the development of software and systems for definition of functional system requirements or system of systems. Use case diagram presents the consecution of object’s actions (user’s or system’s) which are executed for reaching the definite result.
Picture: Use Case Diagrams technology with ConceptDraw DIAGRAM
This sample shows the Bar Chart of the leverage ratios for two major investment banks. The leverage ratio is the ratio of the total debt to the total equity; it is a measure of the risk taken by the bank. The higher of the leverage ratio denotes the more risk, the greater risks can lead to the subprime crisis.
Picture: Financial Comparison Chart
Related Solution: