
Example 1. Data Flow Diagram Software
Data Flow Diagrams solution extends ConceptDraw DIAGRAM software with predesigned templates, samples and libraries of design elements for drawing professional-looking Data Flow Diagrams (DFDs). All Data Flow Diagram examples, templates, and samples are available from ConceptDraw STORE at any moment. You can find the Model of Small Traditional Production Enterprise, Process of Account Receivable, Coad/Yourdon Object Oriented Analysis Model, and many more samples.

Example 2. Data Flow Diagrams Solution in ConceptDraw STORE
Moreover, any of the offered examples is easily changed for your needs. The predesigned DFD vector objects grouped in 3 libraries of the Data Flow Diagrams solution are used for this:
- Data Flow Diagrams Library
- Gane-Sarson Notation Library
- Yourdon and Coad Notation Library

Example 3. Data Flow Diagrams Library Design Elements
The Data Flow Diagrams designed in ConceptDraw DIAGRAM will help you effectively model the data flows and functional requirements for a designed system. It supports you in successful communication with your colleagues in business questions.

Example 4. Data Flow Diagram Software - DFD Interaction between IDMA and preprocessor.
The following features make ConceptDraw DIAGRAM the best Data Flow Diagram software:
- You don't need to be an artist to draw professional-looking diagrams in a few minutes.
- Large quantity of ready-to-use vector objects makes your drawing diagrams quick and simple.
- Great number of predesigned templates and samples give you a good start for your own diagrams.
- ConceptDraw DIAGRAM provides you the possibility to use the grid, rules, and guides. You can easily rotate, group, align, arrange the objects, use different fonts and colors to make your diagram exceptionally looking.
- All ConceptDraw DIAGRAM documents are vector graphic files and are available for reviewing, modifying, and converting to a variety of formats: image, HTML, PDF file, MS PowerPoint Presentation, Adobe Flash, MS Visio.
- Using ConceptDraw STORE you can navigate through ConceptDraw Solution Park, managing downloads and updates. You can access libraries, templates, and samples directly from the ConceptDraw STORE.
- If you have any questions, our free of charge support is always ready to come to your aid.
TEN RELATED HOW TO's:
If you ever tried programming, you could face a lot of problems as a beginner. To help yourself, create a flowchart to follow an algorithm logic. Flowchart represents a program as a sequence of steps depicted in special symbols for each type of action.
This image of the interactive diagram made in ConceptDraw DIAGRAM applying the Live Objects technology. The diagram shows the effect of Selection Sort algorithm. The left part of the chart is the input area. The diagram in the central part of the drawing is a flow chart showing of the selection sort algorithm. The flowchart includes basic flowchart symbols, that represent various stages of algorithm. The flowchart symbols are connected with arrows ended lines, that depict the direction of the process flow. On the right side — the result is displayed.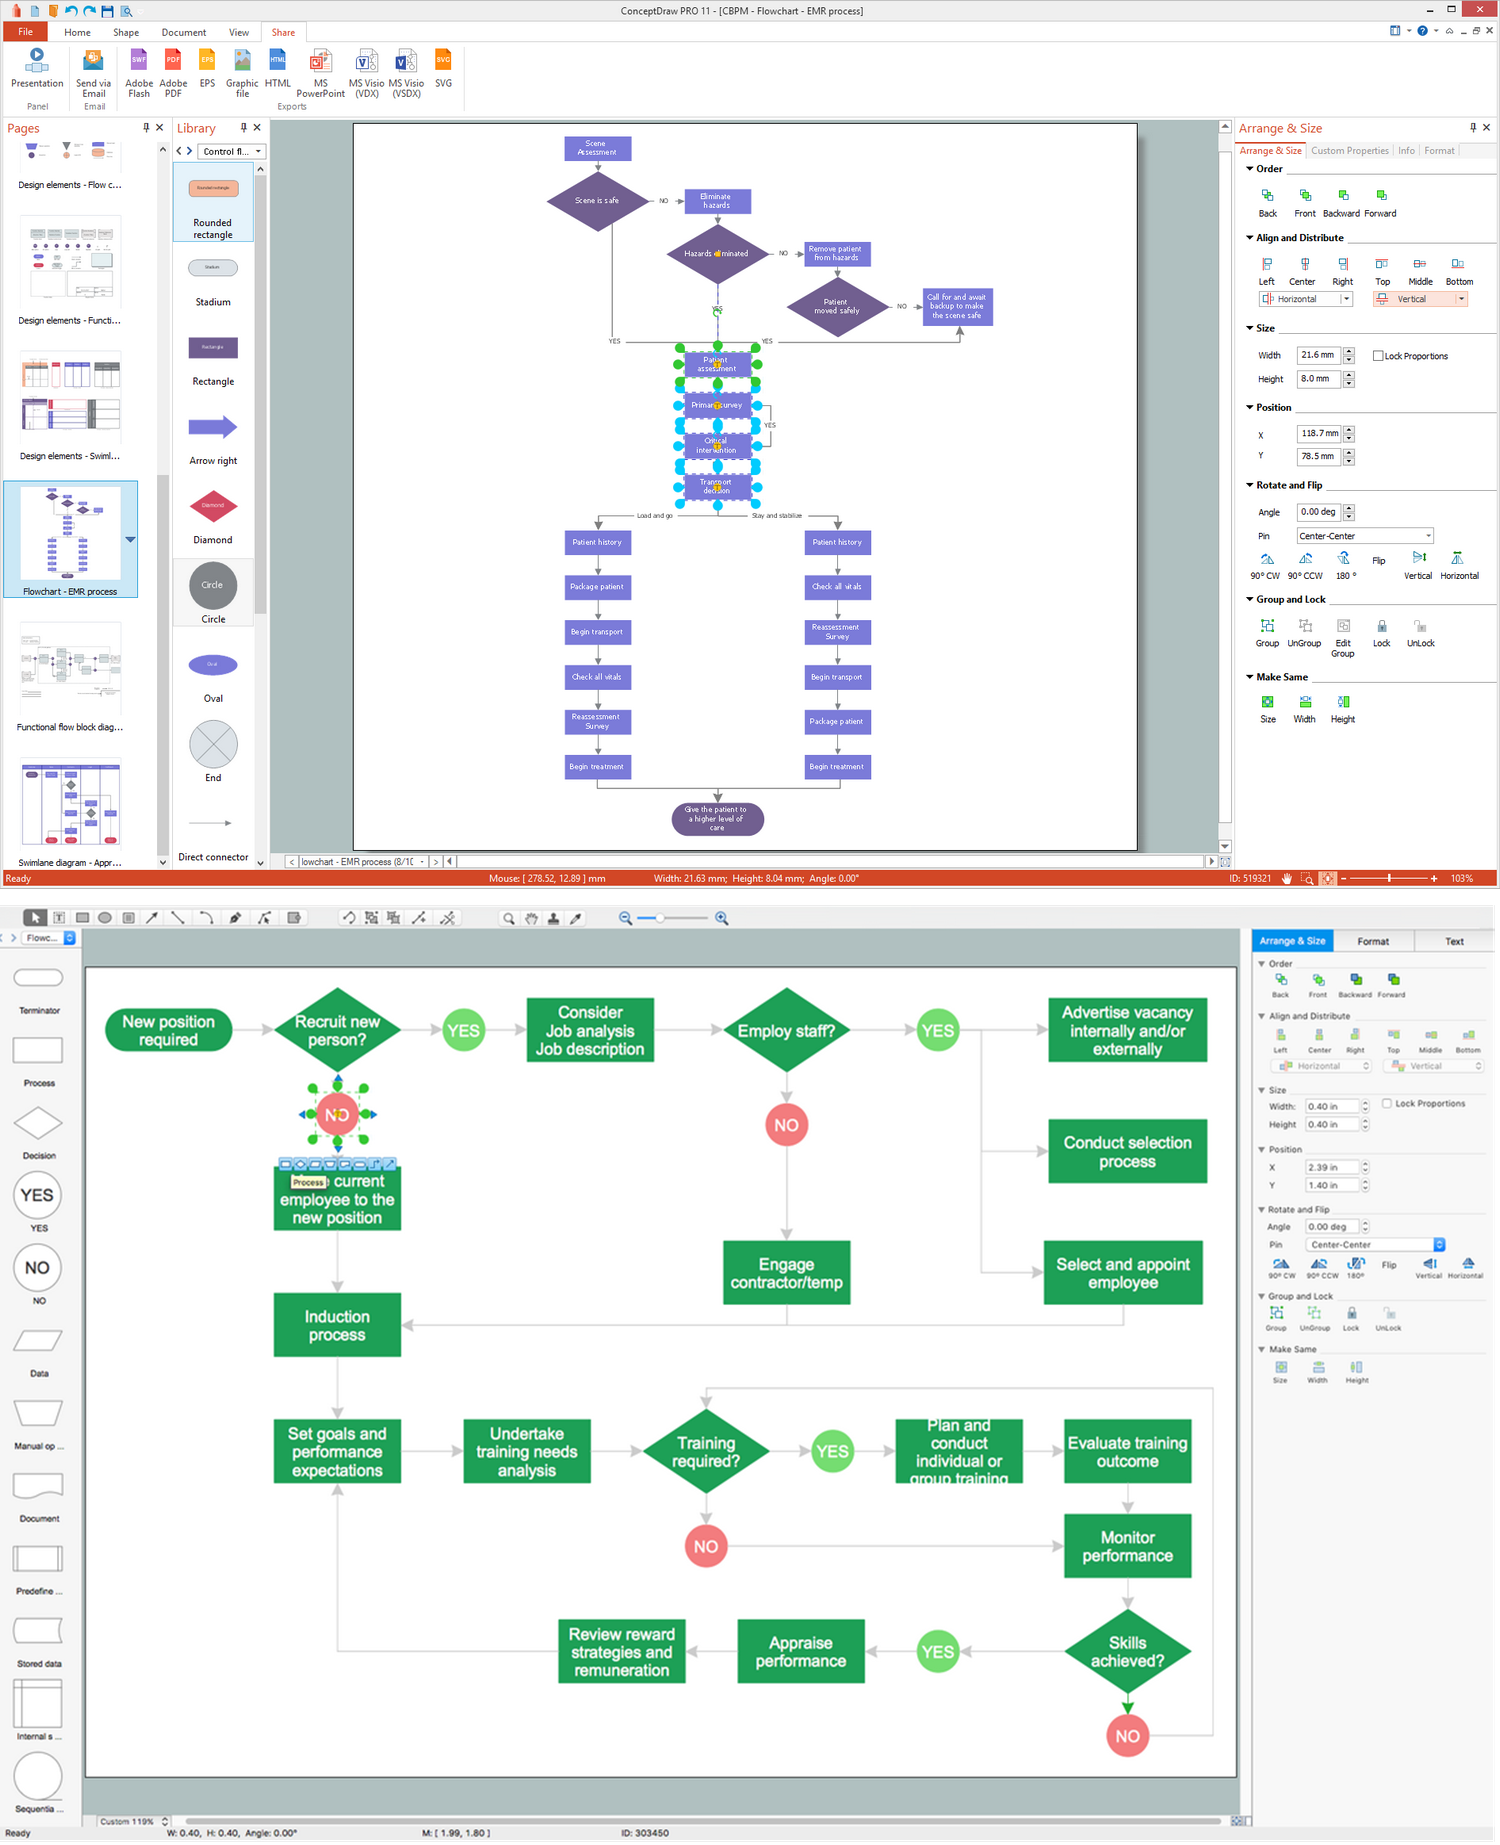
Picture: What Is a Flowchart? Definition, Symbols, Examples and How to Create One
Related Solution:
ConceptDraw DIAGRAM is a professional diagramming and vector drawing software. Now, enhanced with SysML Solution from the Software Development Area of ConceptDraw Solution Park, ConceptDraw DIAGRAM became an ideal software for model based systems engineering (MBSE).
Picture: Model Based Systems Engineering
Related Solution:
Samples, templates and libraries contain vector clip art for drawing the Road Transport Illustrations.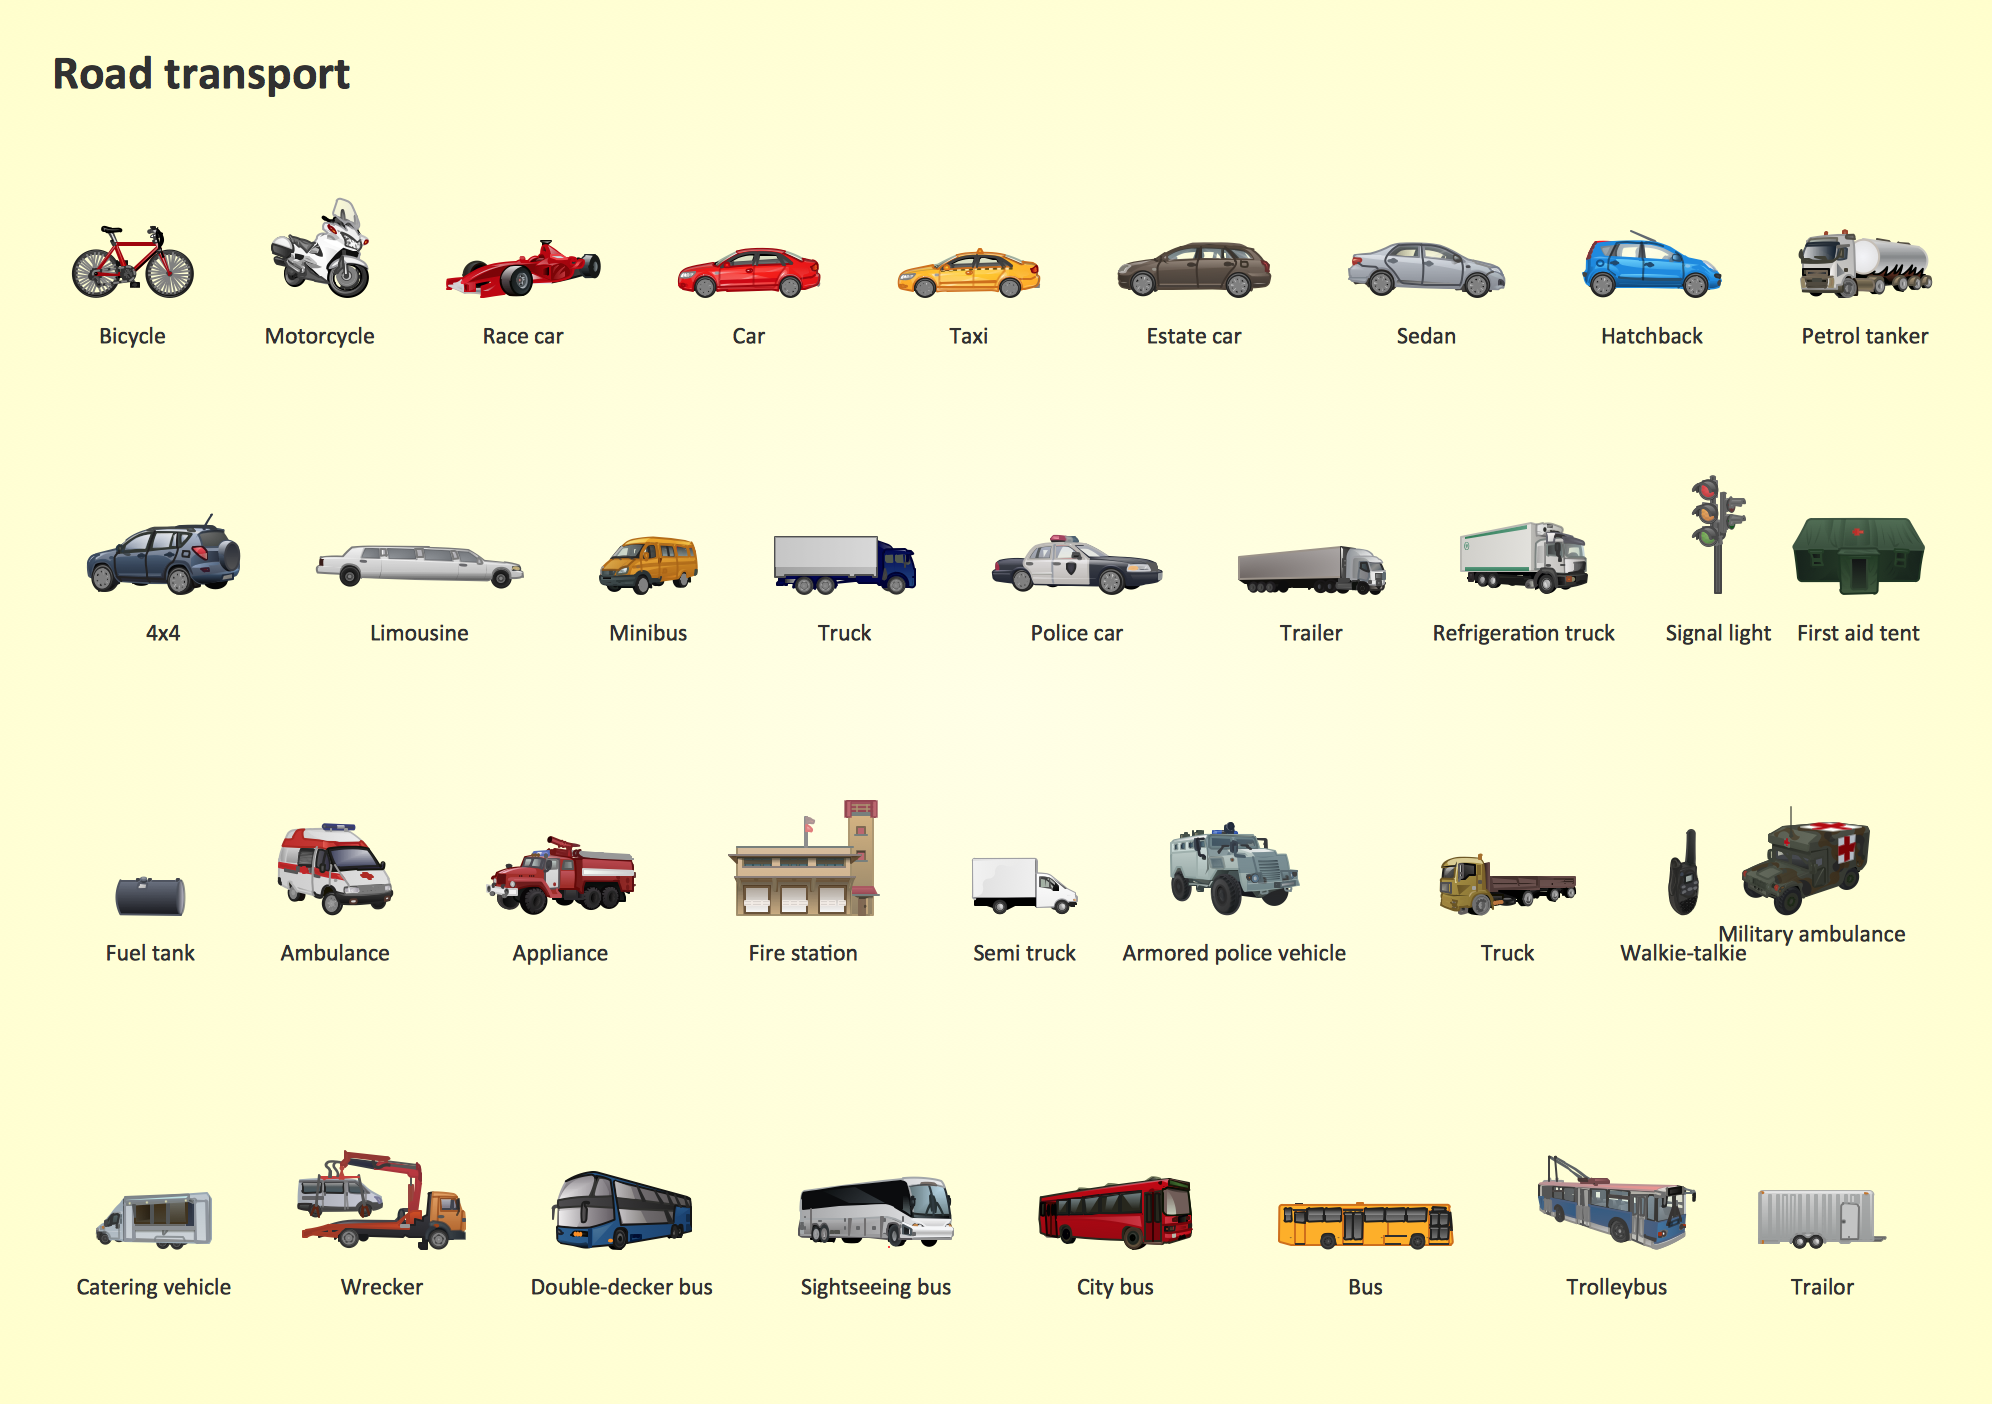
Picture: Road Transport - Design Elements
Related Solution:
This sample shows computer network diagram of the hotel service process, structure of the hotel service departments and the connection of each department to the internet using the WLAN equipment (routers, hub. etc.).
This sample was created in ConceptDraw DIAGRAM diagramming and vector drawing software using the Computer and Networks solution from Computer and Networks area of ConceptDraw Solution Park.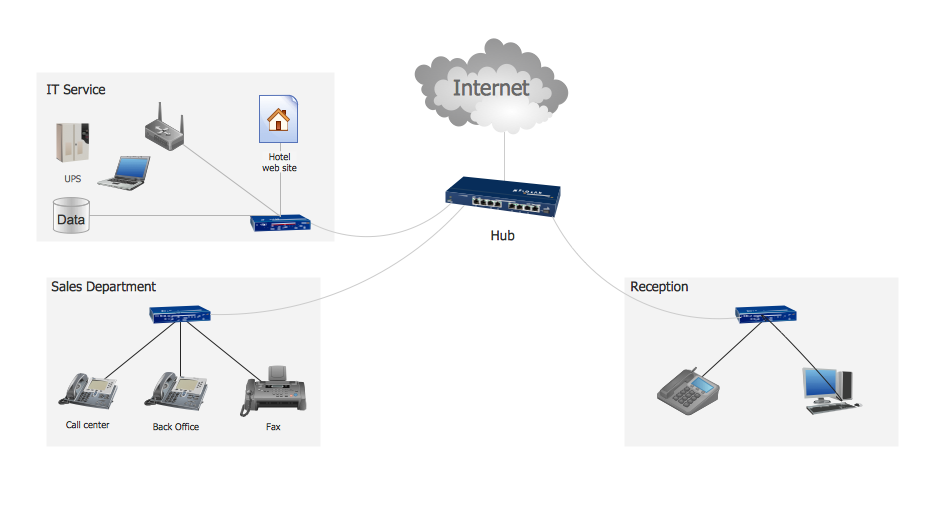
Picture: Hotel Service Process
Related Solution:
In ConceptDraw DIAGRAM it really is sp simple to draw even the most complex cross-functional flowcharts. Use the RapidDraw technology and Cross-Functional libraries in ConceptDraw DIAGRAM for the best results.
Picture: How to Simplify Flow Charting — Cross-functional Flowchart
Related Solution:
This sample was created in ConceptDraw DIAGRAM diagramming and vector drawing software using the Flowcharts solution from the Diagrams area of ConceptDraw Solution Park.
This sample shows the Flowchart that displays the procedures of 2PP (two-party preferred) voting and counting the voters. The two-party-preferred vote is the result of the elections that was distributed to the final two parties.
Picture: Basic Flowchart Images. Flowchart Examples
Related Solution:
The diagrams with highest level in the hierarchy define the main processes or subsystems with external and internal data sources. To detail them, DFD Library is used to build a system of lower level diagrams. This decomposition continues hereinafter it is meaningless.
This data flow diagram of a system of a library management is a context-level DFD. The data flow diagram of this type depicts the large system as a solid process, and does not input any explanation of its content. It is an ordinary practice - creation of a context-level data flow diagram when starting system development. This DFD was made using ConceptDraw solution designed especially for data flow diagrams development. One can find out Data Flow Diagrams Solution in a Solution Park of ConceptDraw and can use in as addition to the common Conceptdraw DIAGRAM diagramming tools.
Picture: DFD Library System
Related Solution:
Use Case Diagram Taxi Service UML. This sample was created in ConceptDraw DIAGRAM diagramming and vector drawing software using the UML Use Case Diagram library of the Rapid UML Solution from the Software Development area of ConceptDraw Solution Park.
This sample shows the work of the taxi service and is used by taxi stations, by airports, in the tourism field and delivery service.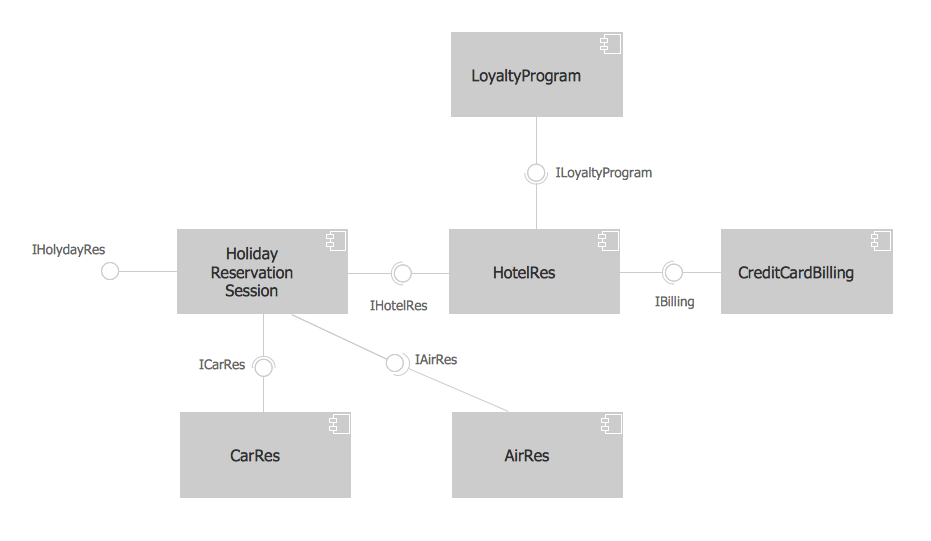
Picture: About UML
Related Solution:
Electrical plan is a document that is developed during the first stage of the building design. This scheme is composed of conventional images or symbols of components that operate by means of electric energy. To simplify the creation of these schemes you can use house electrical plan software, which will not require a long additional training to understand how to use it. You only need to install the necessary software ant it’s libraries and you’ll have one less problem during the building projection.
Any building contains a number of electrical systems, including switches, fixtures, outlets and other lightening equipment. All these should be depicted in a building electrical plans and included to general building documentation. This home electrical plan displays electrical and telecommunication devices placed to a home floor plan. On the plan, each electrical device is referenced with the proper symbol. Electrical symbols are used for universal recognition of the building plan by different persons who will be working on the construction. Not all possible electric symbols used on a certain plan, so the symbols used in the current home plan are included to a legend. The electrical home plan may be added as a separate document to a complete set of building plans.
Picture: How To use House Electrical Plan Software
Related Solution:
ConceptDraw DIAGRAM is a software for producing flow charts. The software delivers built-in object libraries with vector stencils that allows you to use RapidDraw technology. By clicking on direction arrows one can add a new object to flowchart. Users can start drawing their own flowchart diagrams in fast and simple way.
Picture: Diagram Flow Chart
Related Solution:


