Electrical Symbols — Transmission Paths
Data transmission, digital transmission or digital communications is the physical transfer of data (a digital bit stream or a digitized analog signal) over a point-to-point or point-to-multipoint communication channel. Examples of such channels are copper wires, optical fibers, wireless communication channels, storage media and computer buses. The data are represented as an electromagnetic signal, such as an electrical voltage, radiowave, microwave, or infrared signal.

Pic. 1. Transmission Paths Library
ConceptDraw DIAGRAM is a powerful software for creating professional looking electrical diagram quick and easy. For this purpose you can use the Electrical Engineering solution from the "Engineering" area of ConceptDraw Solution Park.
Electrical Engineering Solution for ConceptDraw DIAGRAM provides the stencils libraries of ready-to-use predesigned 926 vector symbols, templates and samples that make your electrical drawing quick, easy and effective.
26 libraries of the Electrical Engineering Solution of ConceptDraw DIAGRAM make your electrical diagramming simple, efficient, and effective. You can simply and quickly drop the ready-to-use objects from libraries into your document to create the electrical diagram.

Pic. 2. Electrical Engineering symbols
Electrical diagram software will assist you in drawing your electrical diagrams with minimal effort and makes it very easy for beginners.
Electrical symbols and smart connectors help present your electrical drawings, electrical schematic, wiring diagrams and blue prints.
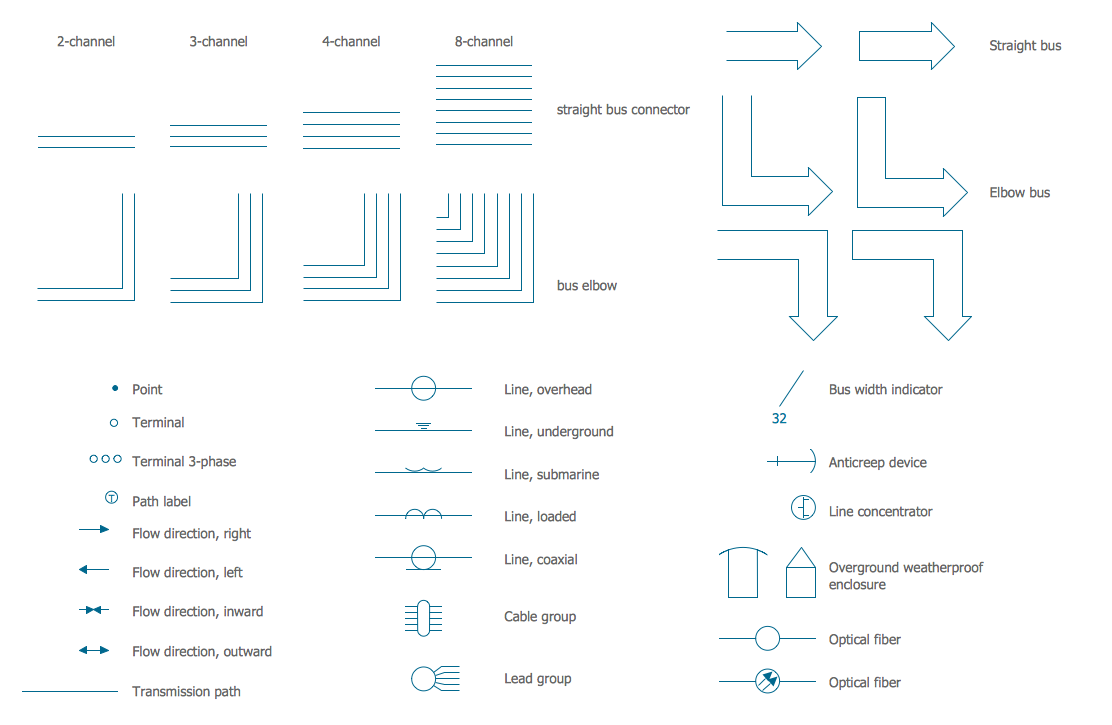
Pic. 3. Electrical Symbols — Transmission Paths
Most of the electrical symbols can be changed in their appearance, styles and colors according to users' requirements. Electrical symbols are used to represent various electrical and electronic devices in a schematic diagram of an electrical or electronic circuit.
The following table lists some transmission paths electrical symbols in our electrical diagram software.
| Symbol |
Meaning |
| Electrical Symbols — Transmission Paths |
 | 2-line bus |
 | 3-line bus |
 | 3-line bus 2 |
 | 4-line bus |
 | 4-line bus 2 |
 | 8-line bus |
 | 8-line bus 2 |
 | 2-line bus elbow |
 | 3-line bus elbow |
 | 3-line bus elbow 2 |
 | 4-line bus elbow |
 | 4-line bus elbow 2 |
 | 8-line bus elbow |
 | 8-line bus elbow 2 |
 | Point |
 | Terminal |
 | Terminal 3-phase |
 | Label |
 | Flow direction, right |
 | Flow direction, left |
 | Flow direction, inward |
 | Flow direction, outward |
 | Transmission path |
 | Line, overhead |
 | Line, underground |
 | Line, submarine |
 | Line, loaded |
 | Line, coaxial |
 | Cable group |
 | Lead group |
 | Anticreep device |
 | Line concentrator |
 | Overground enclosure |
 | Overground enclosure 2 |
 | Optical fiber |
 | Optical fiber 2 |
 | Straight bus |
 | Straight bus 2 |
 | Elbow bus |
 | Elbow bus 2 |
 | Elbow bus 3 |
 | Elbow bus 4 |
 | Bus width |
In communications and electronic engineering, a transmission line is a specialized cable or other structure designed to carry alternating current of radio frequency, that is, currents with a frequency high enough that their wave nature must be taken into account. Transmission lines are used for purposes such as connecting radio transmitters and receivers with their antennas, distributing cable television signals, trunklines routing calls between telephone switching centres, computer network connections and high speed computer data buses.
How to Create an Electrical Diagram Using Transmission Paths Library
TEN RELATED HOW TO's:
If you need to describe some process, diagramming is a perfect tool for almost any imaginable purpose. The set of the most commonly used flow charts symbols is quite wide and includes symbols for operations, processes, data inputs and outputs. You can see the full list of all the symbols used for flowcharting in Flowcharts solution from Diagrams area in ConceptDraw Solution Park.
A flow chart is often used for visual representation of a sequential process flow. The flowchart approach to any process is to divide it into some sequential actions. What makes a flow chart so popular and clear to make out is the set of standard flowchart symbols that has the same reading independently from processes described with their applying. The current drawing represents the vector library containing the pack of standard flowchart symbols. This library is supplied with ConceptDraw Flowcharts solution.
Picture: Flow Chart Symbols
Related Solution:
A Storage area network (SAN) is a dedicated network that provides access to data storage and operations only on the block level. SAN usually has own network of storage devices/elements and disk arrays that are connected with each other and to a remote data-sharing network. SANs are widely used for enhancing the storage devices (optical jukeboxes, disk arrays, tape libraries) that are accessible for networked servers.
This example was created in ConceptDraw DIAGRAM using the Computer and Networks Area of ConceptDraw Solution Park. It shows the hybrid of Storage area network (SAN) and Network Attached Storage (NAS) technologies.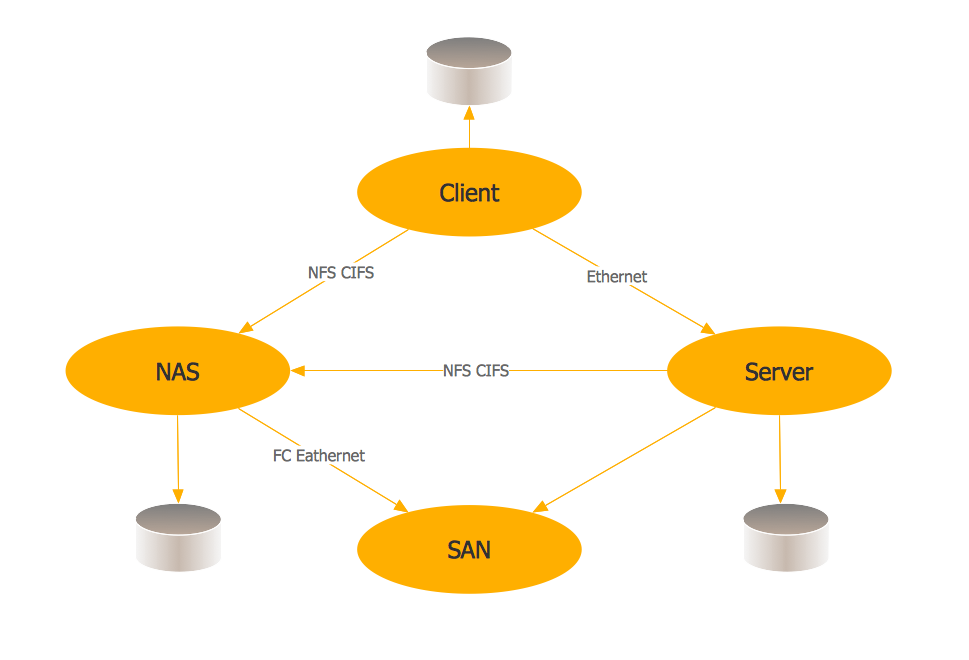
Picture: Storage area networks (SAN). Computer and Network Examples
Related Solution:
This sample shows the OMT method. It was created in ConceptDraw DIAGRAM diagramming and vector drawing software using the Rapid UML Solution from the Software Development area of ConceptDraw Solution Park.
All diagrams produced with ConceptDraw DIAGRAM are vector graphic documents and are available for reviewing, modifying, and converting to a variety of formats (image, HTML, PDF file, MS PowerPoint Presentation, Adobe Flash or MS Visio XML).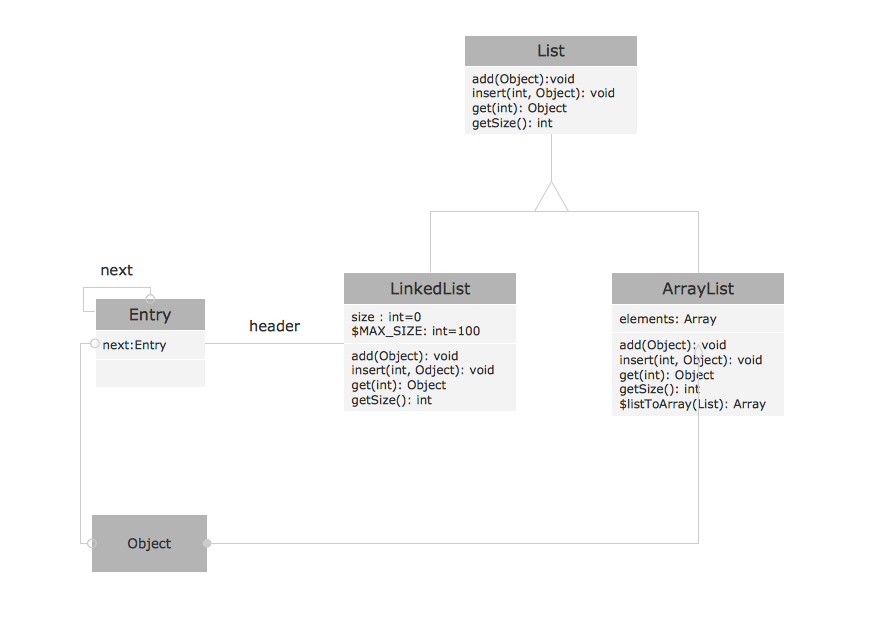
Picture: OMT Method
Related Solution:
A Wireless network is a type of the computer network that uses the wireless connections for connecting network nodes for data transfer. The wireless networks are very useful, inexpensive, popular and widely used. They are easy setup and do not require the cables installation.
Using the solutions of the Computer and Networks Area for ConceptDraw DIAGRAM you can design the wireless network diagrams of any complexity quick and easy.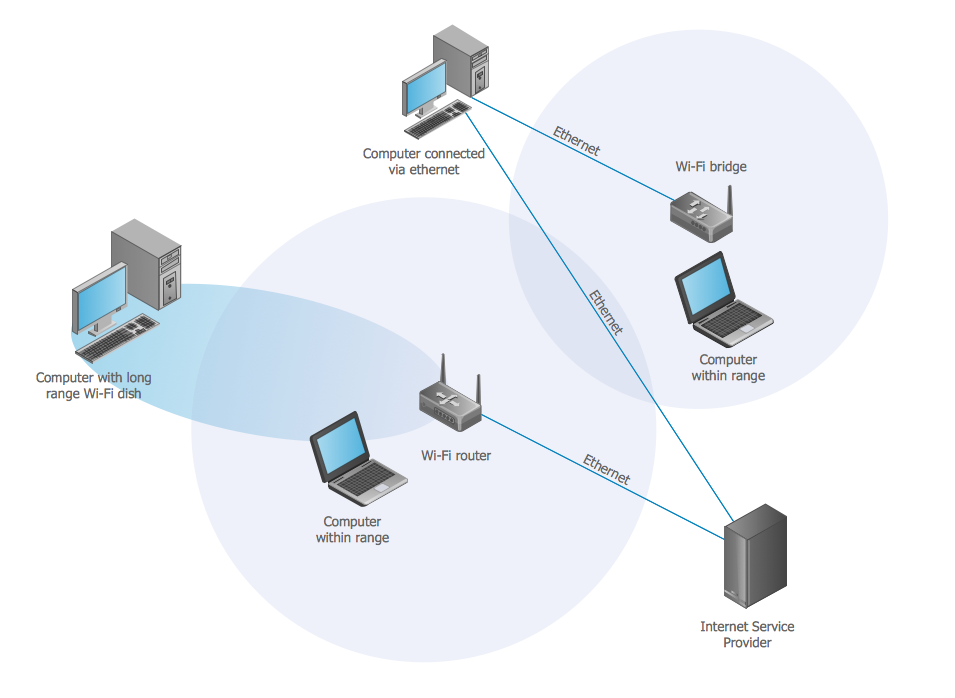
Picture: Wireless network. Computer and Network Examples
Related Solution:
Drawing the network diagrams is a complex process which requires a lot of efforts, time and artistic abilities. ConceptDraw DIAGRAM offers the Network Layout Floor Plans Solution from the Computer and Networks Area with variety of predesigned network components for drawing network layout floor plans in minutes.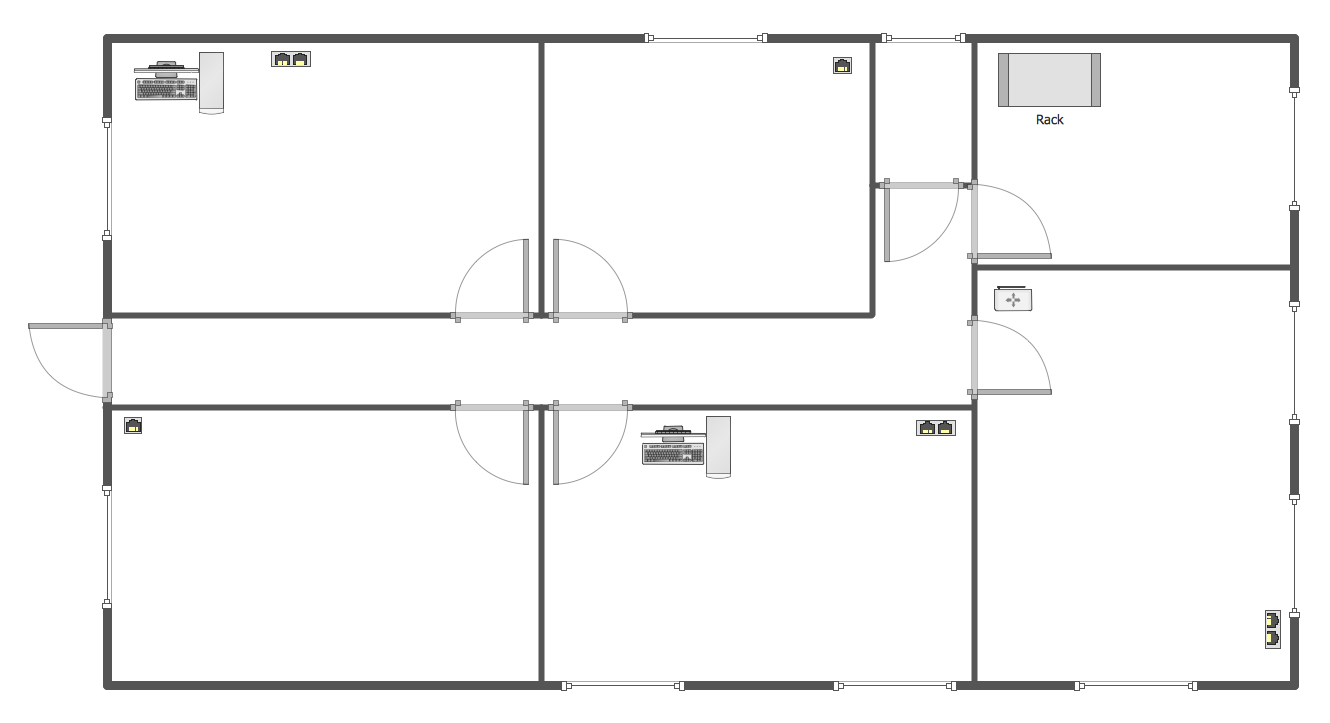
Picture: Network Components
Related Solution:
Japan is an island nation in East Asia. Located in the Pacific Ocean, it lies to the east of the Sea of Japan, China, North Korea, South Korea and Russia, stretching from the Sea of Okhotsk in the north to the East China Sea and Taiwan in the south.
The vector stencils library Japan contains contours for ConceptDraw DIAGRAM diagramming and vector drawing software. This library is contained in the Continent Maps solution from Maps area of ConceptDraw Solution Park.
Picture: Geo Map - Asia - Japan
Related Solution:
A flowchart is a simple but very functional tool when it comes to understanding a workflow or to removing unnecessary stages from a process. When drawing flowcharts, keep in mind that there are four common types of flowcharts, like document flowcharts and data flowcharts that show control over a data or document flow over a system. To show controls on a physical level, use system flowcharts. In addition, to show controls in a program, you can draw a program flowchart.
This flowchart diagram represents the piece of an article editing process, that involves the author and editor. It was created using the Basic Flowchart notation that consists from the basic flowchart symbols. The start and the end of the process are indicated with "Terminator" symbols. The "Process" symbols show the action steps consisting from making edits and searching for a compromise, when the author does not agree with the suggestions of the editor. The "Process" symbol is the general symbol in process flowcharts. The "Decision" symbol indicates a branching in the process flow. There are two branches indicated by a Decision shape in the current flowchart (Yes/No, Disagree/Agree). This basic flowchart can be used as a repeating unit in the workflow diagram describing the working process of some editorial office.
Picture: Types of Flowcharts
Related Solution:
Every corporate network is unique, though there are guidelines and best practices in developing networks. As it is quite difficult to implement a pure topology within a company, using a hybrid network topology is considered a better solution. As a rule, such network assembles advantages and features of source topologies.
This diagram is an example of the Hybrid network. This type of network topology means a conjunction of other network topologies. Such as star-bus, ring-mesh topologies, etc. It should be obviously diverse networks. The final computer network inherits both advantages and disadvantages of its ingredients. Using the ConceptDraw Computer and Networks solution including vector graphic libraries and templates one can develop professional custom network diagrams of any topology and complexity.
Picture: Hybrid Network Topology
Related Solution:
The Ring Network Topology Diagram examples was created using ConceptDraw DIAGRAM software with Computer and Networks solution.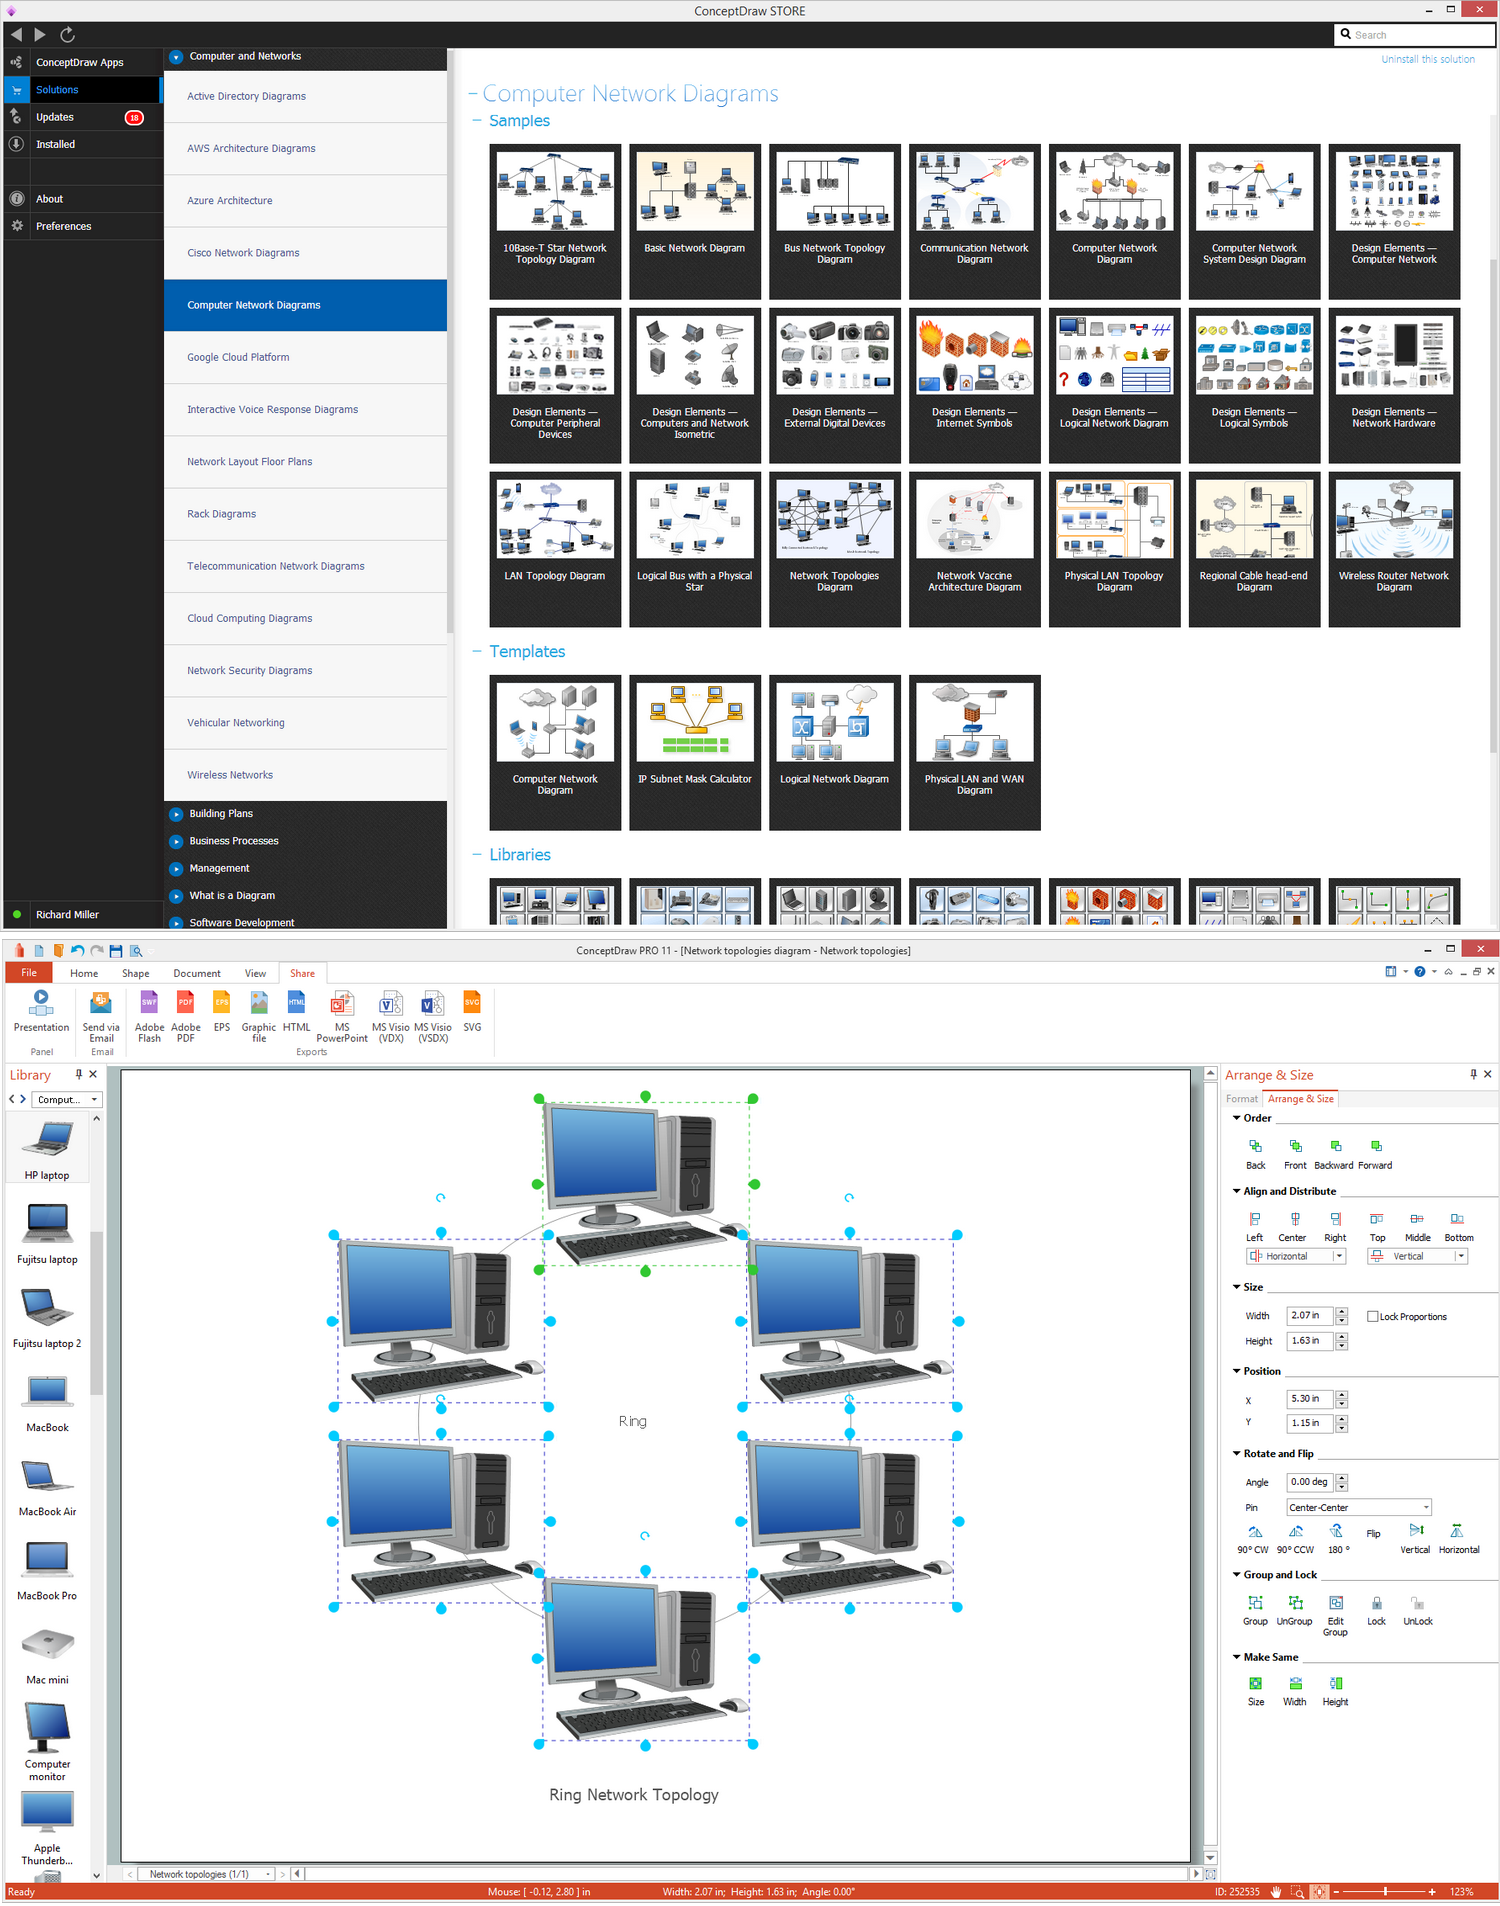
Picture: Ring Network Topology
Related Solution:
UML Component Diagram illustrates show components are wired together to larger components and software systems that shows the structure of arbitrarily complex systems.
Rapid UML Solution for ConceptDraw DIAGRAM contains 13 vector stencils libraries with 393 interactive shapes that you can use to design your UML diagrams.
To design a Component Diagram use the UML Component Diagram library.
UML Component Diagram library contains 36 shapes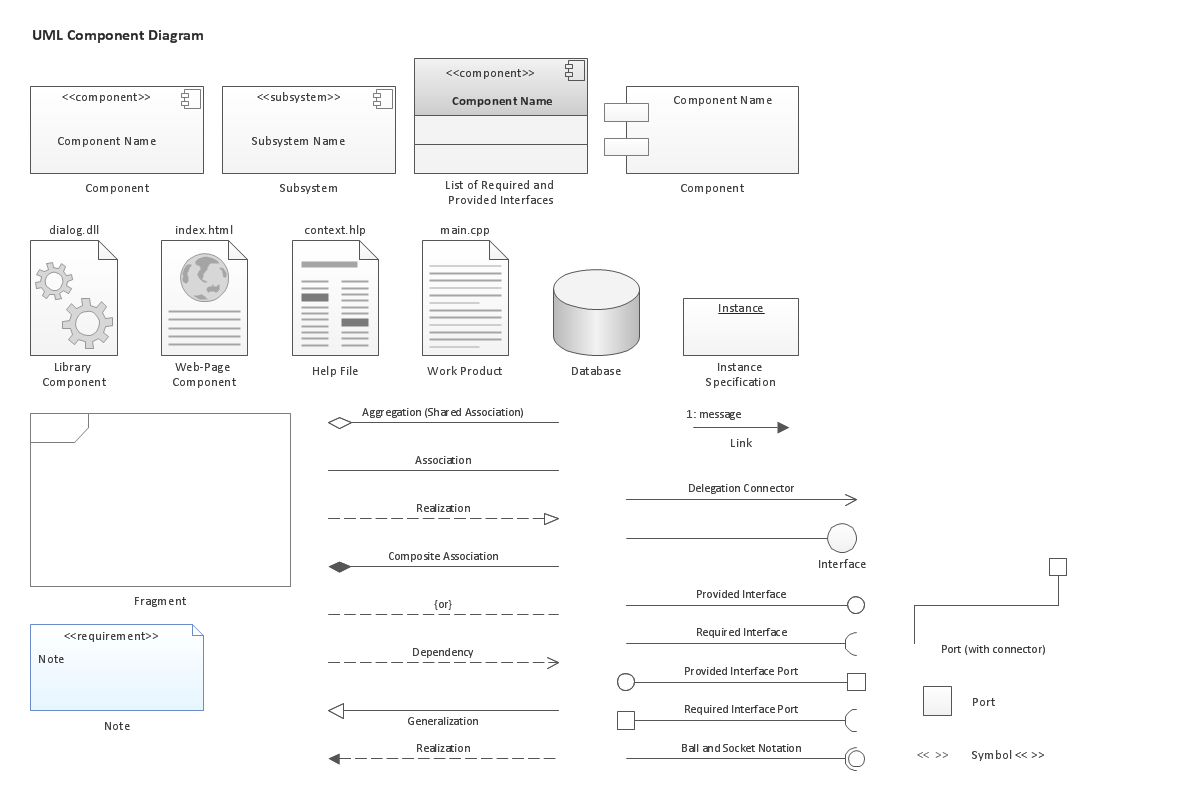
Picture: UML Component Diagram. Design Elements
Related Solution:


 button in the upper right corner of the object.

 . To connect elements using this tool, drag the connector from one connect dot to another.You can use Layers to place connections on different layers.

