Star Network Topology
Star Network Topology Diagram
Star networks are well known for their nodes being located in a shape of a star. There are one of the most commonly used computer network topologies – star network topologies. The way such networks look reminds of a star as there is a central node which is illustrated in the very middle of the network schematics and from this central hub there are other nodes all around this hub connected to it. The central hub is there to transmit the messages to the other nodes and it is the server itself when the peripheral nodes are the clients.
Having such hub as well as the leaf nodes which are connected to it all together with the transmission lines between all of them, you can illustrate all that in a way of a network topology which will be called the start network topology diagram. In this diagram of a star form everyone can clearly see both the central hub, the nodes and the lines which connect these nodes to the middle where the hub is. The data is meant to be going through the hub, or the switch (also known as concentrator), before it can finish its way until it gets to its destination.
The main function of the hub is to control and message all of the functions of the network. It can also be in charge for repeating the data flow. Such configuration can be made with use of the twisted pair cable as well as the optical fibre cable. A coaxial cable can also be used.
The reason of using the star topology is to reduce the impact of a failure for a line in a way of connecting all existing systems to one central node or hub. All of the peripheral, but central, nodes can be connected with each other only through the very central node which is the hub in the middle of the star topology drawing. They all transmit and receive data only in a way of using the central node, there is no other way of their communication.
In case there is a failure of a transmission line which links any of the peripheral nodes to the very central node, it will lead to a result of the isolation of that peripheral node from all other nodes. In this case all of the rest of the systems will not be affected.
If you work in IT or you, for some reason, want to illustrate the way star network topology looks like and you want to make this drawing look truly professional, then you might spend long hours trying to create it yourself. Although, there exists another option. If you find the right software to be able to use it in order to create such great looking, smart, professional star network topology diagram, then it can be much simpler to finish with your drawing and so quicker.
We always recommend to use only the best software possible which is ConceptDraw DIAGRAM This software is a very special one and only the reason it was developed by the IT specialists from CS Odessa with experience in drawing charts, flowcharts, diagrams and schemes makes it so special. This application allows ConceptDraw DIAGRAM users to choose any of the available solutions full of stencil libraries with proper design elements as well as pre-made examples and templates of so many graphs, charts, plans, schemes, flowcharts and diagrams created by the team of CS Odessa IT specialists.
Having all of the options to use, including different solutions where you can always find the necessary tools, such as the design elements to use for your own great looking drawings or the existing examples as well as templates and layouts of the previously made drawings which you can always use as drafts for your own drawings, is always very beneficial.
In case you decide to get one of the solutions after downloading ConceptDraw DIAGRAM you can always download them either rom the ConceptDraw STORE (which is another product of CS Odessa), or this site. Each of the solutions provide at least one library with the stencils that can be used for making so many different charts, plans, schemes, flowcharts and diagrams, including the star network topology ones.
Having them means having pretty much everything you need to make it happen – to make a smart looking star network topology diagram from a scratch using Computer and Networks solution from Computer and Networks area of ConceptDraw Solution Park which provides examples, templates and vector stencils library with symbols of local area network (LAN) and wireless LAN (WLAN) equipment.
You can always use it to draw the physical and logical network topology diagrams for wired and wireless computer communication networks, including the extended star and the distributed star.
Extended star is a type of network topology, where a network, based upon the physical star topology, has one or more repeaters between the central node which also can be called the “hub” of the “star”. In this network topology the peripheral or so called “spoke” nodes, the repeaters, are being used for extending the maximum transmission distance of the point-to-point links between the central node and the peripheral nodes. In case these repeaters are replaced with hubs or switches, then so called hybrid network topology is created.
Distributed Star is a commonly used type of network topology that has individual networks based on the physical star topology and connected in a linear fashion with no central or top level connection point.

Pic. 1. Star Network Topology
But no matter which of this types of the computer network topology diagrams you want to create, you can always do it within only a couple of hours or even minutes, depending on your general experience of using ConceptDraw DIAGRAM software. Download it today in case you still do not have this unique and very convenient application and use it for making your own diagrams, great looking plans, schemes, charts and flowcharts.

Pic. 2. Star Network Topology Diagram
Once you try and succeed in creating something special and professionally looking, then we doubt that you will stop using this unique software, but will recommend to those who do not have it yet and so somebody else will have a change to get this application and so simplify their work with drawing the schemes, charts, plans, diagrams and flowcharts.
See Also Network Topologies:
- Bus Network Topology
- Ring Network Topology
- Mesh Network Topology
- Tree Network Topology
- Fully Connected Network Topology
TEN RELATED HOW TO's:Planning a computer network can be a challenge for a junior specialist. However, knowing how to draw a computer network diagrams isn’t a rocket science anymore. There are a lot of special software for creating such diagrams with predesigned templates and examples. The core for Network Fault Tolerance System presented here, is the equipment of Cisco. You can see here the certified Cisco equipment icons. Generally, ConceptDraw DIAGRAM libraries contain more than half of a thousand objects representing the standardized images of Cisco equipment. ConceptDraw solution for network diagramming is a great network diagramming tool for any level skills - from students to network guru.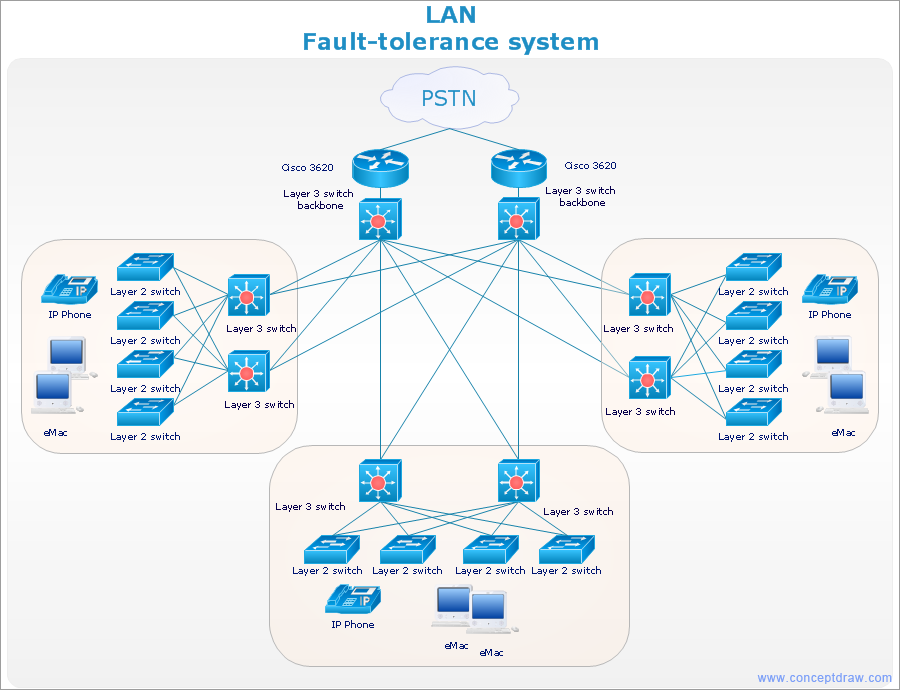 Picture: How to Draw a Computer Network DiagramsRelated Solution:The VMware vNetwork Distributed Switch (vDS) is the new virtual switch (vSwitch) with vSphere 4 that extends the set of features of the VMware vNetwork Standard Switch (vSS). The VMware vSS is the base-level virtual networking alternative that extends the capabilities, configuration and appearance of the standard vSwitch in VMware ESX 3.5 to ESX 4.0 and vSphere 4. This example was created in ConceptDraw DIAGRAM using the Computer and Networks Area of ConceptDraw Solution Park and shows the VMware vDS network diagram.
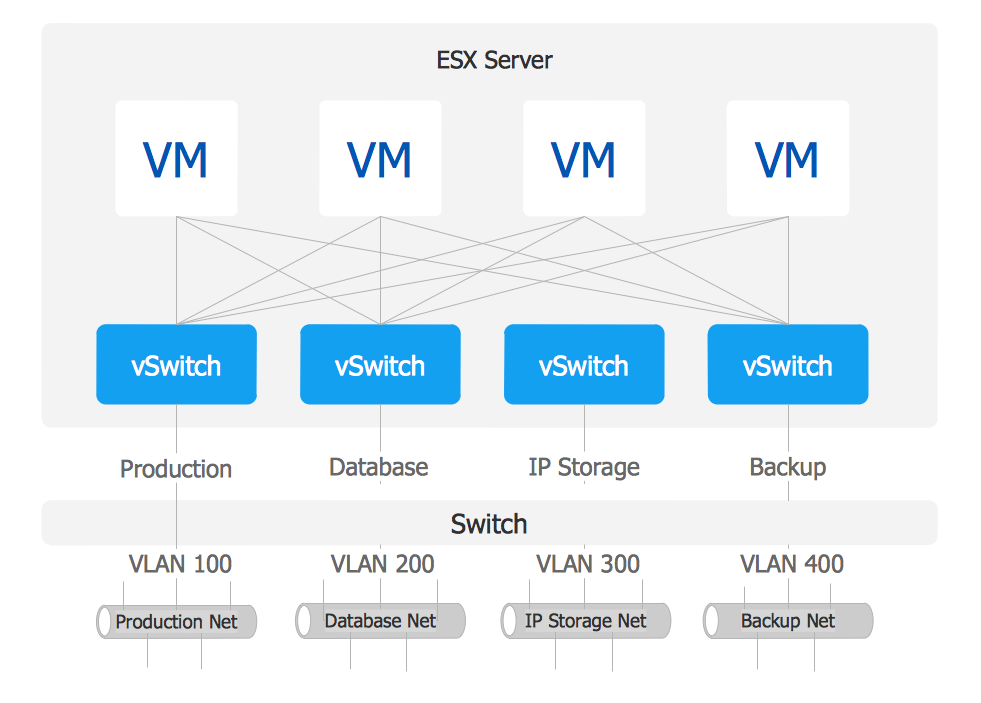 Picture: VMware vNetwork Distributied Switch (vDS). Computer and Network ExamplesRelated Solution:Wireless network topology — logical topology. Wireless network topology shows how the computers connect each other when there is no physical connection. The computers communicate each using the wireless devices.
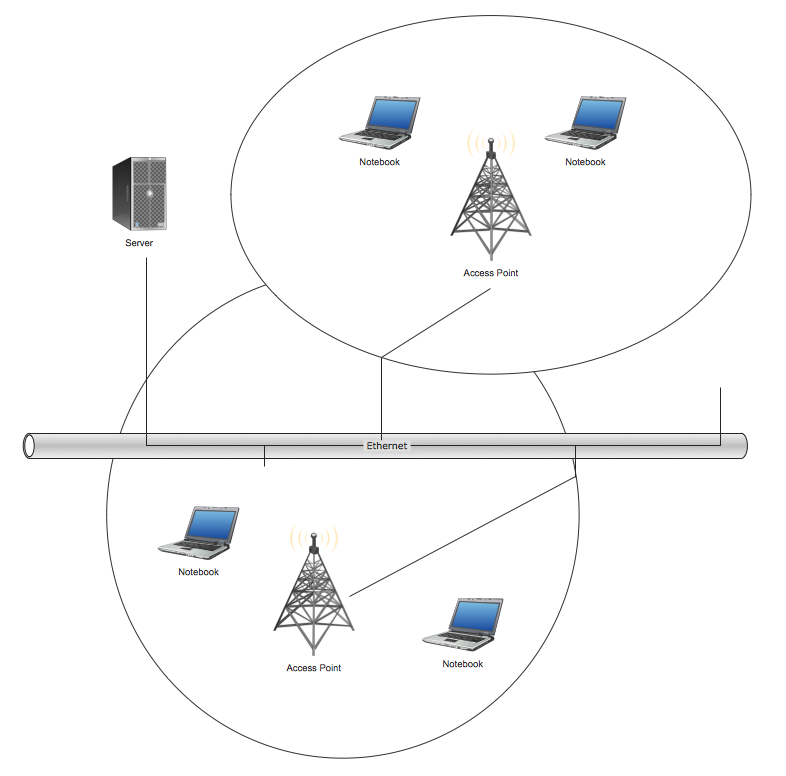 Picture: Wireless Network TopologyRelated Solution:Activity Network Diagram - This sample was created in ConceptDraw DIAGRAM diagramming and vector drawing software using the Seven Management and Planning Tools solution from the Management area of ConceptDraw Solution Park. This sample shows the PERT (Program Evaluation Review Technique) chart of the request on proposal. A request for proposal (RFP) is a request of the company or the organization to potential suppliers to submit the business proposals for service or goods that it is interested to purchase. The RFP is represented on the initial procurement stage and allows to define the risks and benefits.
 Picture: Activity Network Diagram MethodRelated Solution:Of course it is possible to keep network records in text documents, but it is very difficult to use them later. A more sound way to keep such documentation is to create a network diagram that might represent either logical network structure or physical. These diagrams are easy to understand and you will thank yourself later. There is a physical network diagram. It is a tool to represent, maintain and analysis of network equipment and interconnections. Network diagram depicts the actual network information in the attractive clear graphic form. One can learn here the LAN cable length, telecommunication type and carrying capacity. The diagram depicts servers, IP address and domain name as well. Also it shows location of hubs, switches, modems, routers, and other network equipment. The sets of special symbols and images delivered with ConceptDraw Network Diagrams solution are used to show network components. Symbols have a standard view. Therefore, various specialists can read the network diagram without any discrepancies.
 Picture: Network diagrams with ConceptDraw DIAGRAMRelated Solution:The most easier way of creating the visually engaging and informative Sales Process Flowchart is to create the new ConceptDraw document and to use the predesigned vector symbols offered in 6 libraries of the Sales Flowchart Solution. There are more than six types of sales process flow diagrams, ConceptDraw DIAGRAM software is flowchart maker which include six collections of extended flowchart symbols for effective diagramming. There are main collections of color coded flowchart symbols: Sales Department, Sales Steps, Sales Workflow, Sales Symbols and special set of Sales Arrows and Sales Flowchart.
 Picture: Sales Process Flowchart SymbolsRelated Solution:The Building Plans are very useful and even necessary for architects, builders, designers and simple for those who want to build the home, office, flat or anyone other building. They are also convenient for those who want to design or redesign the home, flat, room, etc.
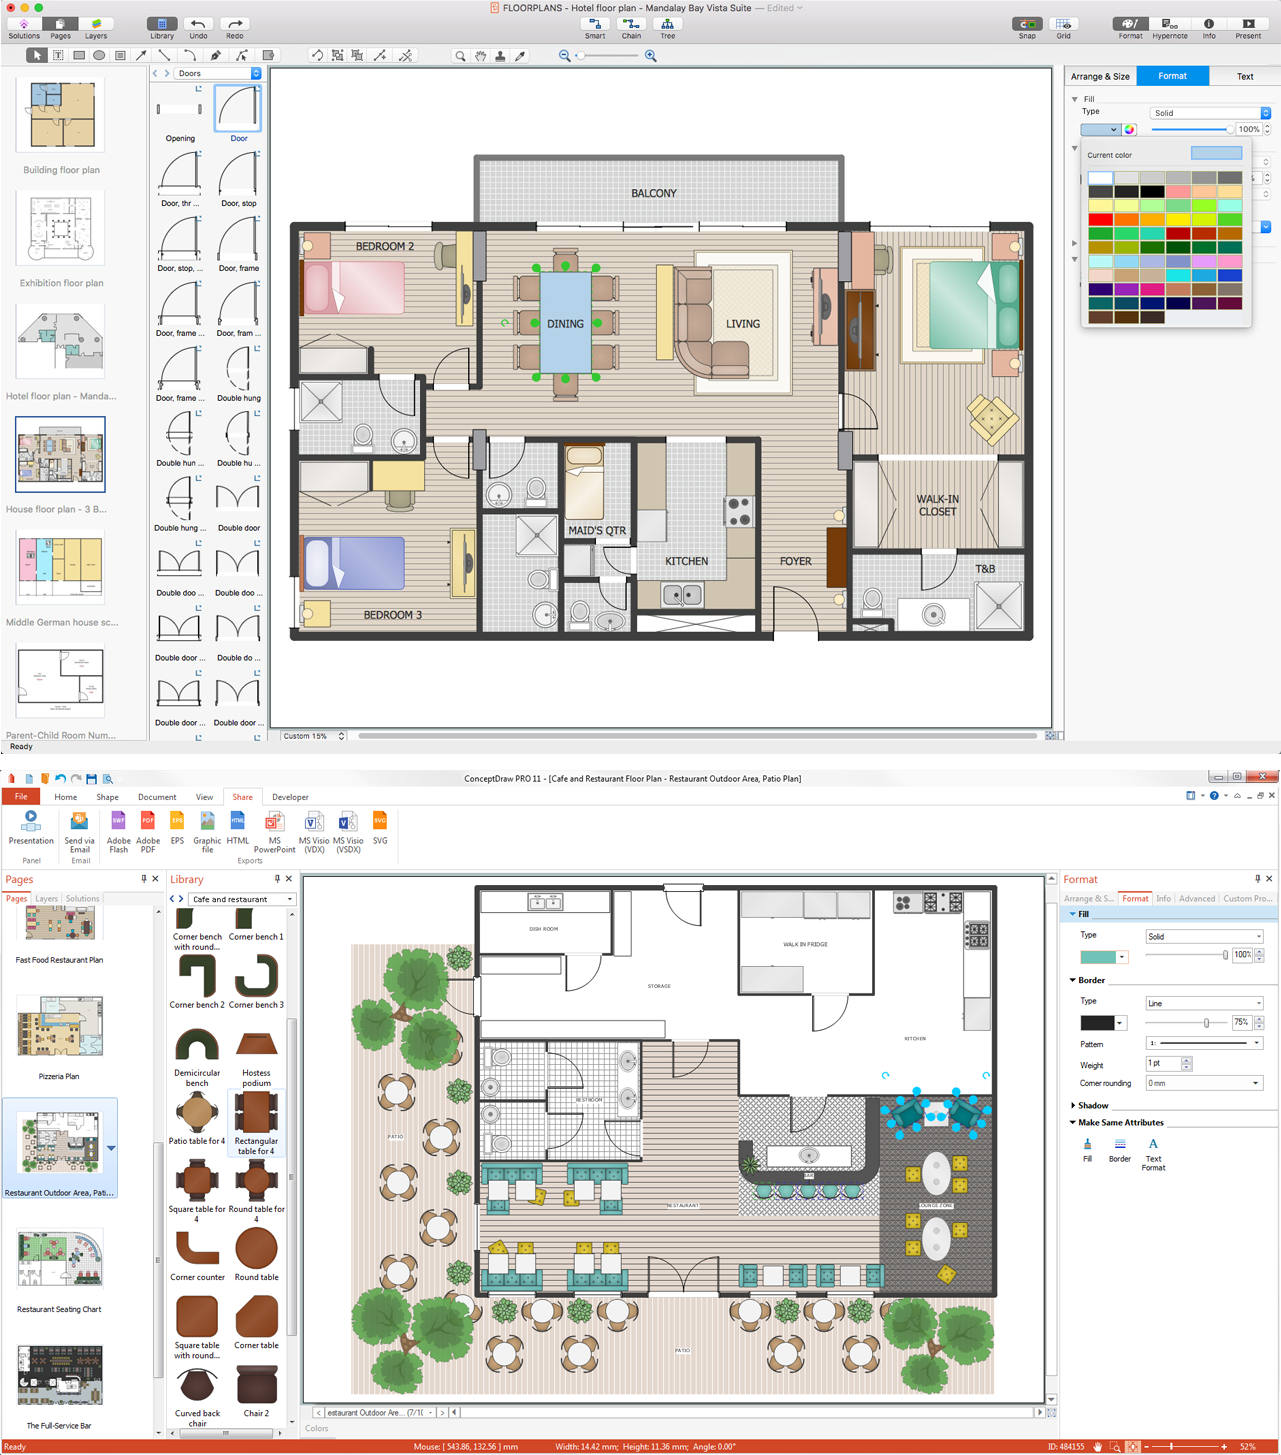 Picture: Building Plan Software. Building Plan ExamplesRelated Solution:Still concerned about fire safety in your establishment? Be sure that all the necessary elements like registers, drills and diffusers are present on your plan. Otherwise, you have to put them on it immediately. Here you can see the Registers, Drills and Diffusers library that contains vector graphical objects depicting various, drills, diffusers and registers that are used in HVAC systems and reflected ceilings. ConceptDraw had solutions designed to support both. You can use it to create effortlessly Reflected Ceiling plans, HVAC plans and other interior design and building plans related issues. ConceptDraw DIAGRAM provides a complete set of tools for creating graphical documents in compliance with all requirements of modern design of technical documentation.
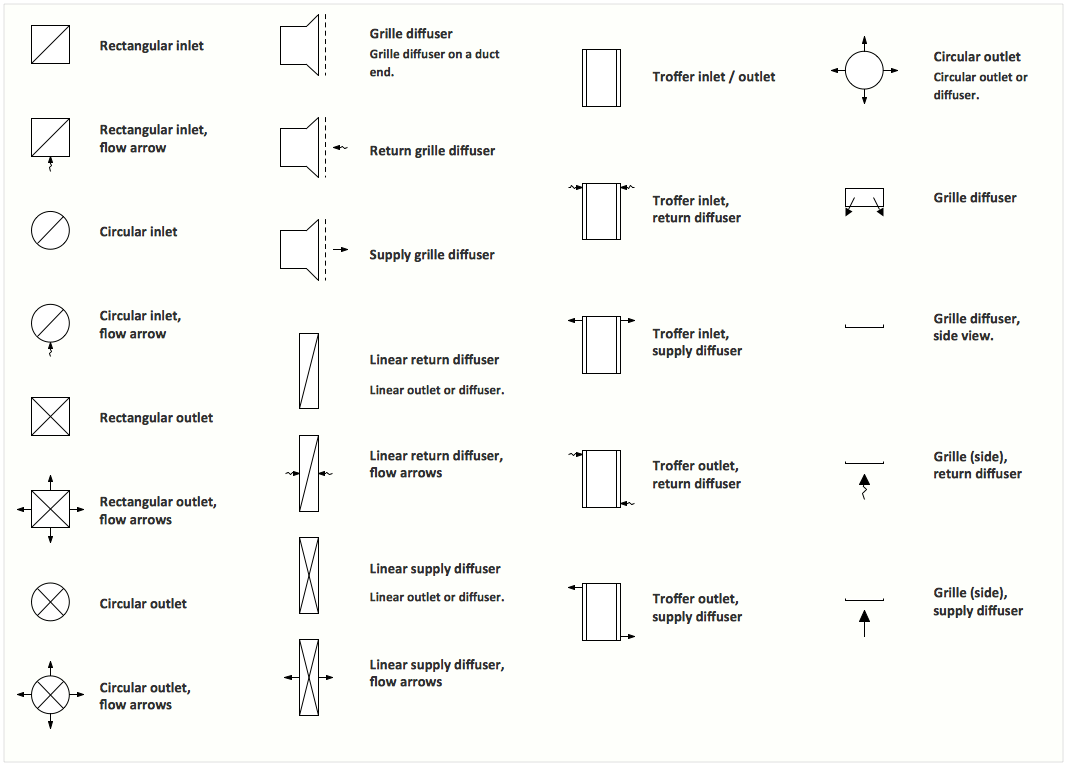 Picture: Interior Design. Registers, Drills and Diffusers — Design ElementsRelated Solution:Variable delay elements are often used to manipulate the rising or falling edges of the clock or any other signal in integrated circuits. Delay elements are also used in delay locked loops and in defining a time reference for the movement of data within those systems. 26 libraries of the Electrical Engineering Solution of ConceptDraw DIAGRAM make your electrical diagramming simple, efficient, and effective. You can simply and quickly drop the ready-to-use objects from libraries into your document to create the electrical diagram.
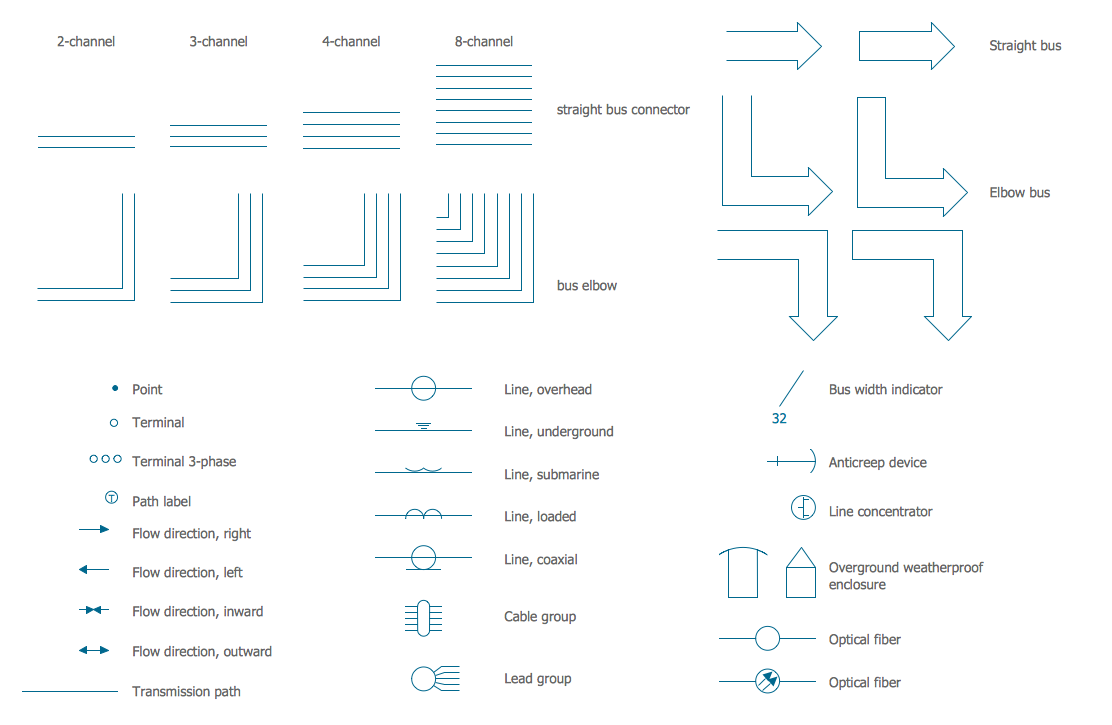 Picture: Electrical Symbols — Transmission PathsRelated Solution:When studying computer science, it is important to have good training manuals. To understand how the networks and data links work, you will probably need a set of network diagram examples depicting all the possible interconnections between network devices. You can find them on Internet or try to create your own. This example of a network topology diagram was made using ConceptDraw Computer and Network Diagrams solution. It represents a bus topology network diagram. A bus topology means that computers and peripherals in the network are connected to a mutual cable (backbone). This topology is often used for small networks. This diagram was designed using vector libraries of network equipment symbols. They also can be applied while creating various LAN and WAN diagrams.
 Picture: Network Diagram ExamplesConceptDrawDIAGRAM 18