The Action Plan
Management and Planning
ConceptDraw OFFICE suite is a software for decision making and action plan. The Seven Management and Planning Tools is a set for such diagrams: Affinity Diagram, Relations Diagram, Prioritization Matrix, Root Cause Analysis Tree Diagram, Involvement Matrix, PERT Chart, Risk Diagram (PDPC).
For the action planning define people and groups involvement in corrective actions by roles, identify logical sequences of scheduled actions and critical path of problem solving, identify possible risks of action plan and propose preventive actions.

Pic.1 Action Plan. Involvement matrix — Distribution of Responsibility
The Involvement Matrix defines the level of involvement and nature of participation. The diagram shows the degree of involvement for all identified parties in the execution of corrective actions.
See also:
TEN RELATED HOW TO's:
Create your own Linux audit flowcharts using the ConceptDraw DIAGRAM diagramming and vector drawing software extended with the Audit Flowcharts solution from the Finance and Accounting area of ConceptDraw Solution Park.
This flowchart example describing auditd, the linux audit tool.
Picture: Linux Audit Flowchart Example. Flowchart Examples
Related Solution:
Flowcharts are used to represent accounting information in a system. In ConceptDraw software there are special symbols that are used to create accounting flowcharts.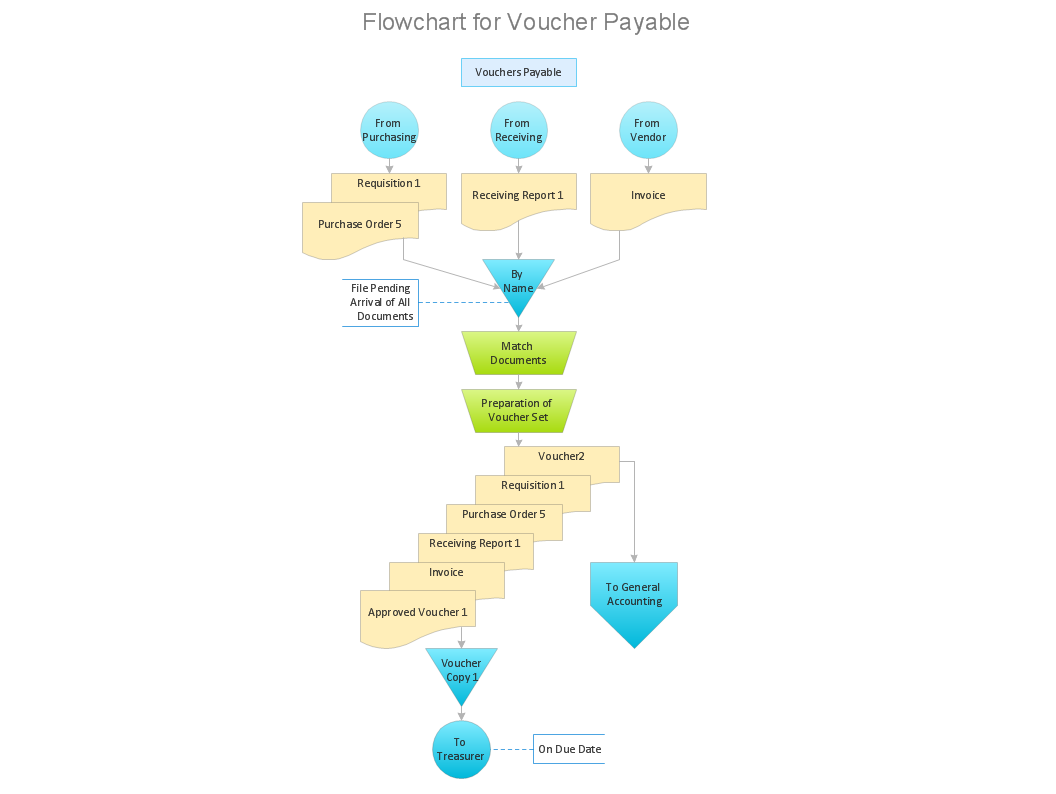
Picture: Why Flowchart is Important to Accounting Information System?
Related Solution:
Use Case Diagrams technology. Using visual graphical objects IDEF1 standard allows to model information interrelations.
Picture: IDEF1 standard
Auditing Process, Audit Planning Process - The audit is complex process of independent examination of data, statements, operations, financial performances of an enterprise for a stated purpose. The auditing process consists of defined quantity of audit steps. Planning is fundamental stage of auditing process. The carefully thought-out audit planning process ensures the success of the business project.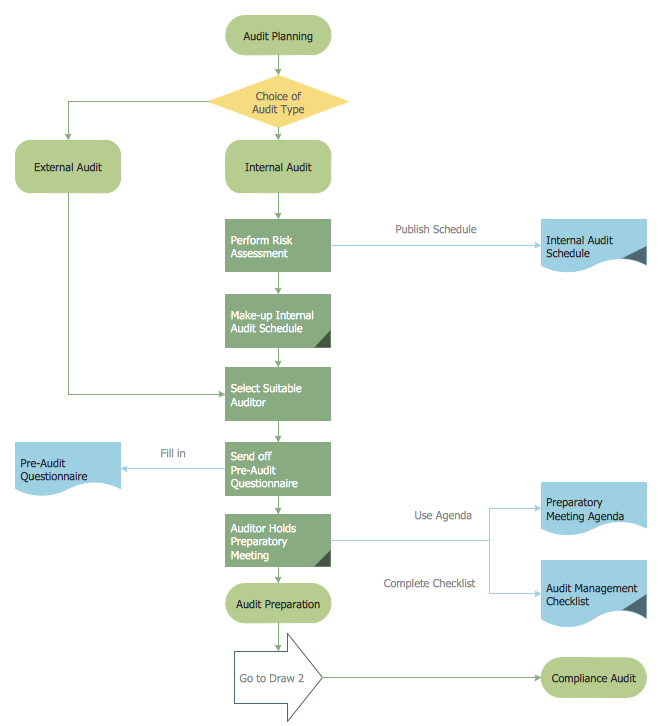
Picture: Auditing Process. Audit Planning Process
Related Solution:
Action Plan - For the action planning define people and groups involvement in corrective actions by roles, identify logical sequences of scheduled actions and critical path of problem solving, identify possible risks of action plan and propose preventive actions.
ConceptDraw Office suite is a software for decision making and action plan.Picture: The Action Plan
Drawing of Family Emergency Plan is quite complex process. How can you make it? Usually you draw it accurately on the sheet of paper and this process takes much time. ConceptDraw DIAGRAM diagramming and vector drawing software offers you Fire and Emergency Plans Solution - the new method of quickly drawing Family Emergency Plan of any complexity.
Picture: Family Emergency Plan
Related Solution:
Identify and Structure Factors. Use the Affinity Diagram to collect and structure factors that impact on a problem.
ConceptDraw OFFICE suite is a software for identify and structure factors with affinity diagram. This is a grouping and structuring of factors that impact on a problem.
Picture: PROBLEM ANALYSIS. Identify and Structure Factors
A causal model is an abstract concept, that describes the causal mechanisms of a system, by noting certain variables and their influence on each other, in an effort to discover the cause of a certain problem or flaw. This model is presented in diagram form by using a fishbone diagram.
ConceptDraw DIAGRAM diagramming and vector drawing software enhanced with Fishbone Diagrams solution helps you create business productivity diagrams from Fishbone diagram templates and examples, that provide to start using of the graphic method for the analysis of problem causes. Each predesigned Fishbone Diagram template is ready to use and useful for instantly drawing your own Fishbone Diagram.
Picture: Fishbone Diagram Template
Related Solution:
This sample shows the Flowchart that displays the architecture of SQL Exception Translation.
This sample was created in ConceptDraw DIAGRAM diagramming and vector drawing software using the Flowcharts solution from the Diagrams area of ConceptDraw Solution Park.
Picture: Sample Project Flowchart. Flowchart Examples
Related Solution:
A full-featured project management solution with all the necessary functions right at your fingertips. Generates an extensive variety of reports on project and task statuses.
These videos provide a series of lessons that will enhance the understanding of all our users, from people just starting out with the software, through to expert users.
Picture: Project — Working With Tasks