Business and Finance Illustrations
|
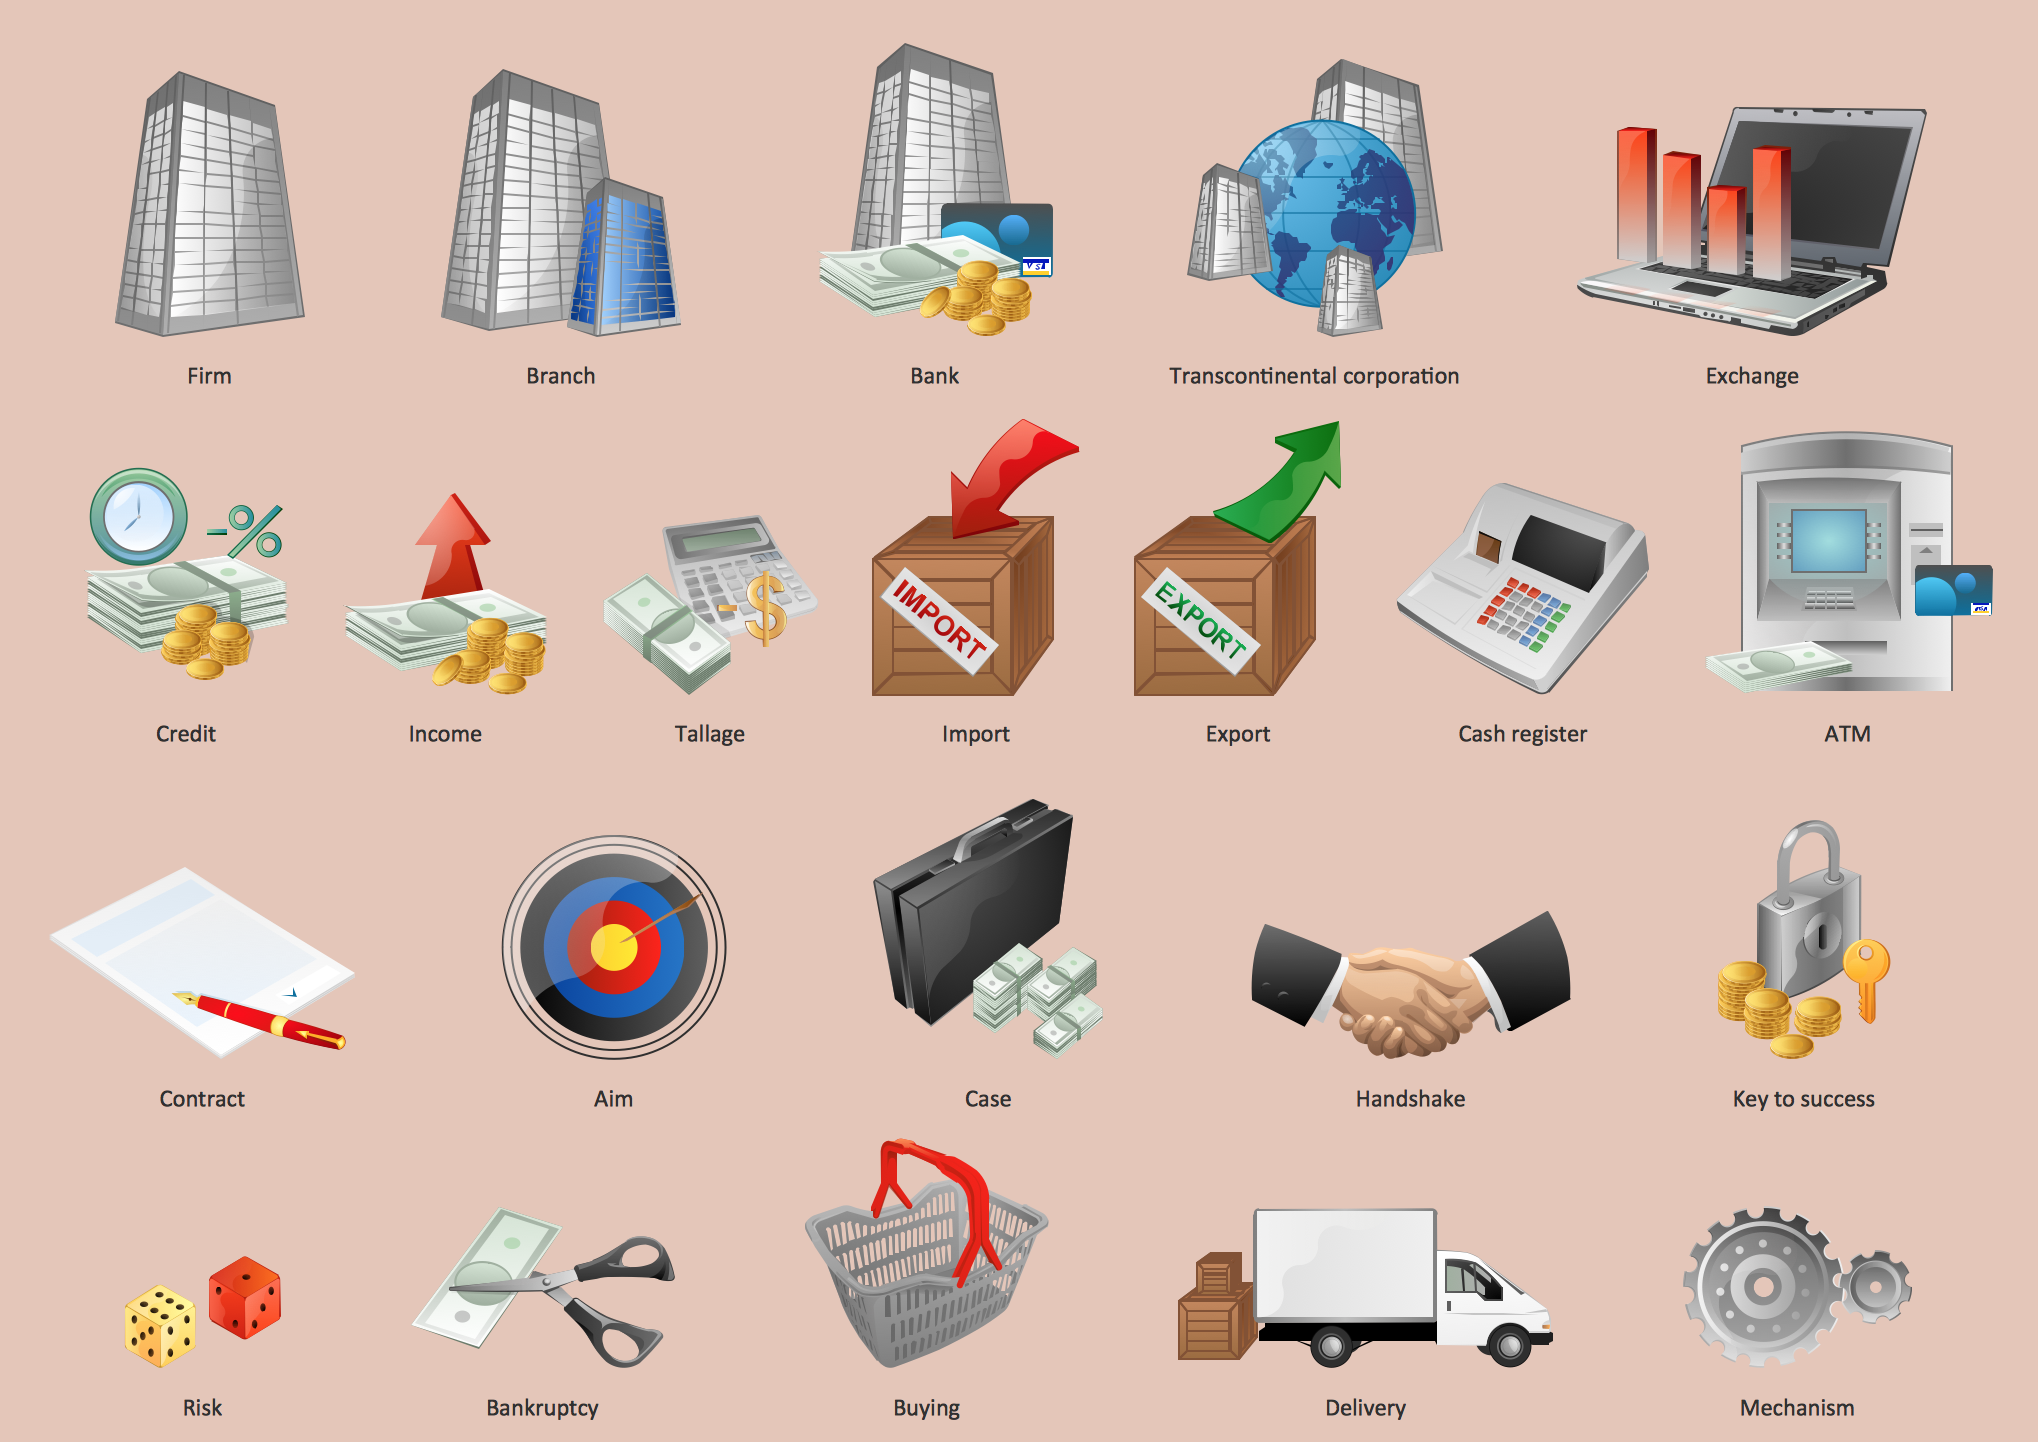
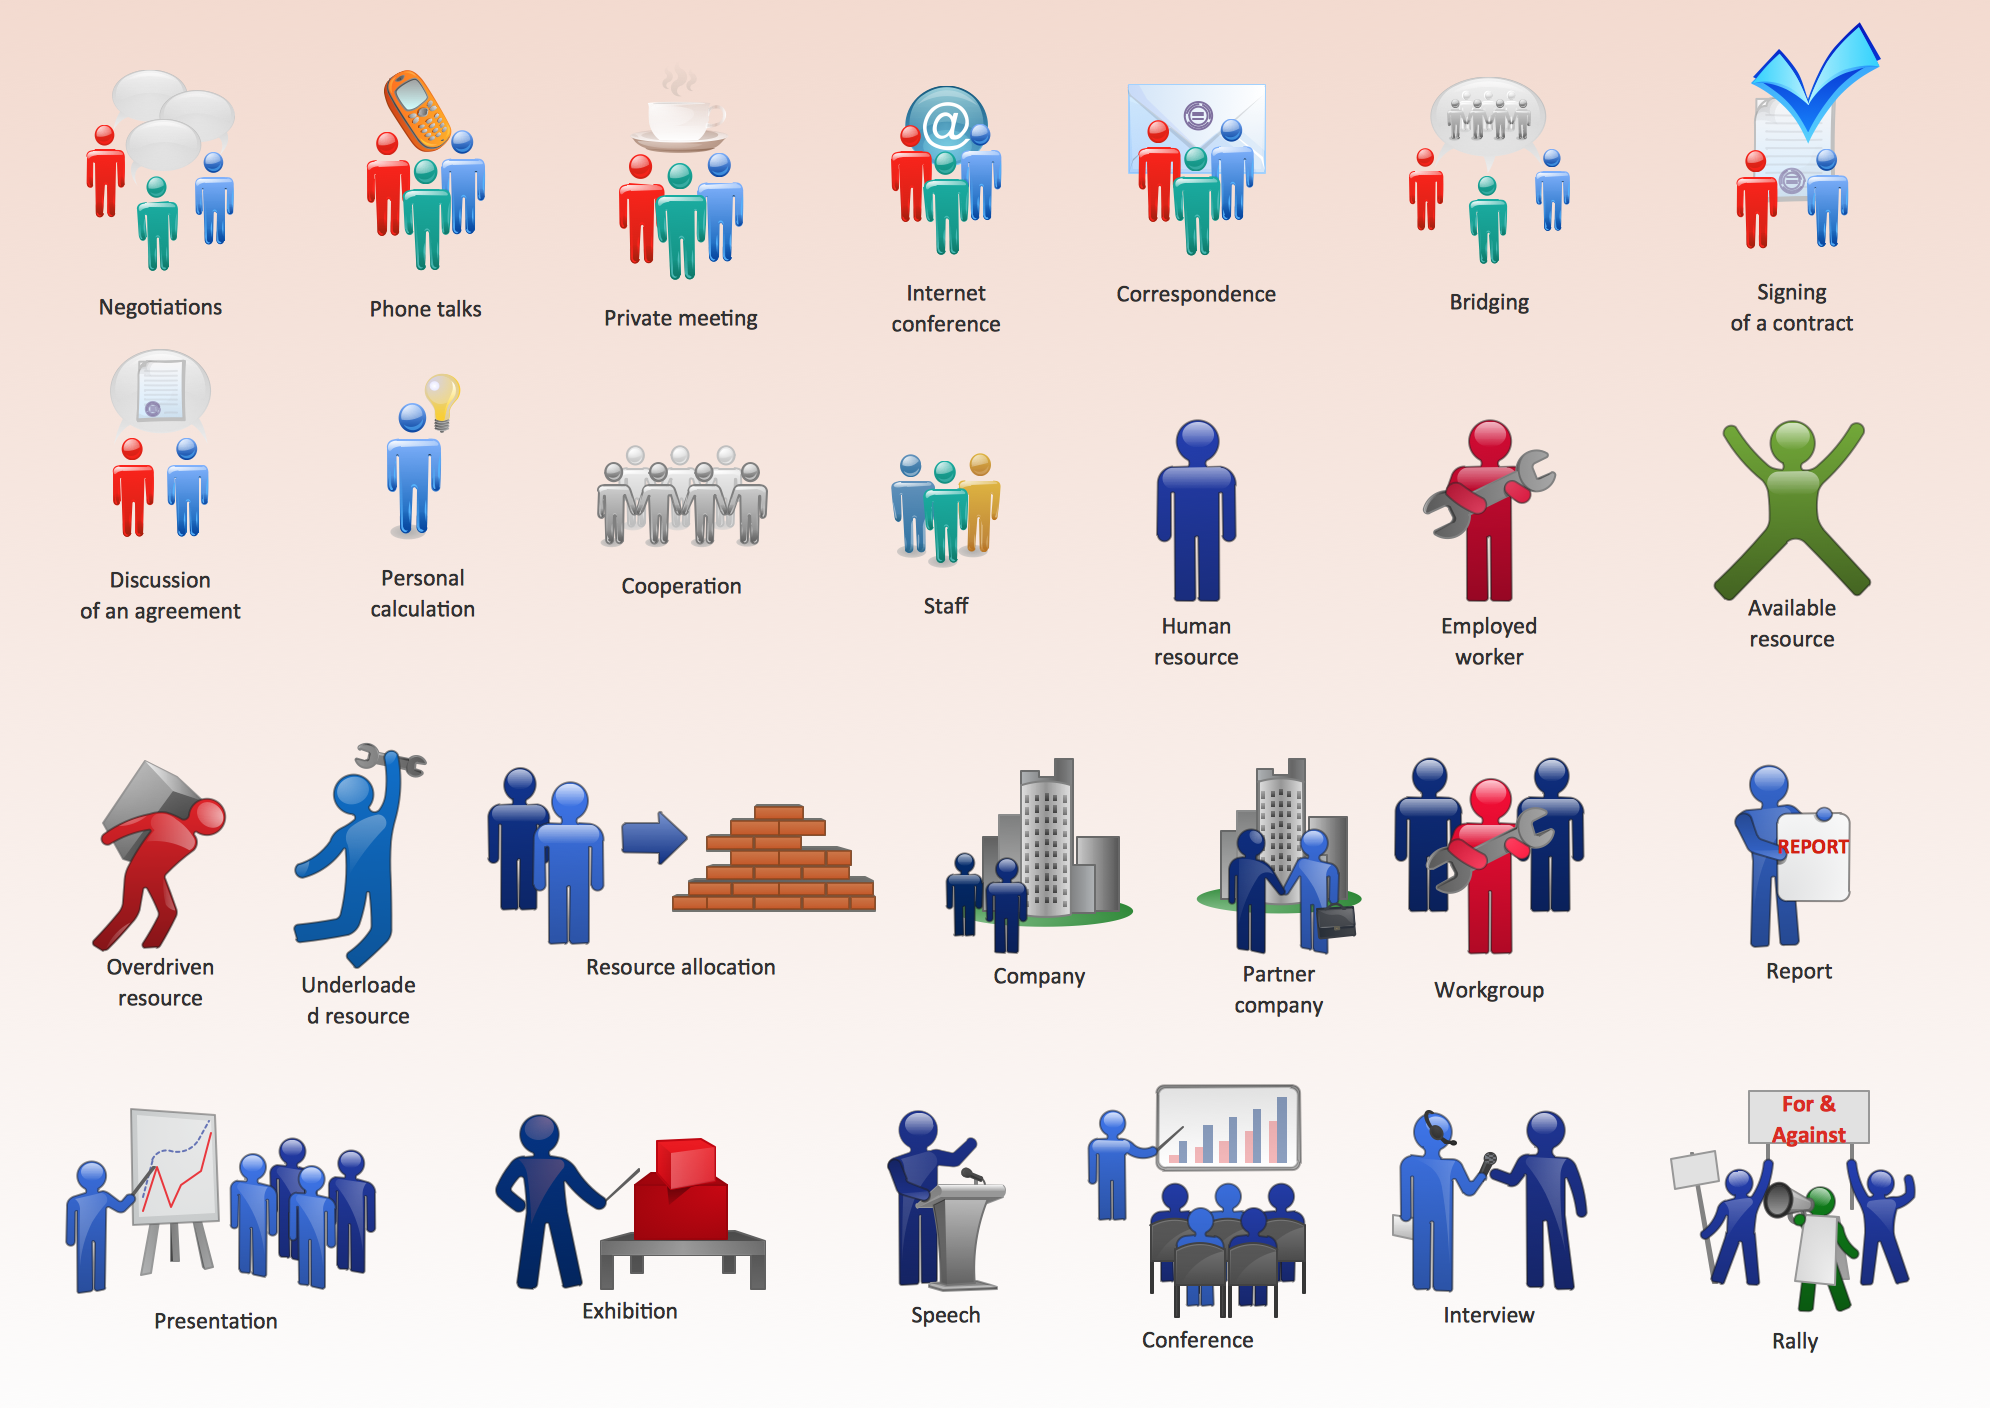
The Business and Finance solution from Illustration area of ConceptDraw Solution Park provides vector clipart libraries for drawing business and finance illustrations using ConceptDraw DIAGRAM diagramming and vector drawing software. Use it to quickly create illustrations, diagrams and infographics for business and financial documents, presentations and websites. The Business and Finance solution contains 12 vector clipart libraries: Advertising, Business, Business people clipart, Business people figures, Currency, Mail and post, Management, Marketing, Money, Office, Project management, Time.  Time Time
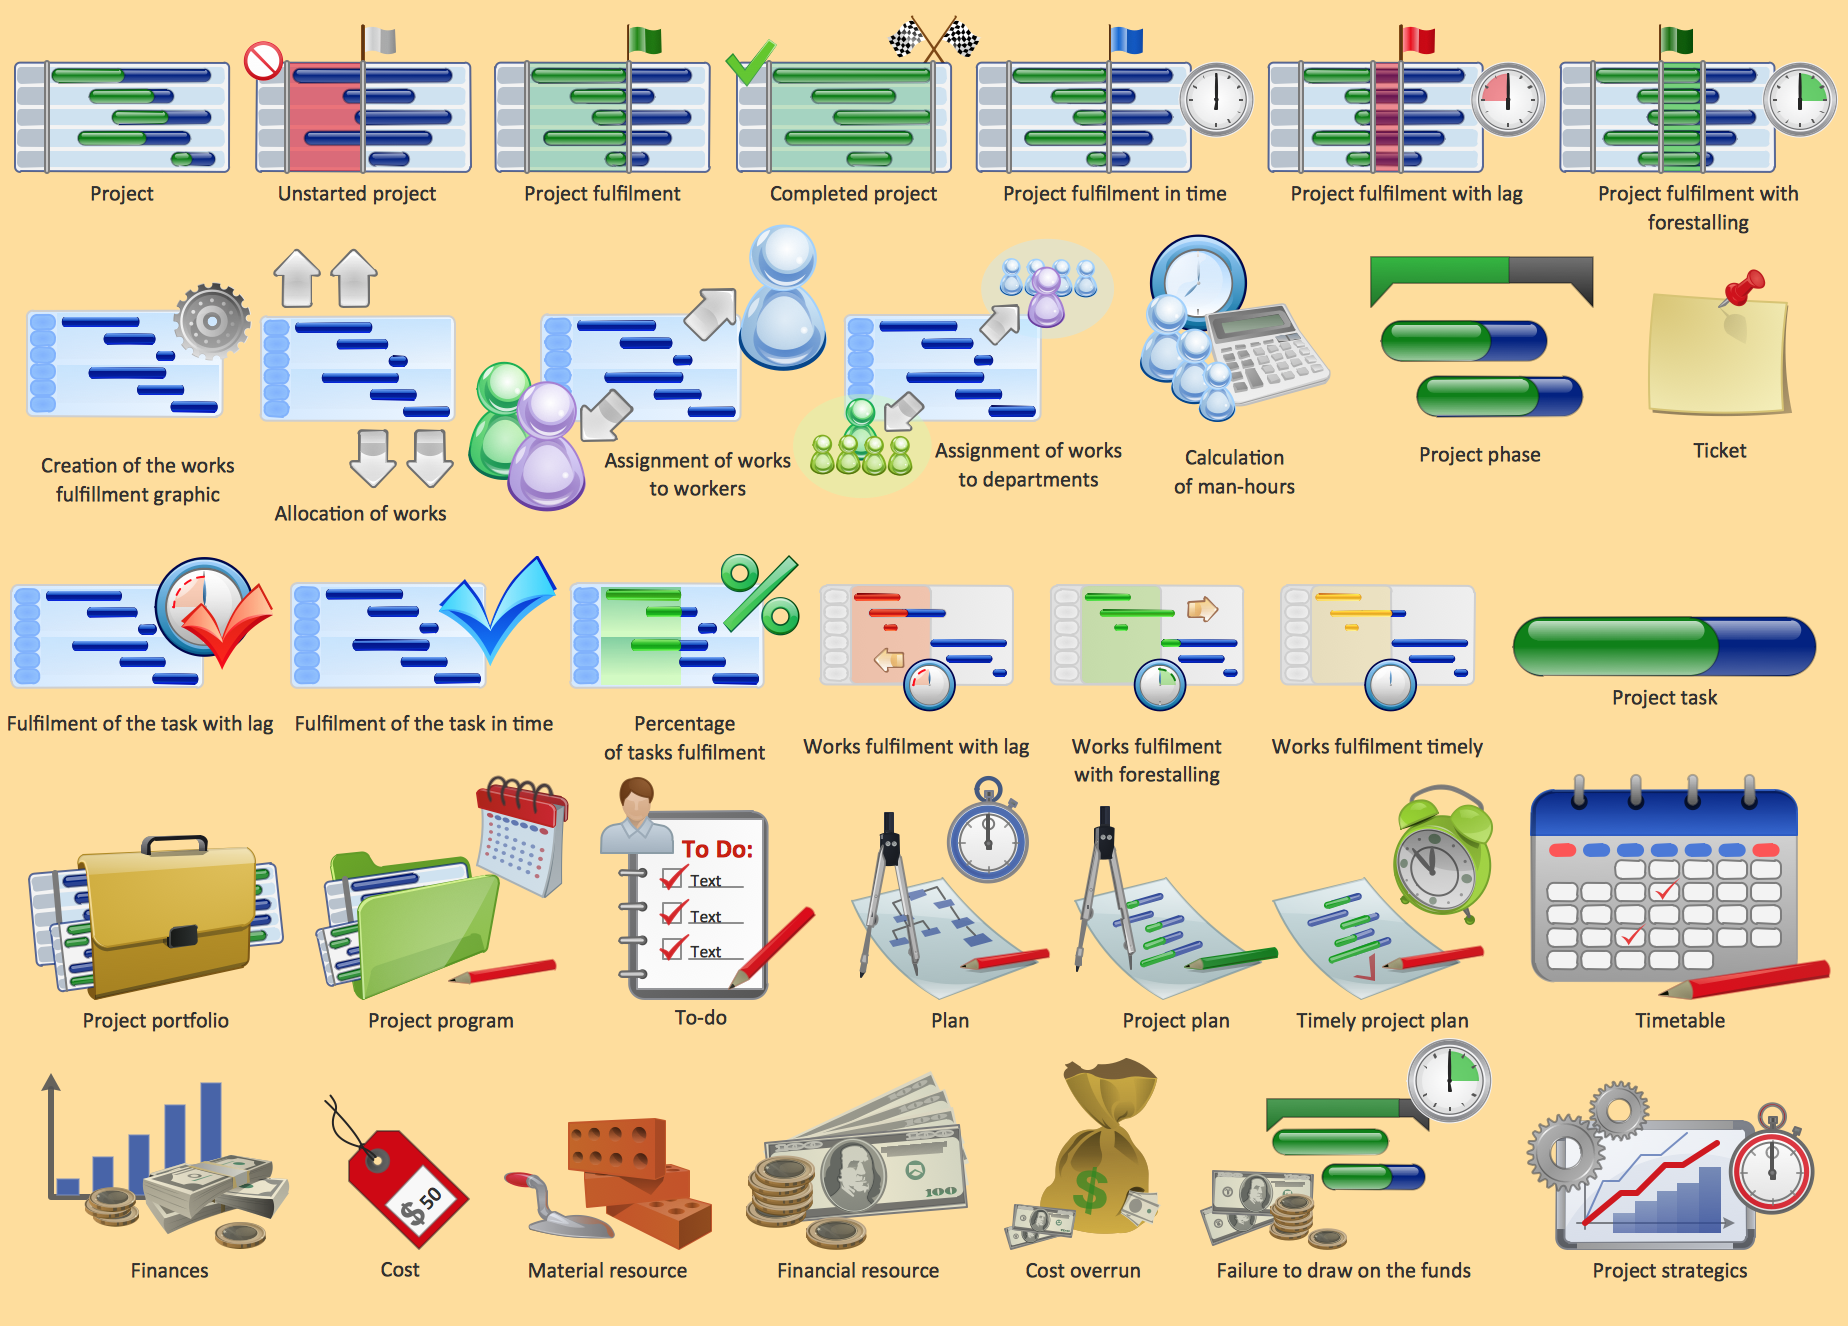 Project management Project management
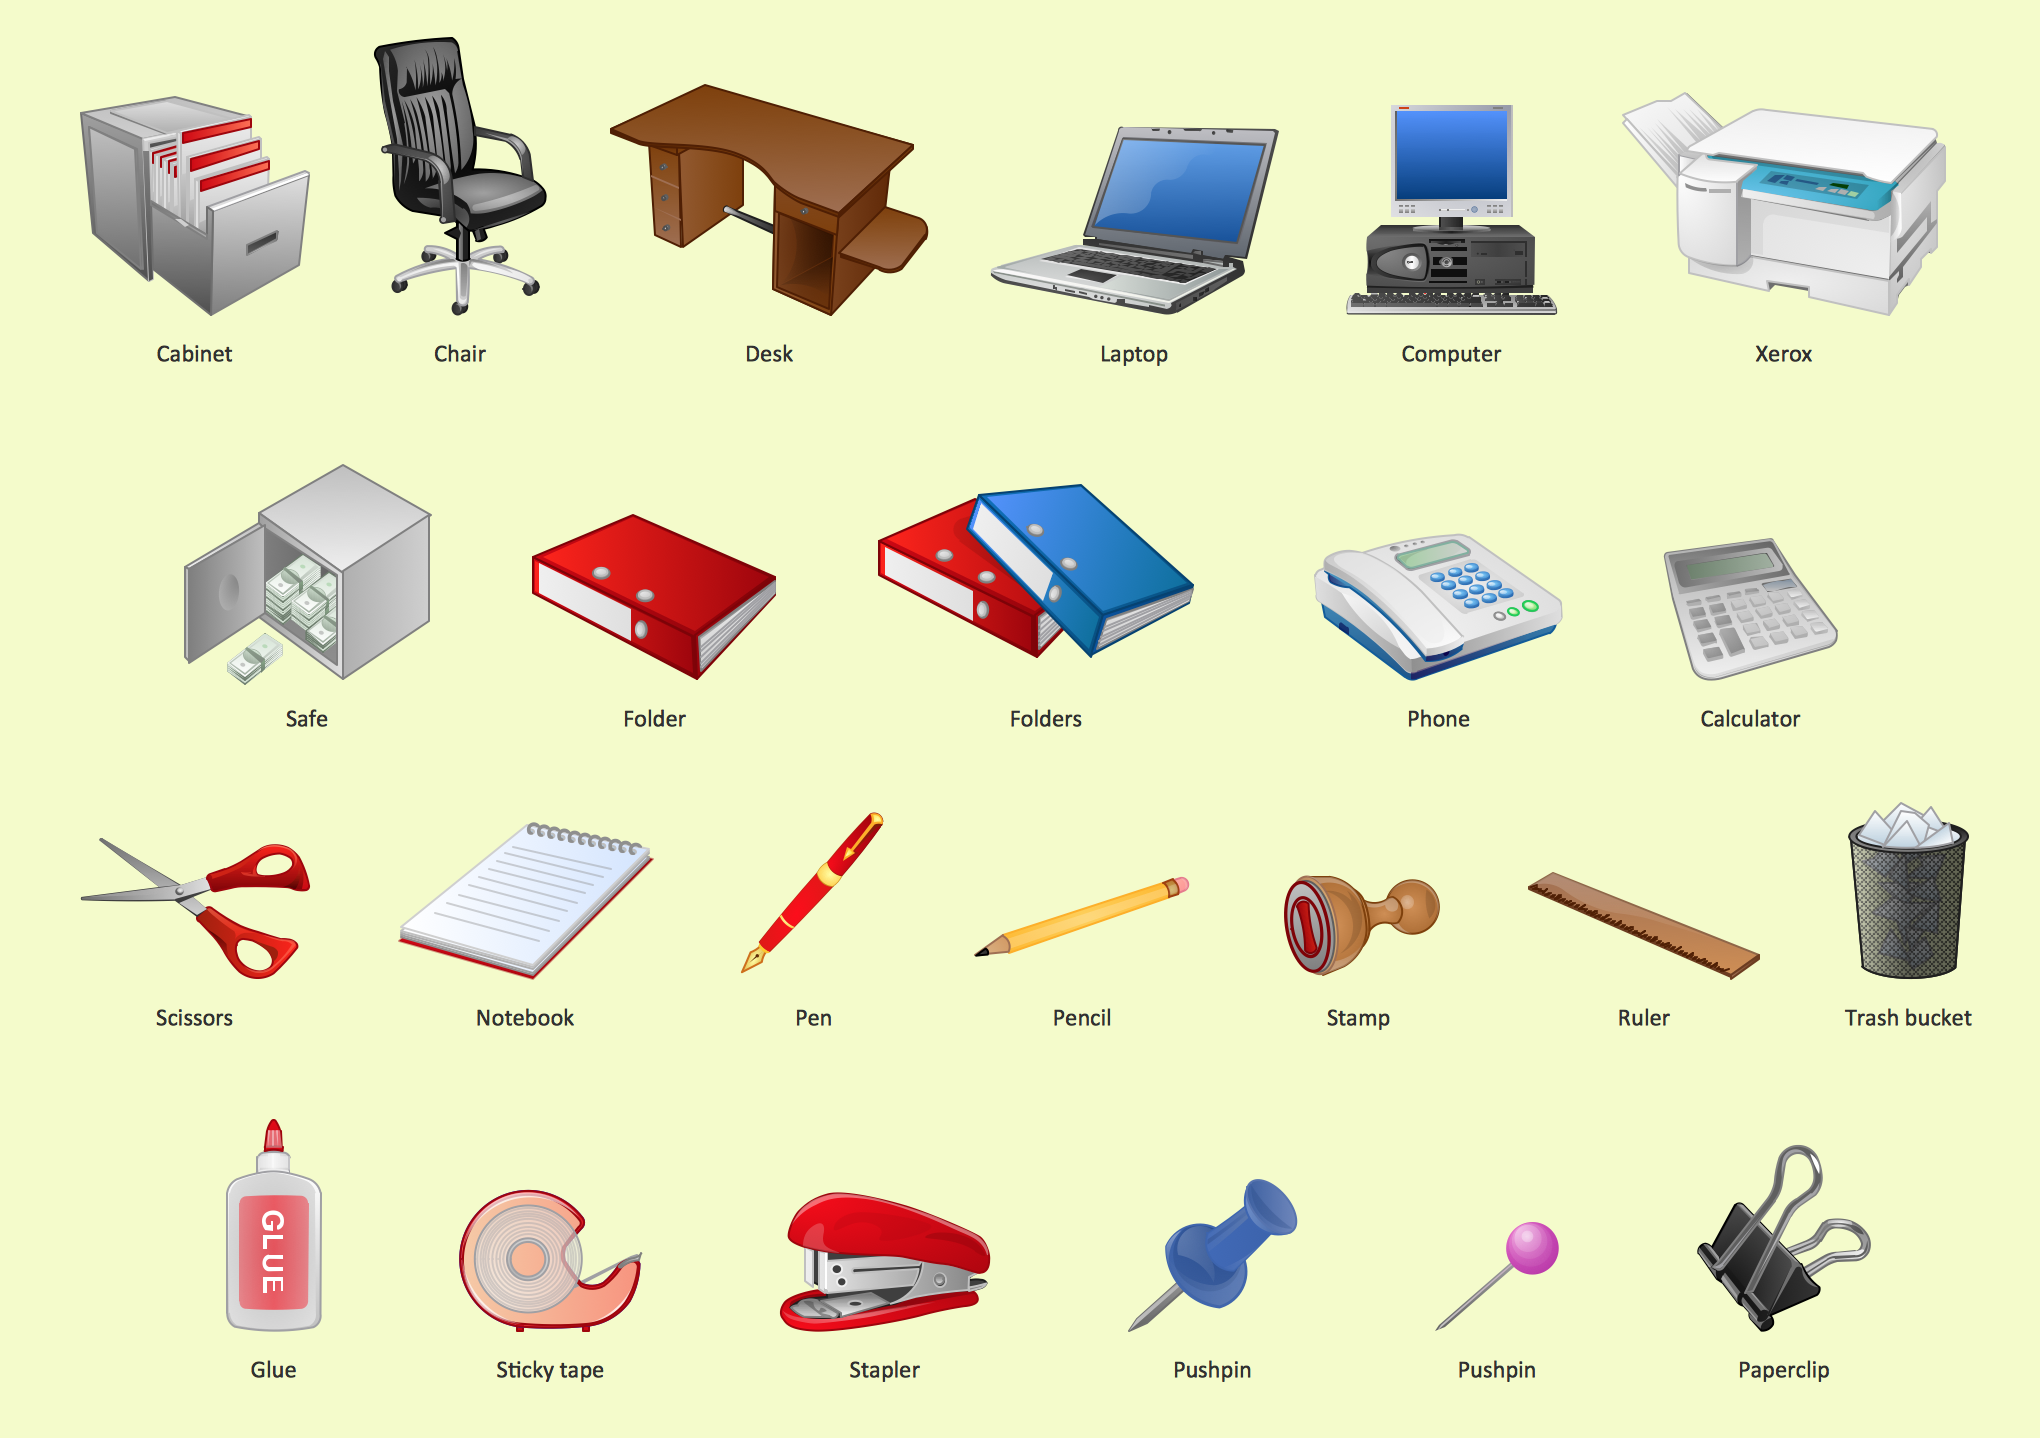 Office Office
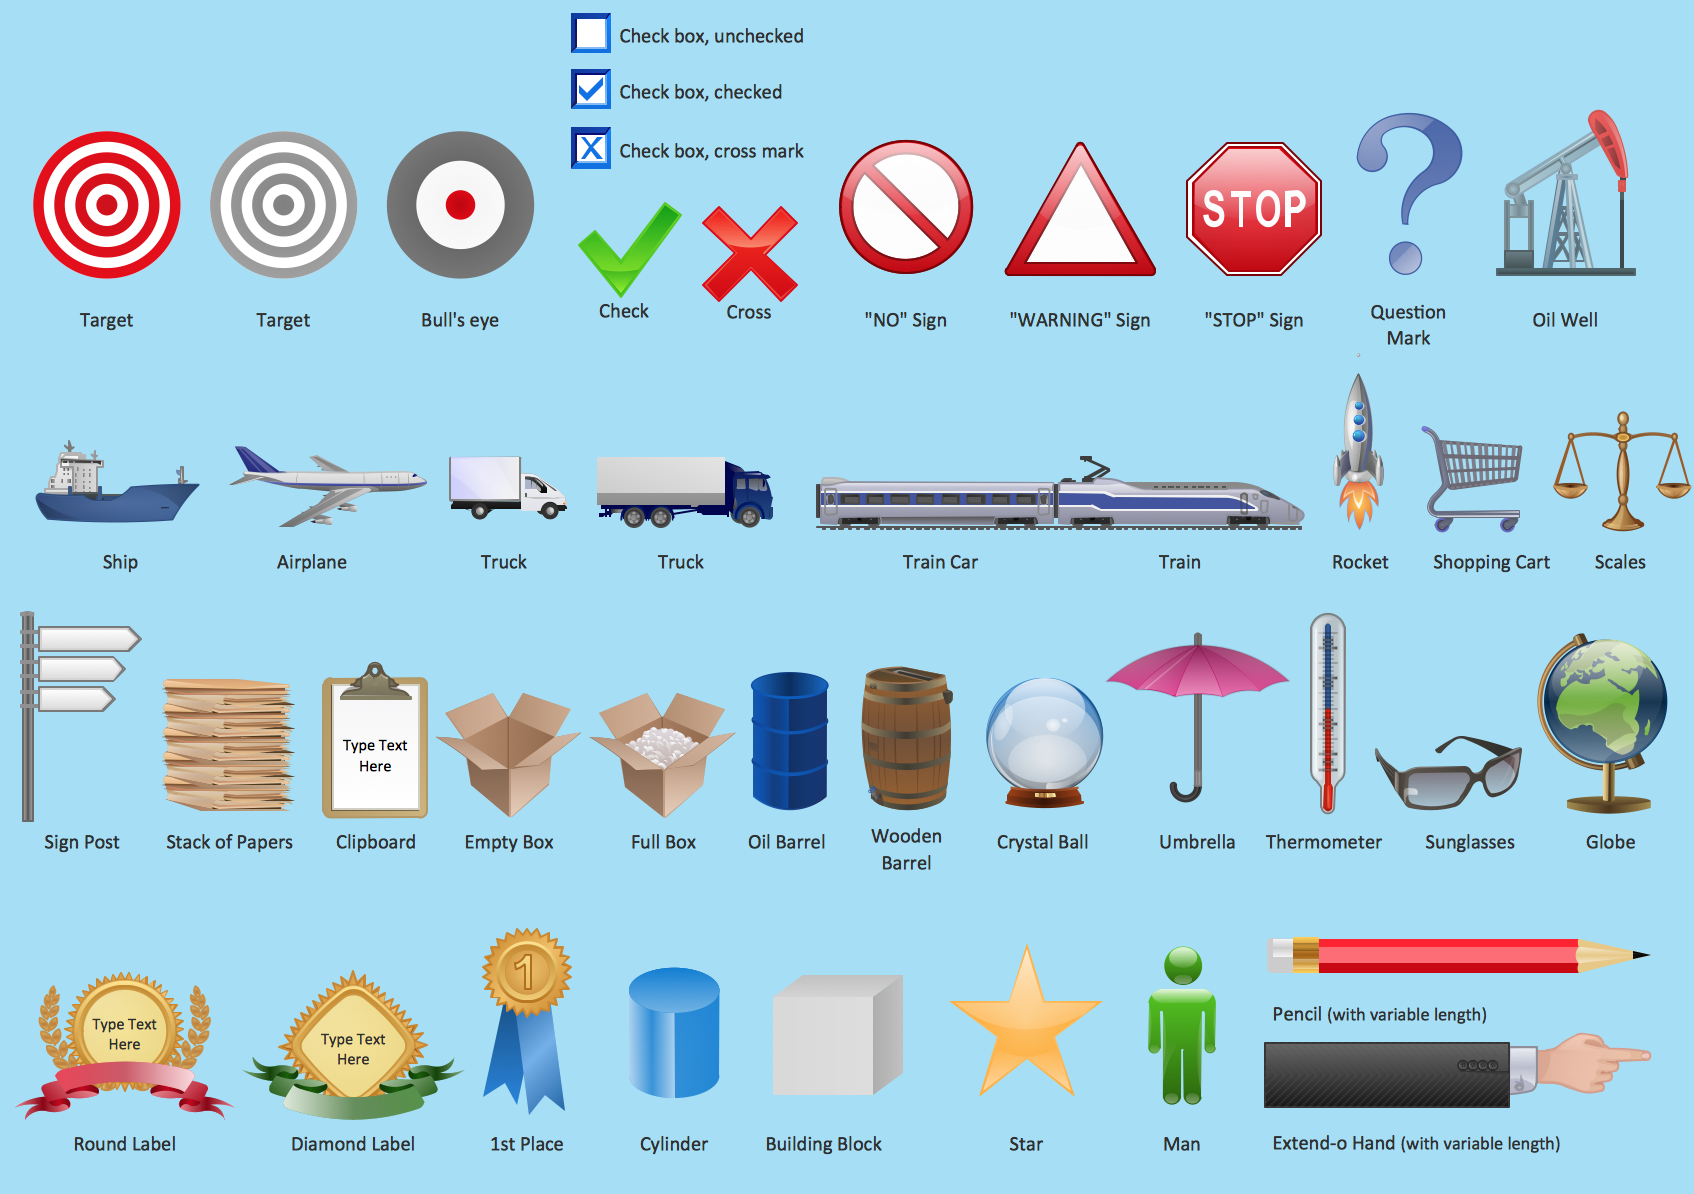 Marketing Marketing
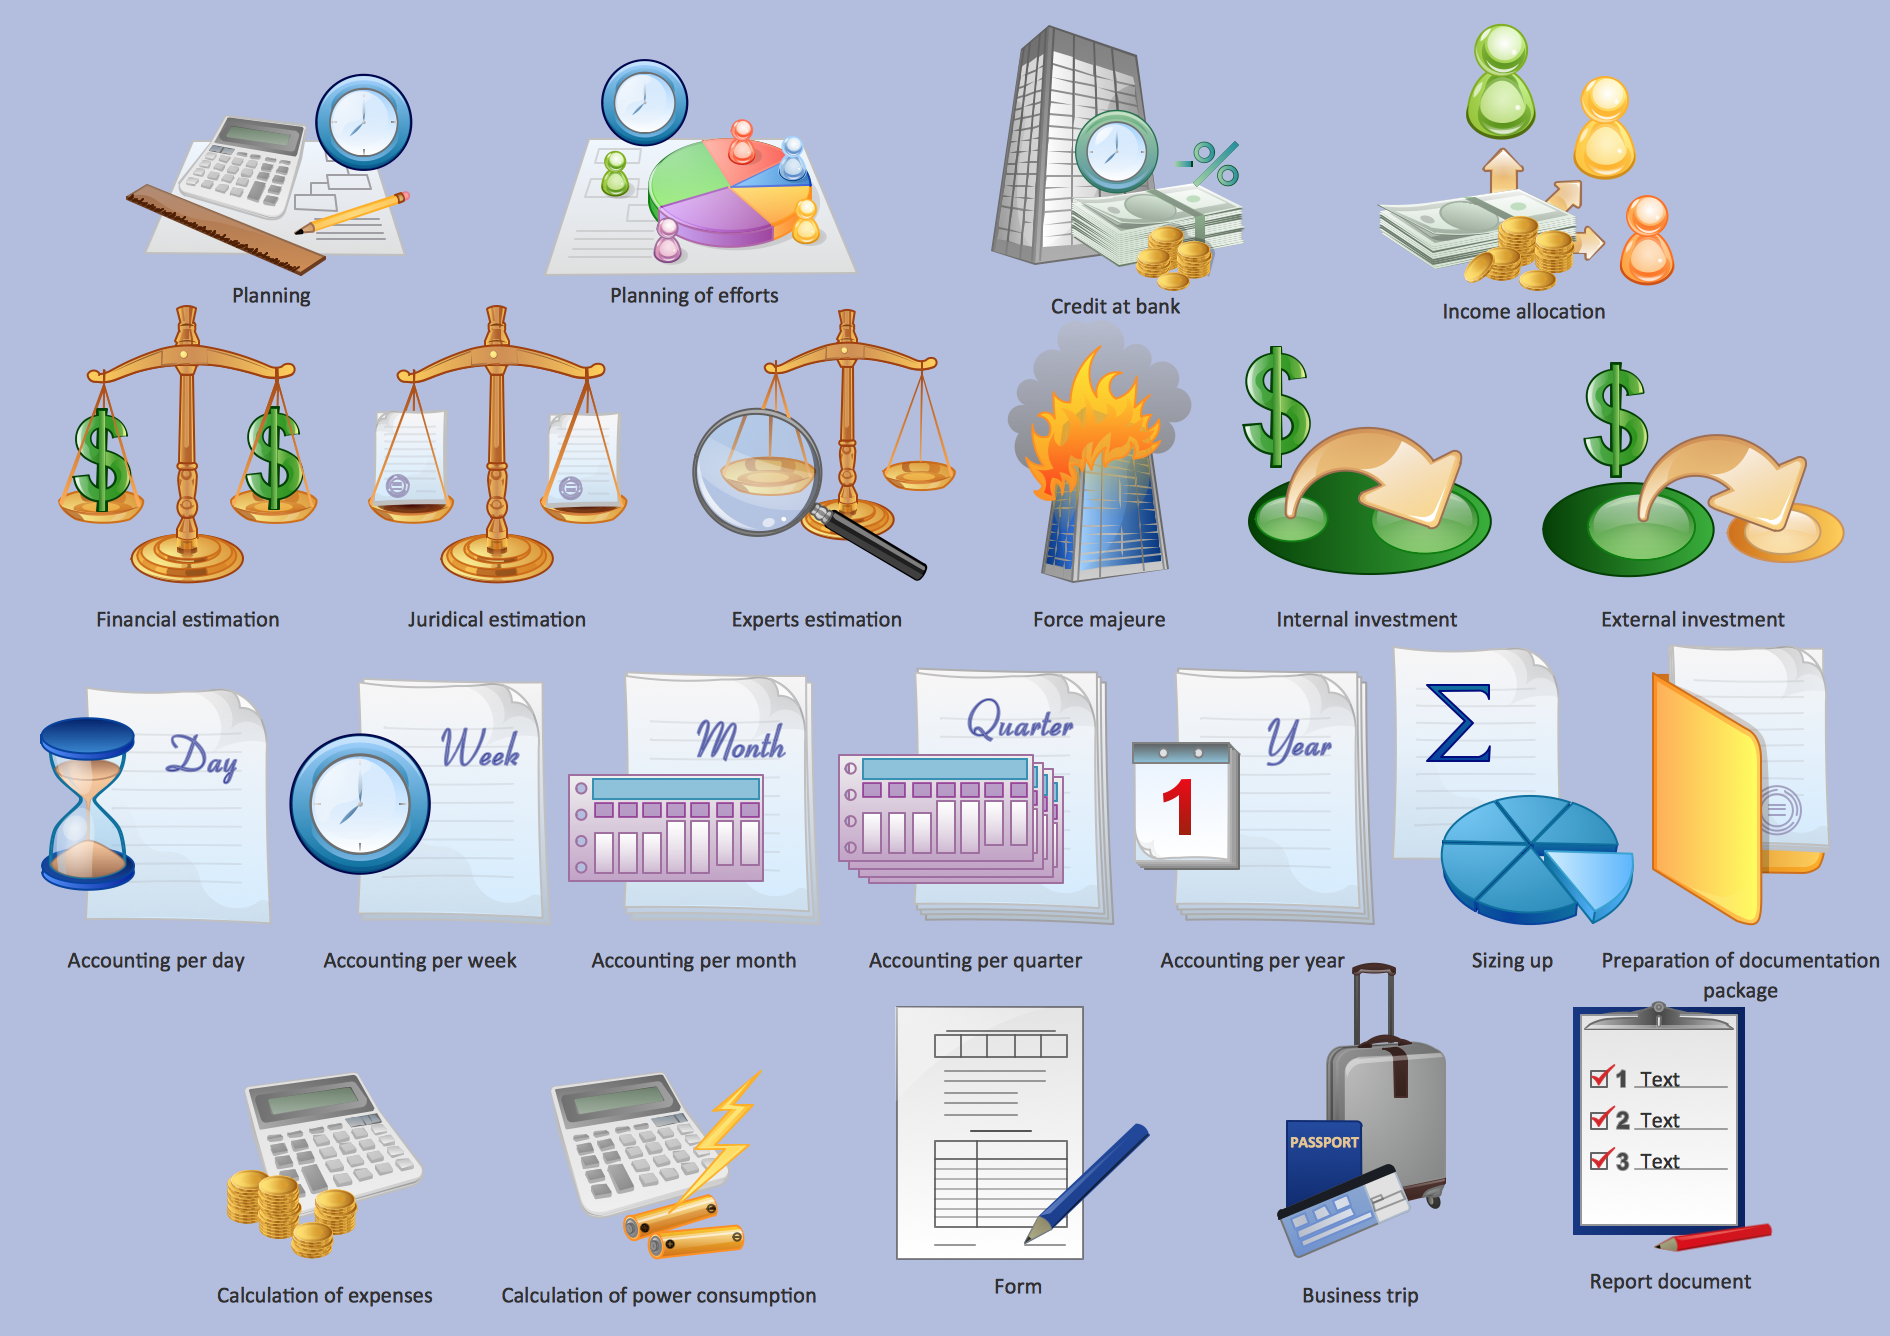 Management Management
 Business Business
 Business People Clipart Business People Clipart
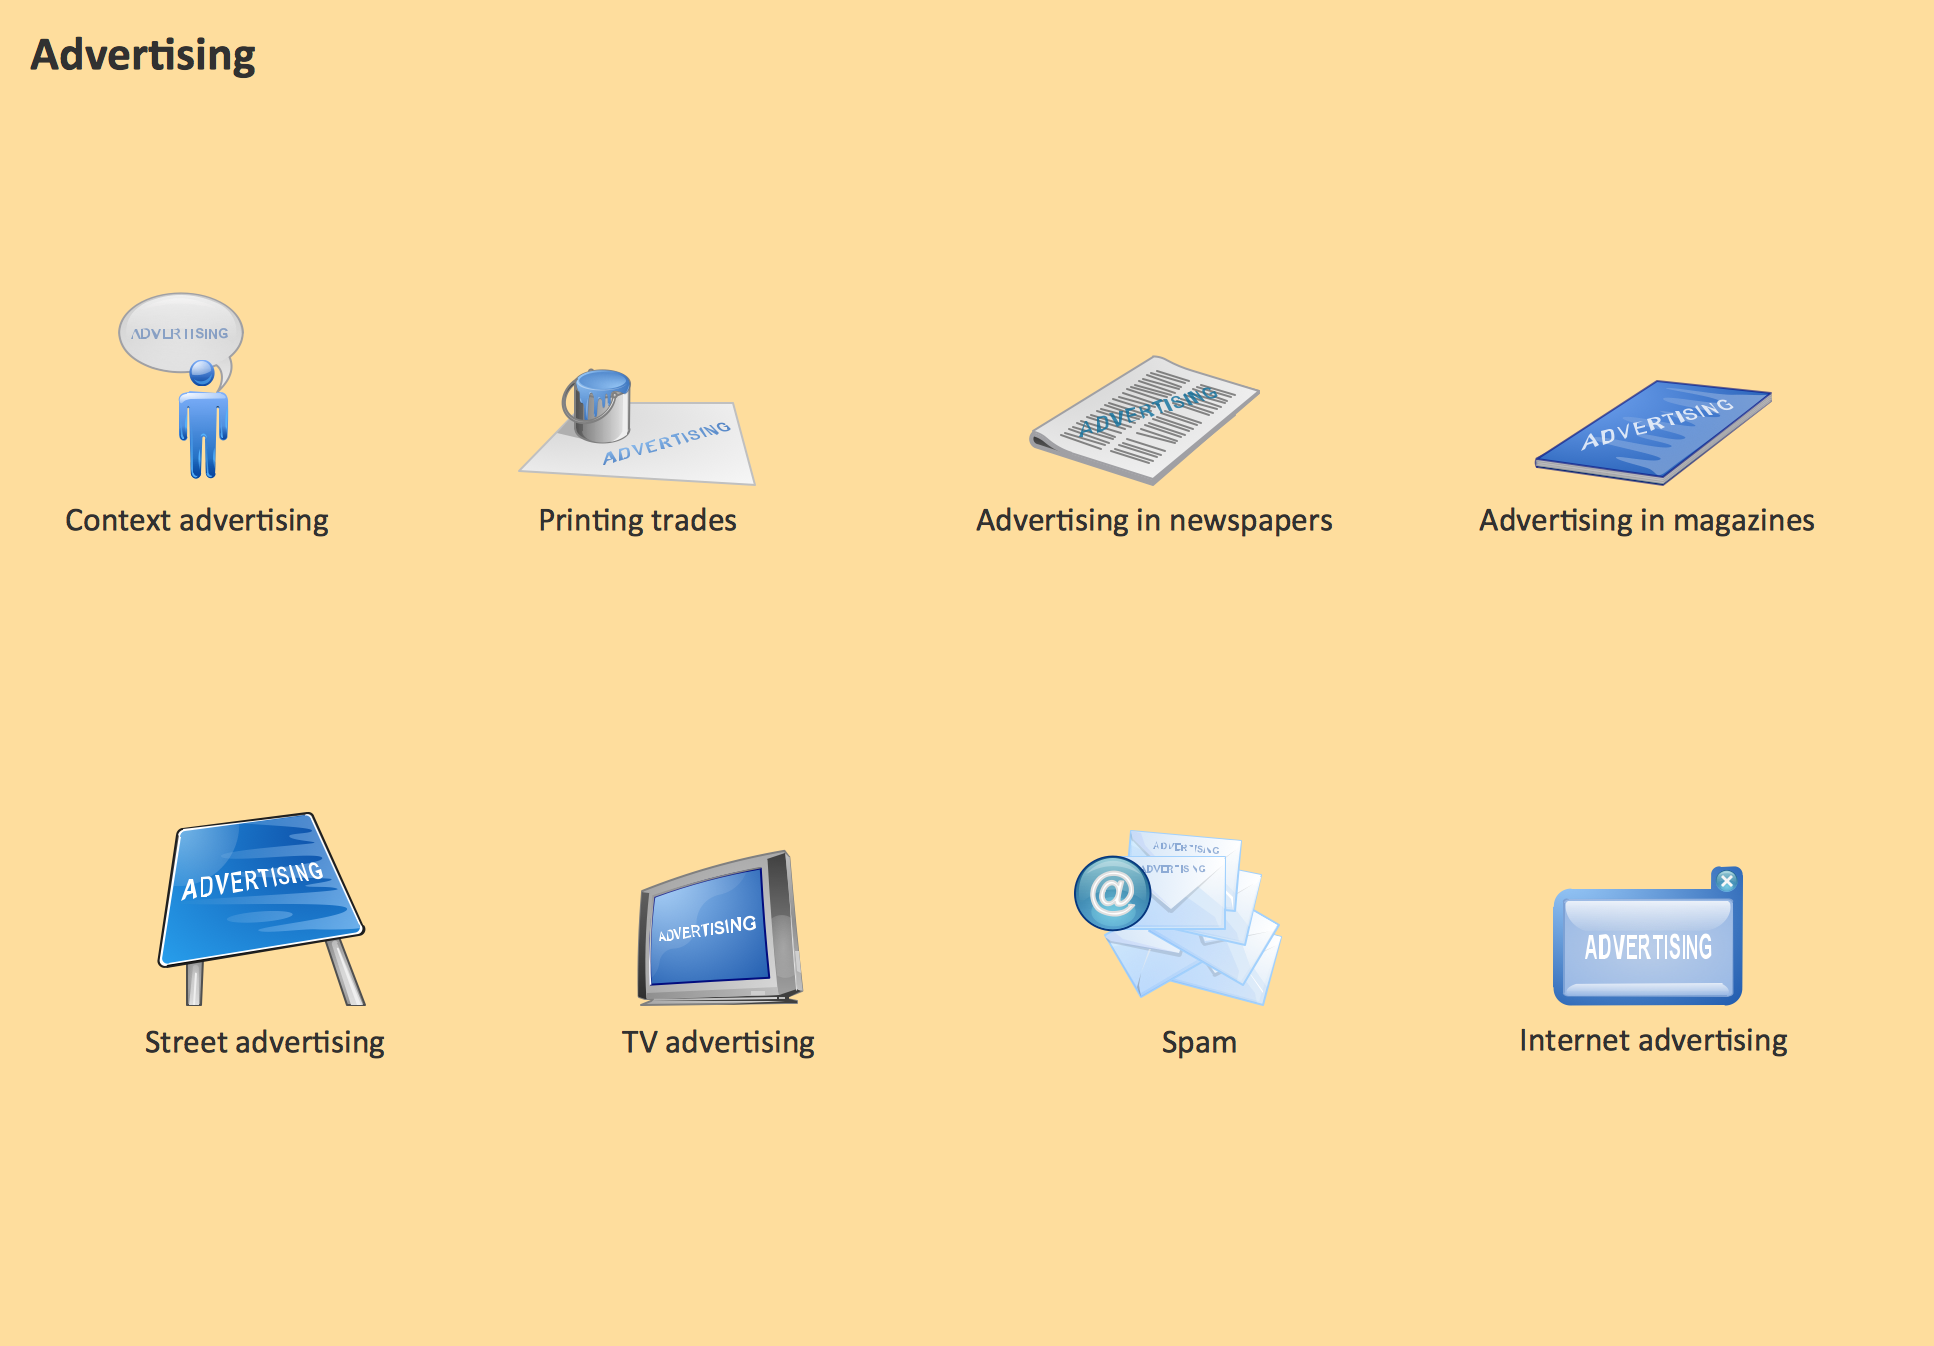 Advertising Advertising
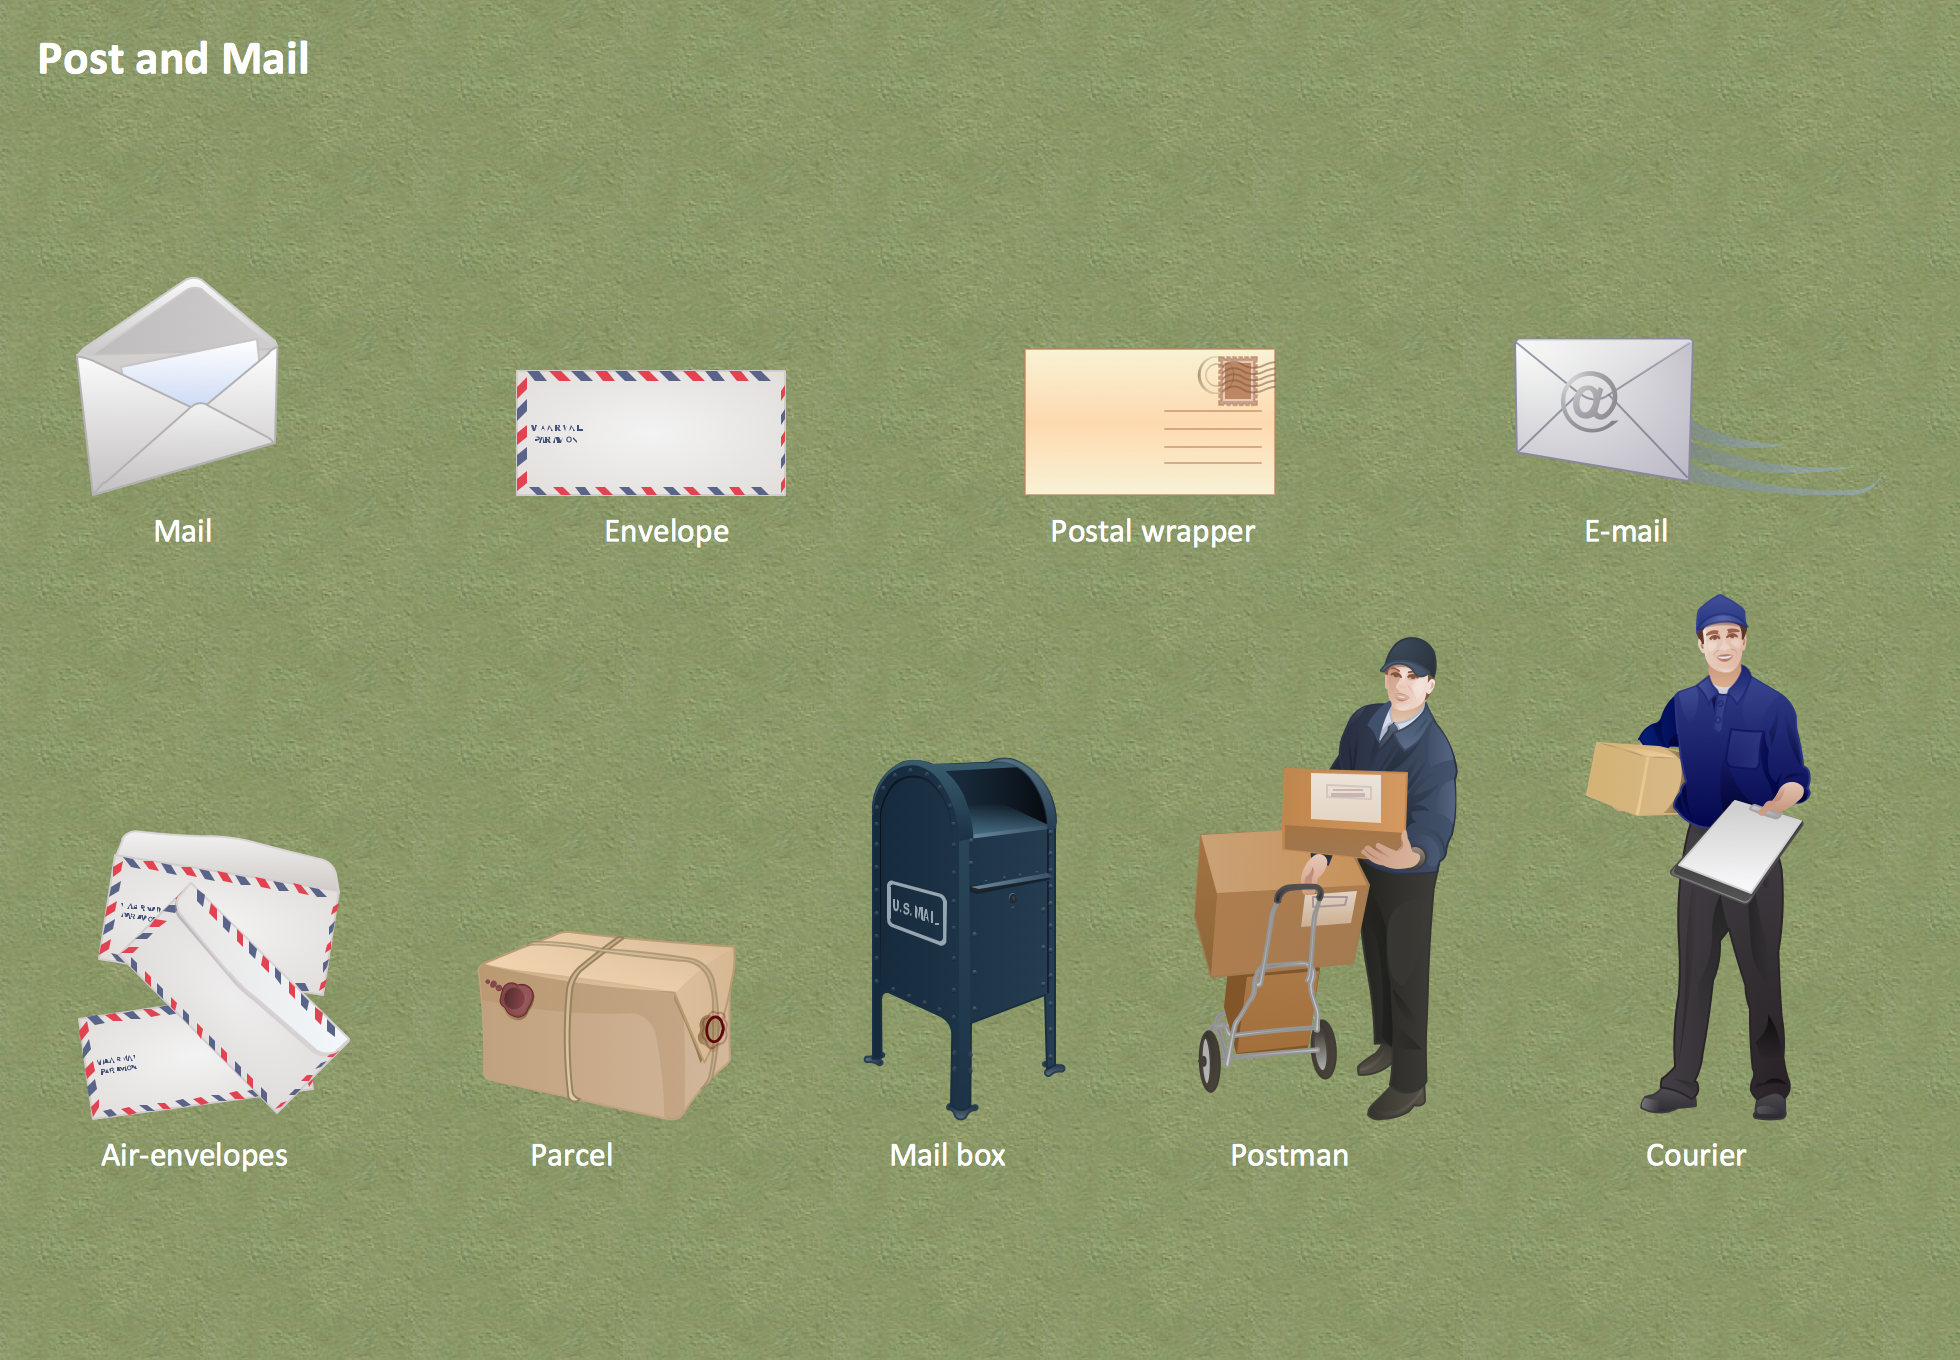 Post and Mail Post and Mail
 Business People Figures Business People Figures
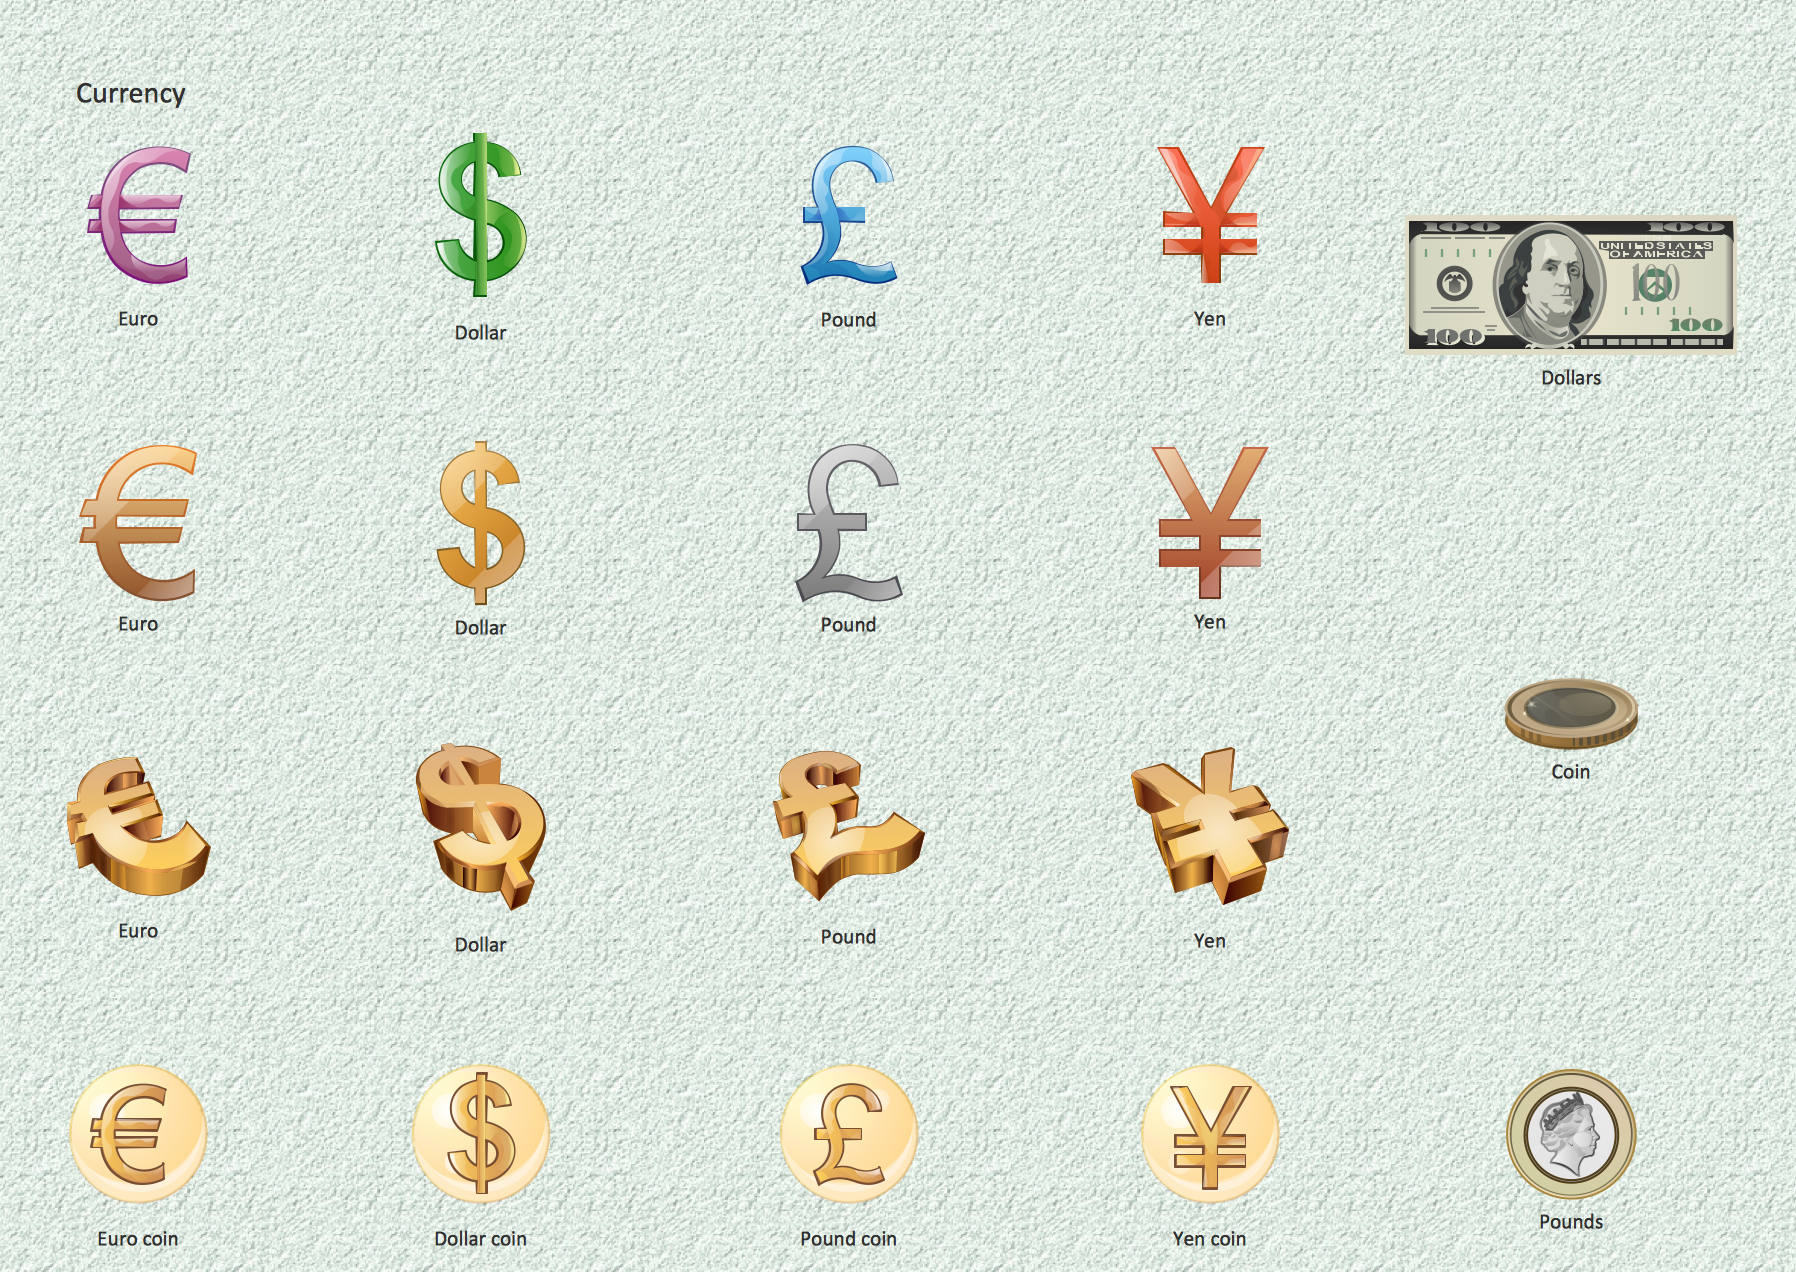 Currency Currency
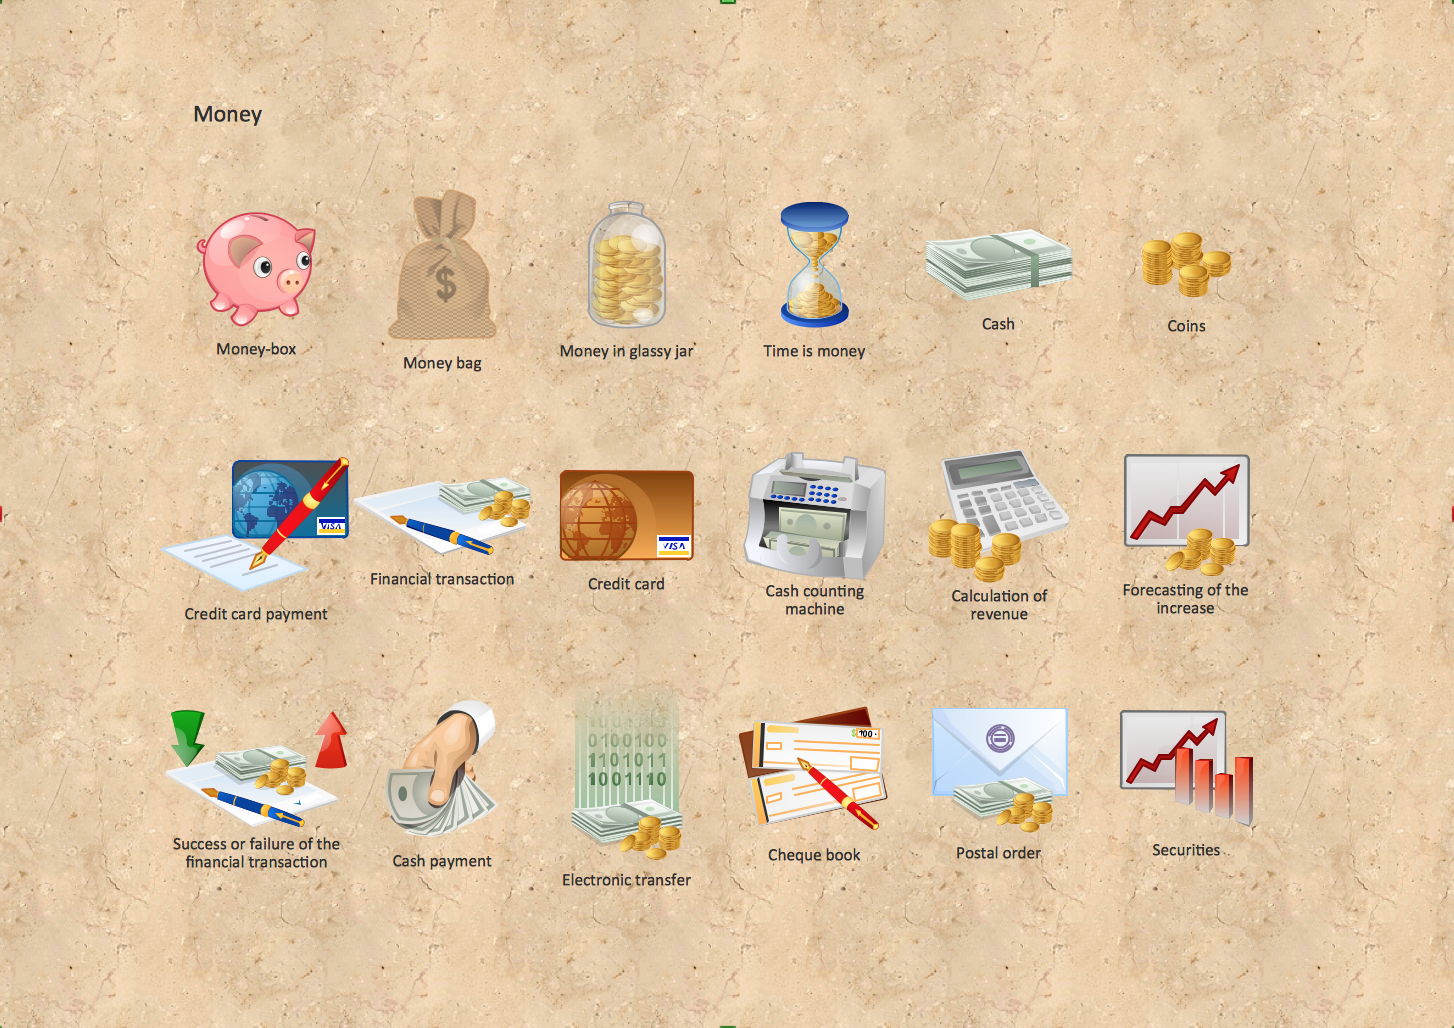 Money Money
|
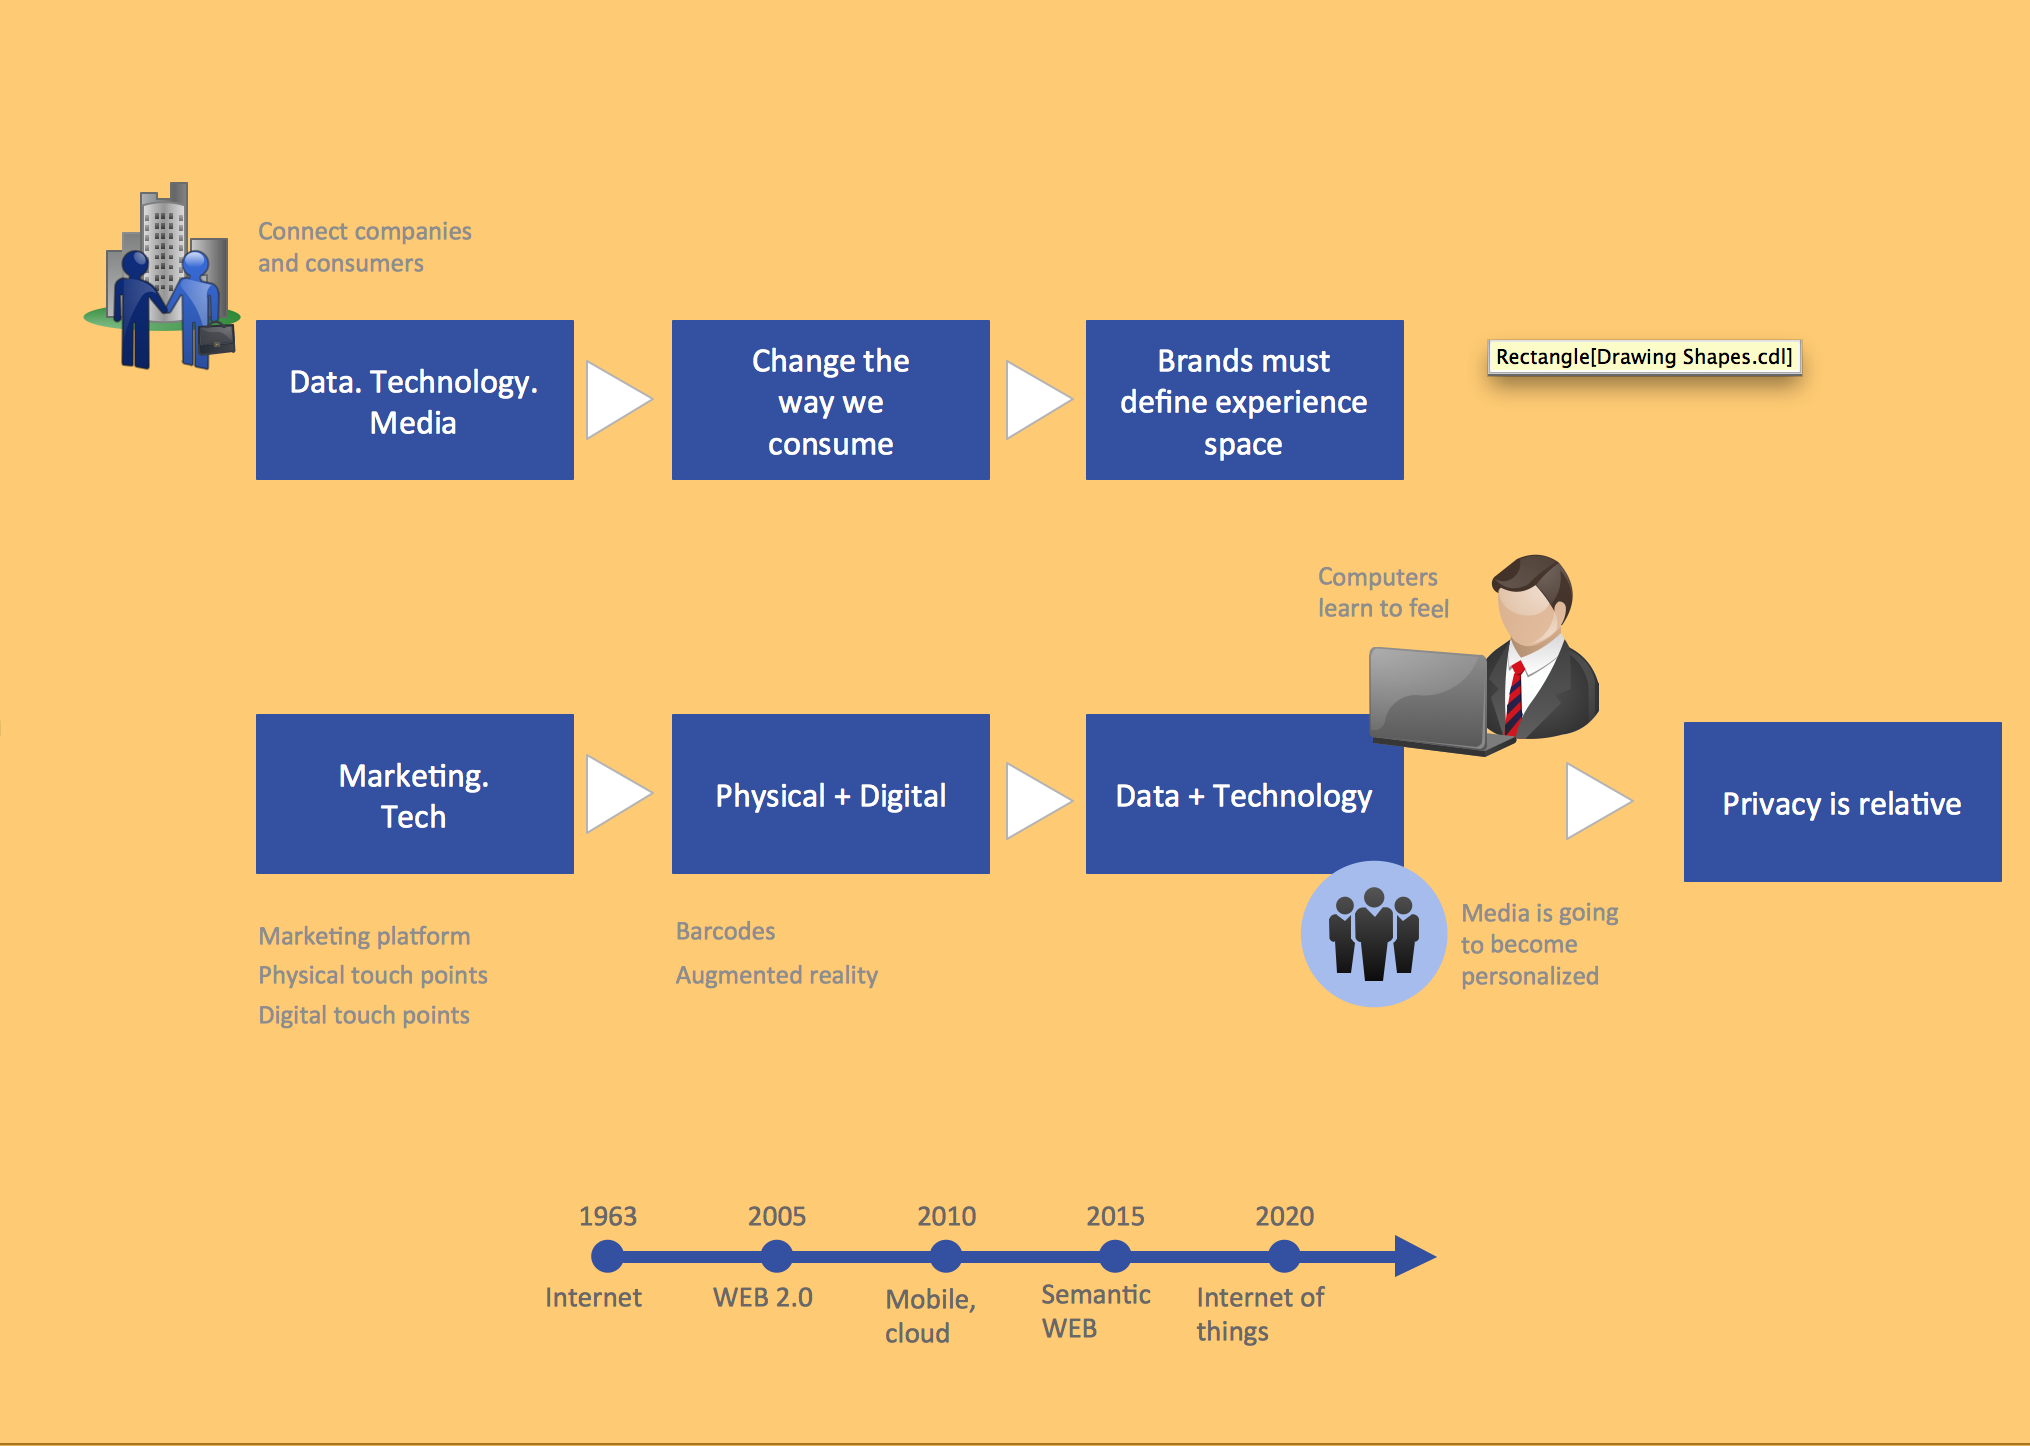
Pic.1. Illustrations business and finance. Advertising landscape
TEN RELATED HOW TO's:
A pie chart is a circular diagram showing a set of data divided into proportional slices. There are several variations of this chart such as donut chart, exploded pie chart, multi-level pie charts. Although it is not very informative when a ring chart or circle chart has many sections, so choosing a low number of data points is quite important for a useful pie chart.
ConceptDraw DIAGRAM software with Pie Charts solution helps to create pie and donut charts for effective displaying proportions in statistics, business and mass media for composition comparison, i.e. for visualization of part percentage inside one total.
Picture: Pie Chart Software
Related Solution:
SWOT matrix templates is part of SWOT Analysis solution from ConceptDraw Solution Park.
Picture: SWOT matrix template
This sample was created in ConceptDraw DIAGRAM diagramming and vector drawing software using the Business Process Diagram Solution from the Business Processes area of ConceptDraw Solution Park. The Business Process Solution is based on the standard BPMN 2.0 and includes the set of libraries of ready-to-use objects.
Picture: BPR Diagram. Business Process Reengineering Example
Related Solution:
If you have no time, you can create a SWOT diagram even on asphalt using a chalk. Although, in case you want a proper scheme, you should use a special software for creating SWOT analysis diagrams that would be comprehensible. SWOT analysis is useful not only for business purposes, but even for cities or for a particular person.
The ConceptDraw SWOT and TOWS Matrix Diagrams solution is a tool for performing both SWOT and TOWS analysis. It provides templates of different sorts of Matrix Diagrams. Besides different embedded templates, the solution enabling create custom SWOT and TOWS matrices. Using the compatibility between the MINDMAP and DIAGRAM is the best way of making SWOT or TOWS diagrams quickly. The mind map templates help identify the core statements of SWOT and TOWS analysis: Strengths, Weaknesses, Opportunities, and Threats. The next step is matrix creation - both SWOT and TOWS analysis use the same basic steps and the only difference is the order in which these criteria are studied.
Picture: Software for Creating SWOT Analysis Diagrams
Related Solution:
Mind map specifying various online marketing objectives for a company with specific targets outlined for each objective.
Picture: Online Marketing Objectives
Related Solution:
An example of marketing analysis diagram, can be used to analyse product market and define marketing strategy.
Picture: Marketing Analysis Diagram
Related Solution:
Electrical plan is a document that is developed during the first stage of the building design. This scheme is composed of conventional images or symbols of components that operate by means of electric energy. To simplify the creation of these schemes you can use house electrical plan software, which will not require a long additional training to understand how to use it. You only need to install the necessary software ant it’s libraries and you’ll have one less problem during the building projection.
Any building contains a number of electrical systems, including switches, fixtures, outlets and other lightening equipment. All these should be depicted in a building electrical plans and included to general building documentation. This home electrical plan displays electrical and telecommunication devices placed to a home floor plan. On the plan, each electrical device is referenced with the proper symbol. Electrical symbols are used for universal recognition of the building plan by different persons who will be working on the construction. Not all possible electric symbols used on a certain plan, so the symbols used in the current home plan are included to a legend. The electrical home plan may be added as a separate document to a complete set of building plans.
Picture: How To use House Electrical Plan Software
Related Solution:
ConceptDraw DIAGRAM extended with Bar Graphs solution from Graphs and Charts area of ConceptDraw Solution Park is ideal software for quick and simple drawing bar chart of any complexity graph.
Picture: Bar Chart
Related Solution:
Papua New Guinea, officially named the Independent State of Papua New Guinea, is a country in Oceania that occupies the eastern half of the island of New Guinea (the western portion of the island is a part of the Indonesian provinces of Papua and West Papua) and numerous offshore islands.
The vector stencils library Papua New Guinea contains contours for ConceptDraw DIAGRAM diagramming and vector drawing software. This library is contained in the Continent Maps solution from Maps area of ConceptDraw Solution Park.
Picture: Geo Map - Asia - Papua New Guinea
Related Solution:
Follow samples and map templates to create nfographic maps. It's super-easy!
Picture: Map Infographic Creator
ConceptDraw
DIAGRAM 18