Business - Design Elements
Business - Vector clipart libraryThe vector stencils library Business is included in the Business and Finance solution from Illustration area of ConceptDraw Solution Park. Use it to quick draw illustrations, diagrams and infographics for your business documents, presentations and websites. The clipart library Business includes 22 concept and metaphor images:
|
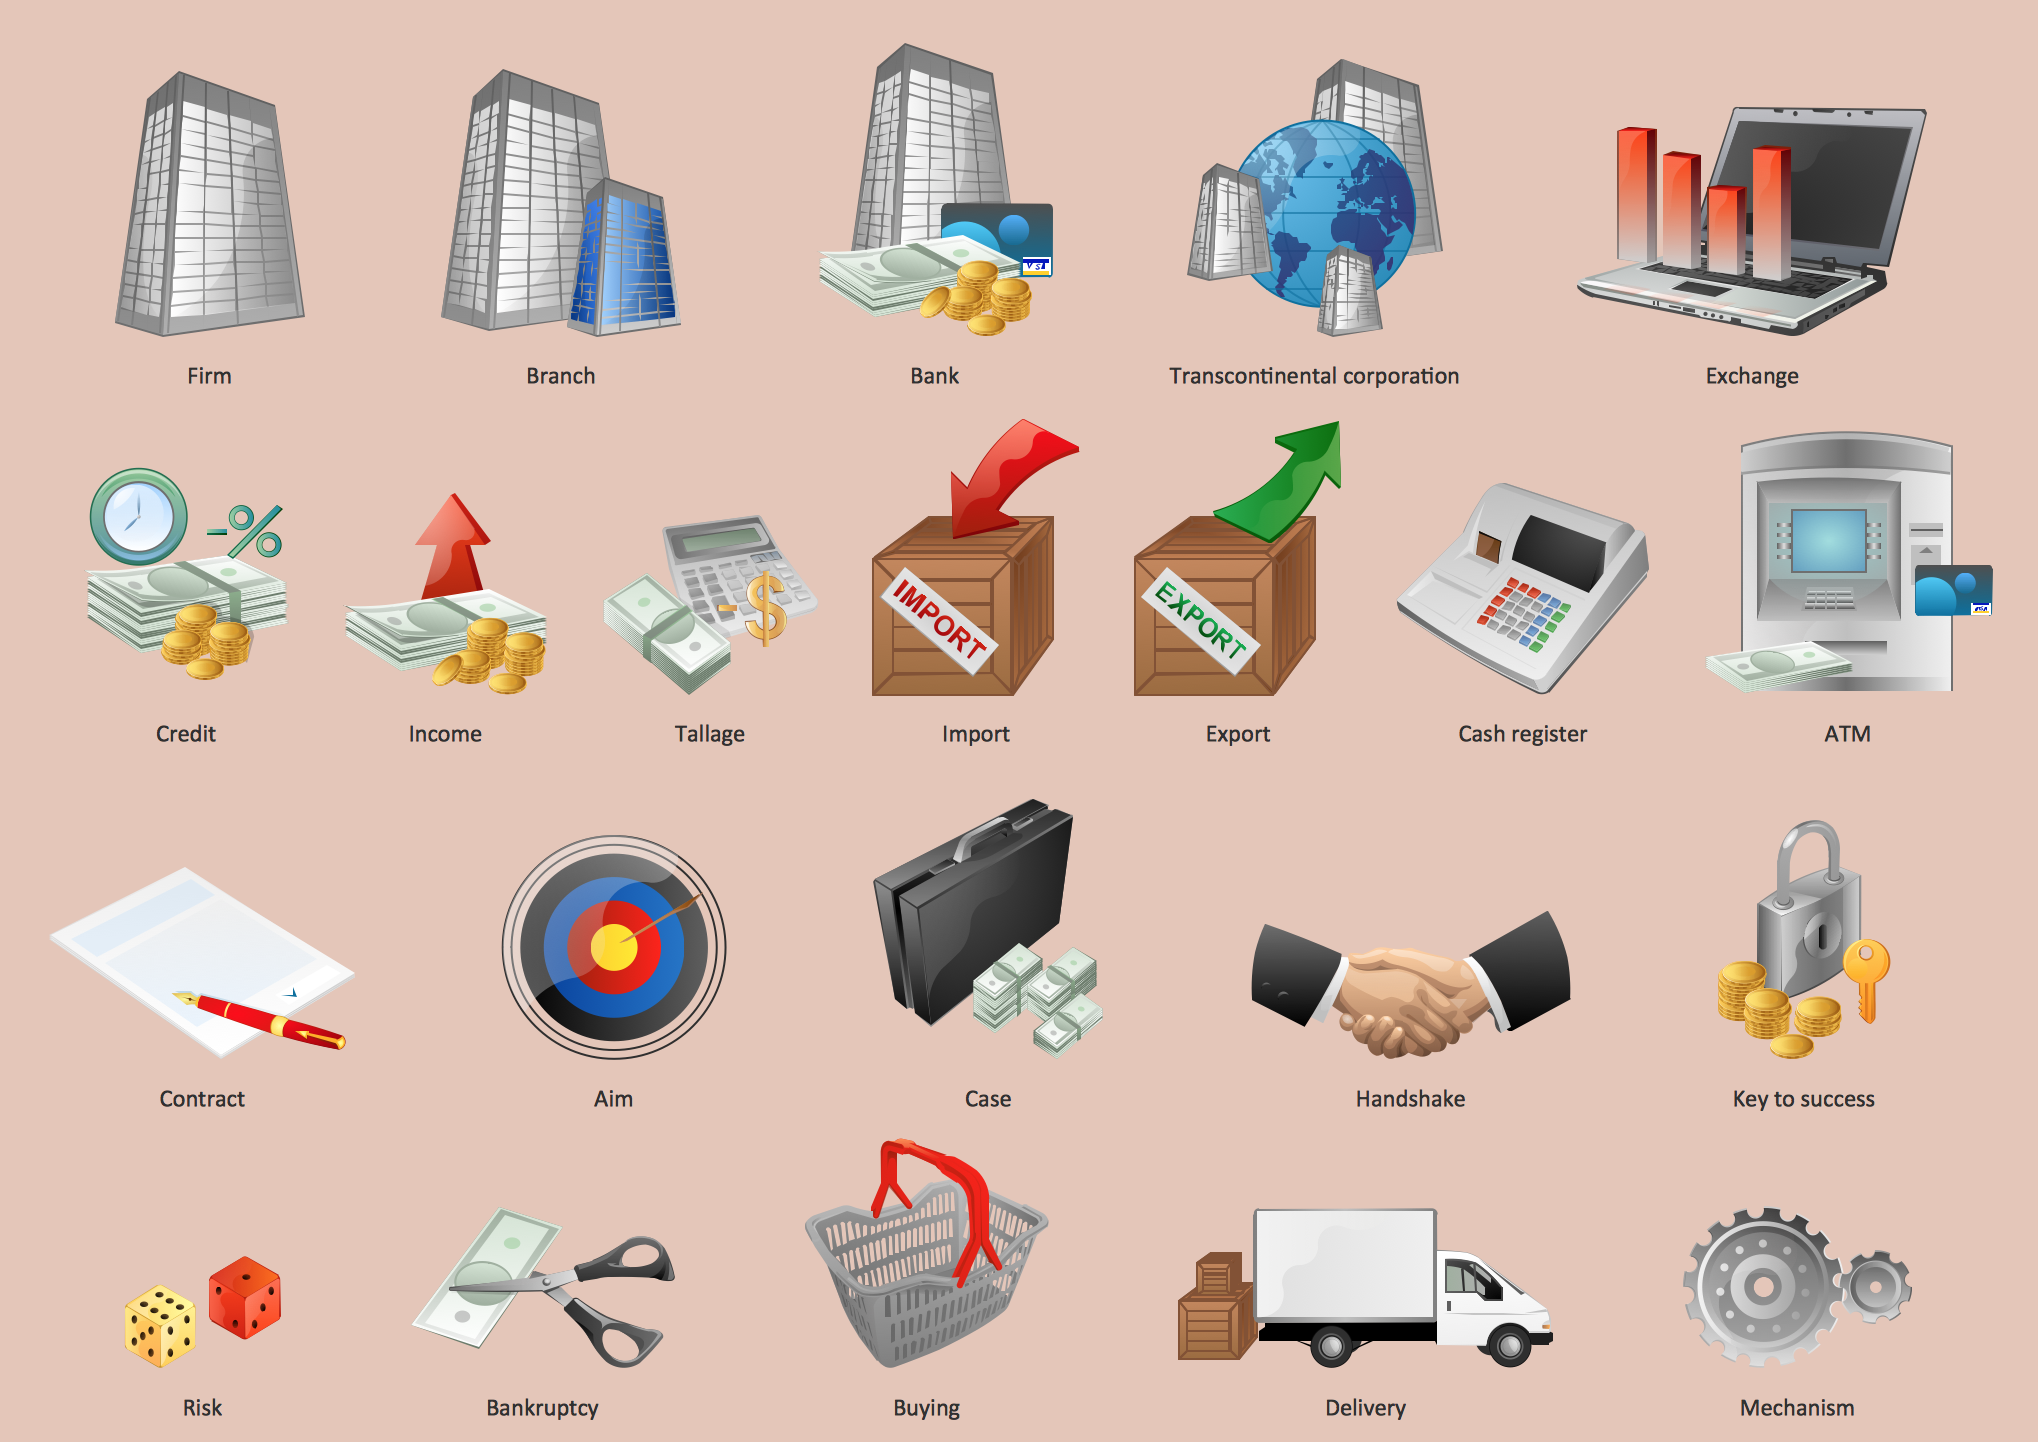
Pic.1 Business - Design Elements
See also Samples:
- Illustration - Aerospace and Transport
- Illustration - Artwork
- Illustration - Audio, video, media
- Illustration - Business and finance
- Illustration - Computers and communications
- Illustration - Manufacturing
- Illustration - Nature
- Illustration - People
- Illustration - Presentation clipart
- Illustration - Safety and security
- Science & Education — illustrations
TEN RELATED HOW TO's:
This sample was created in ConceptDraw DIAGRAM diagramming and vector drawing software using the Business Process Diagram Solution from the Business Processes area of ConceptDraw Solution Park. The Business Process Solution is based on the standard BPMN 2.0 and includes the set of libraries of ready-to-use objects.
Picture: BPR Diagram. Business Process Reengineering Example
Related Solution:
UML Activity Diagram illustrates the business and operational step-by-step workflows of components in a system and shows the overall flow of control. You can use the appropriate stencils of UML notation from UML Activity library with 37 objects. ConceptDraw is ideal for software designers and software developers who need to draw UML Activity Diagrams.
Use ConceptDraw DIAGRAM diagramming and vector drawing software enhanced with Rapid UML solution from ConceptDraw Solution Park to create your own UML activity diagrams that show the business and operational workflows of components and overall flow of control in your systems. Such software provides coloring UML diagrams for various purposes and simplifying work of the engineers.
Picture: UML Activity Diagram
Related Solution:
When you need to draw a professional management drawing, these management design elements, samples, templates and libraries with vector clip art for drawing the Marketing Illustrations. Conceptdraw symbols and signs you can use in your design for Strategic Management, Graphic Design, Planning implementation and more.
You can create and view impact analysis drawings from specific design elements to examine the tasks.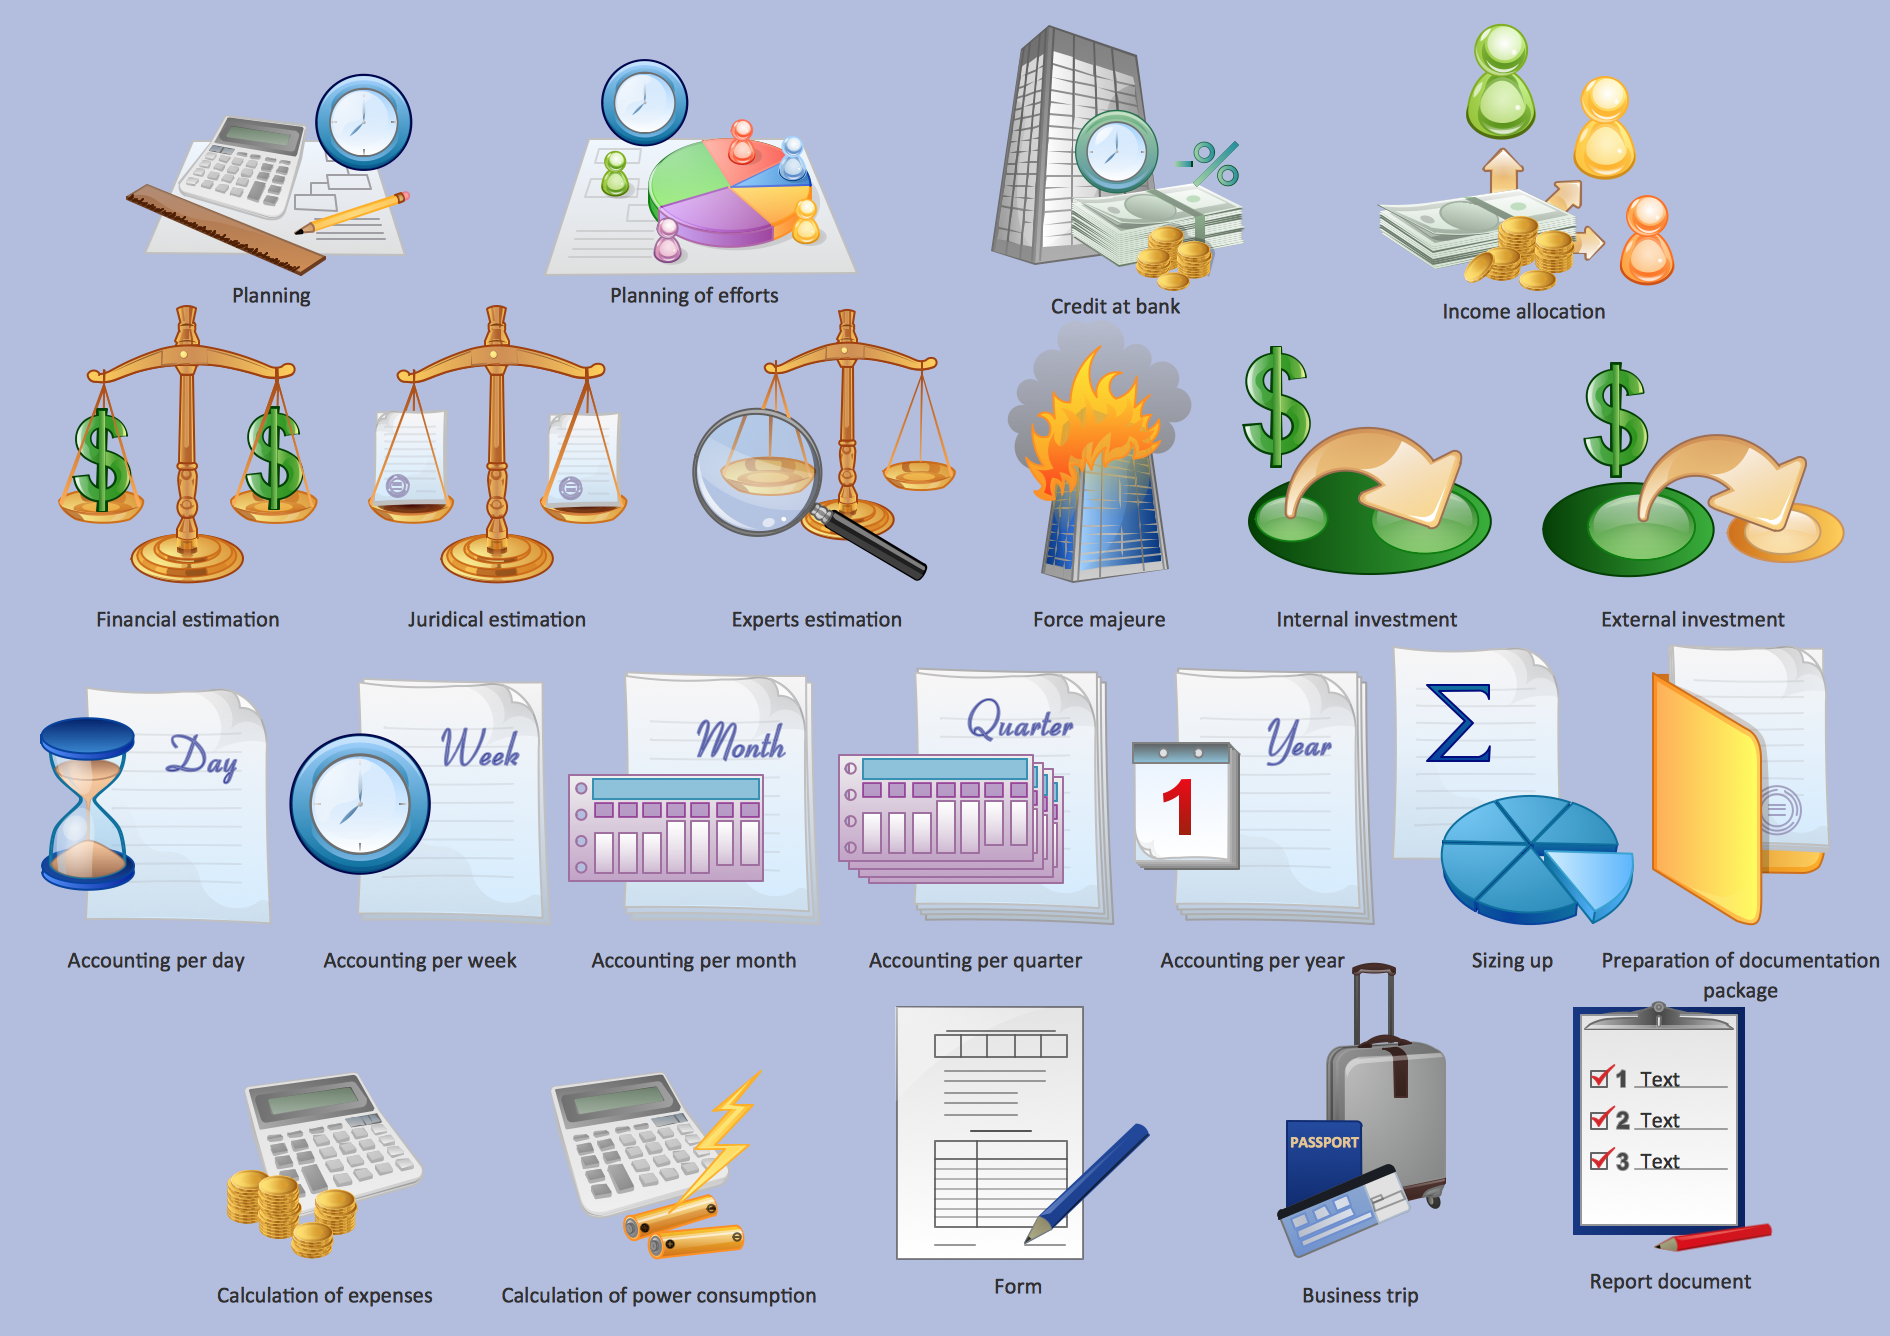
Picture: Management - Design Elements
Related Solution:
When thinking about data visualization, one of the first tools that comes to mind is a flowchart design. You can find flowchart symbols, shapes, stencils and icons easily on the Internet, but it might take time to systematize this information. Nevertheless, once you start flowcharting, you’ll love its simplicity and efficiency.
This diagram consists from standard flowchart symbols, approved by ANSI (American National Standard Institute) for drawing flowcharts. A flowchart is a diagram that represents a step-by-step algorithm of any process, displaying the process stages as boxes that are connected with arrows. Flowchart design makes it clear and readable.
Flowchart designed using ConceptDraw DIAGRAM flowchart software allows to make attractive and clear process presentation, it makes interpretation of the business process flow fresh and versatile. Great flowchart design view is a big advantage over the diagram created manually on a paper.
Picture: Flowchart Design: Principles, Layout, Symbols and Best Practices
Related Solution:
Few other areas benefited as much from the development of advanced digital drawing software as interior design. Previously only done by professionals, nowadays it is made available to virtually anyone with the help of software such as ConceptDraw DIAGRAM. You can design whatever you want - a living room, an office, a garage, a school layout - design elements provided by ConceptDraw DIAGRAM fit all of these purposes. All you need to get started is your creativity and the right software tools.
This library of vector graphic objects includes images of different school furniture and equipment related to school or training classes interior. These graphical elements are embedded into the ConceptDraw School and Training Plans solution. You can use them when designing interior layout of classroom or training office.Organization of the learning environment is an important element of a students learning. By using ConceptDraw DIAGRAM you can easily visualize and present your ideas related to any classes layout.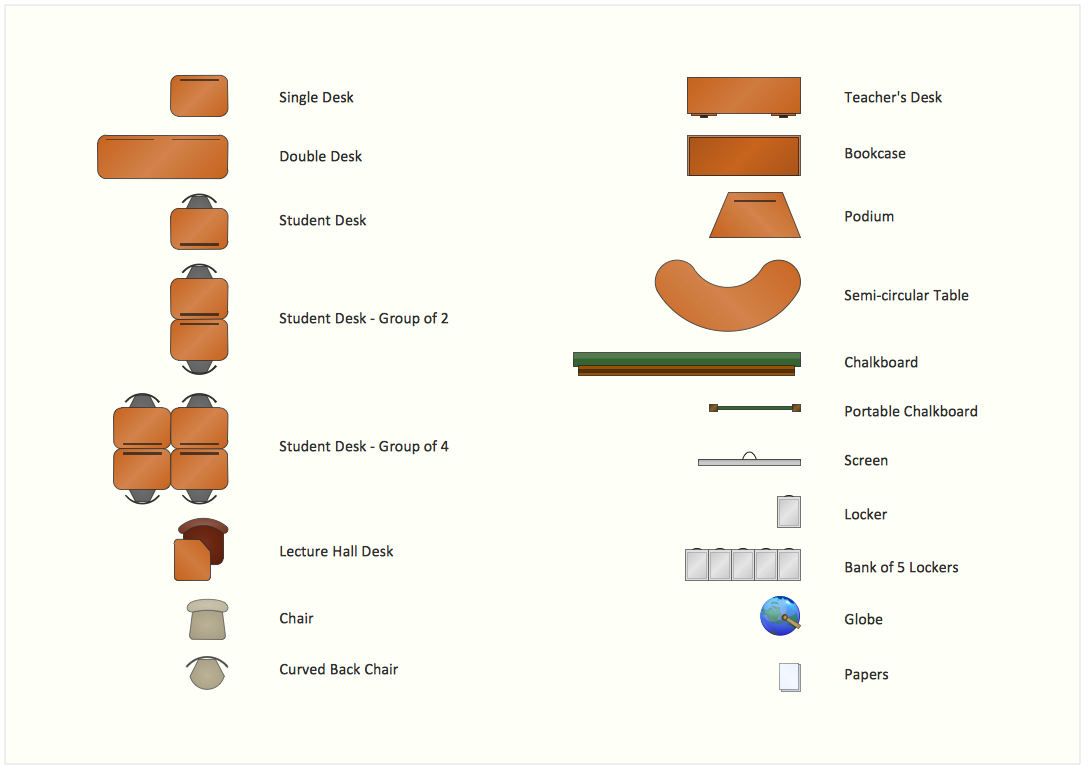
Picture: Interior Design. School Layout — Design Elements
Related Solution:
Flow diagrams is a diagram used for structuring complex system and visually representing a flow and interactions of elements in a system.
ConceptDraw DIAGRAM diagramming and vector drawing software enhanced with Flowcharts Solution from the Diagrams Area of ConceptDraw Solution Park is perfect for easy drawing professional looking Flow Diagrams.
For drawing Flow Diagrams the Flowcharts Solution provides: 2 libraries with commonly used predesigned vector objects - Flowchart library and Flowcharts Rapid Draw library; collection of Flow Diagrams samples; Basic Flowchart template.
Picture: Flow Diagrams
Related Solution:
Accounting Data Flow from the Accounting Flowcharts Solution visually describes the financial accounting process, shows the accumulated information about transactions and events for creating the balance sheet and the final income statement.
Accounting Flowcharts Solution contains also a wide variety of templates and samples that you can use as the base for your own Accounting Flowcharts of any complexity.
Picture: Accounting Data Flow from the Accounting Flowcharts Solution
Related Solution:
ConceptDraw DIAGRAM extended with Pictorial Infographics Solution from the “Infographics” Area is a powerful Infographic Software. Make sure in it right now!
Picture: Infographic Software
Related Solution:
Matrix organizational structure is one of the main forms of structures which is actively used by organizations to carry forth the functions of a company visually and effectively.
Now we have ConceptDraw DIAGRAM diagramming and vector drawing software extended with 25 Typical Orgcharts solution from the Management area of ConceptDraw Solution Park which will help easy represent matrix organizational structure of any degree of complexity.
Picture: Matrix Organization Structure
Related Solution:
6 sigma →
This mind map shows how Six Sigma methodology be represented as a mind map. Six Sigma is a quality management methodology allows reducing the number of defects to 3.4 defects per million.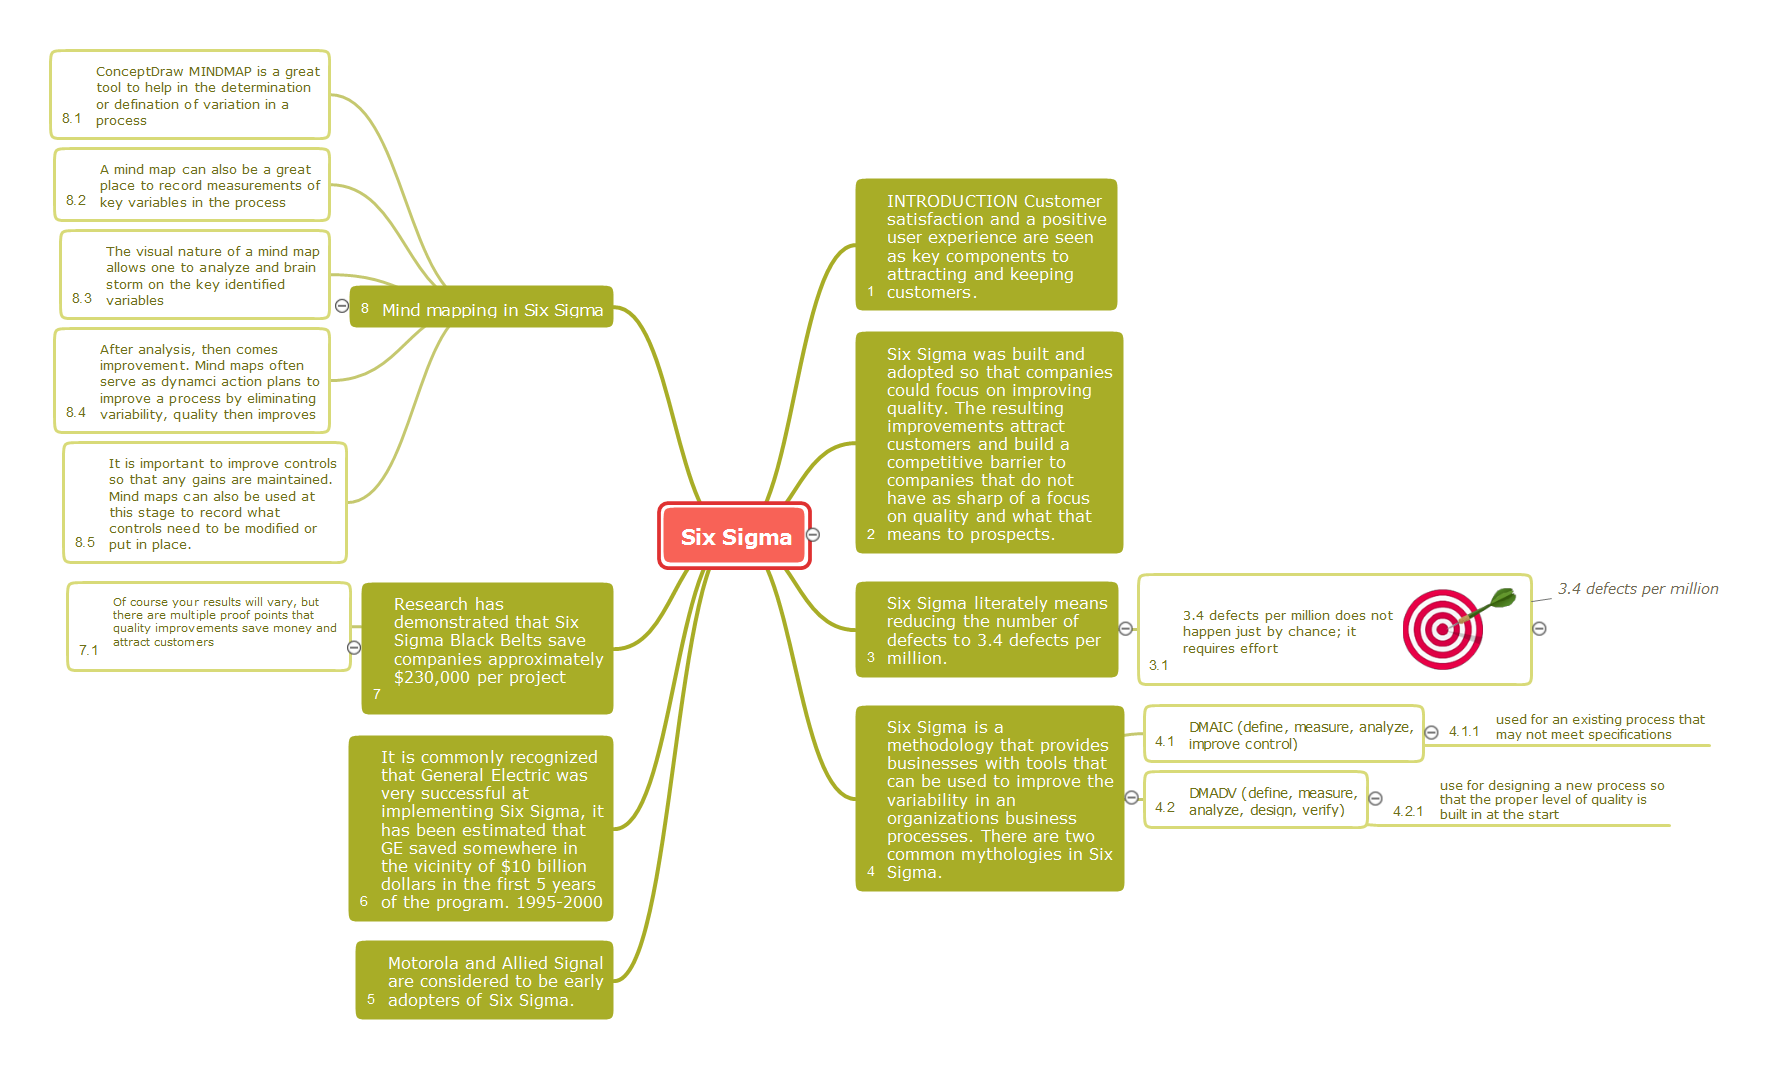
Picture: 6 sigma
Related Solution:
ConceptDraw
DIAGRAM 18