
ConceptDraw Rapid UML solution provides UML Activity Diagram library of vector stencils for activity diagram design elements like rounded rectangles of activities, diamonds of decisions, bars of the start (split) or end (join) of concurrent activities, black circle of the start (initial state) of the workflow, encircled black circle of the end (final state), etc.
Use UML Activity Diagram library to draw your own activity diagrams that show the business and operational stepwise workflows of components in your system.

All libraries for creating UML diagrams are available inside the ConceptDraw DIAGRAM Templates and samples are located in the Rapid UML section of ConceptDraw STORE.

TEN RELATED HOW TO's:
UML Communication diagramming software with rich examples and template. ConceptDraw is ideal for software designers and software developers who need to draw UML Communication Diagrams.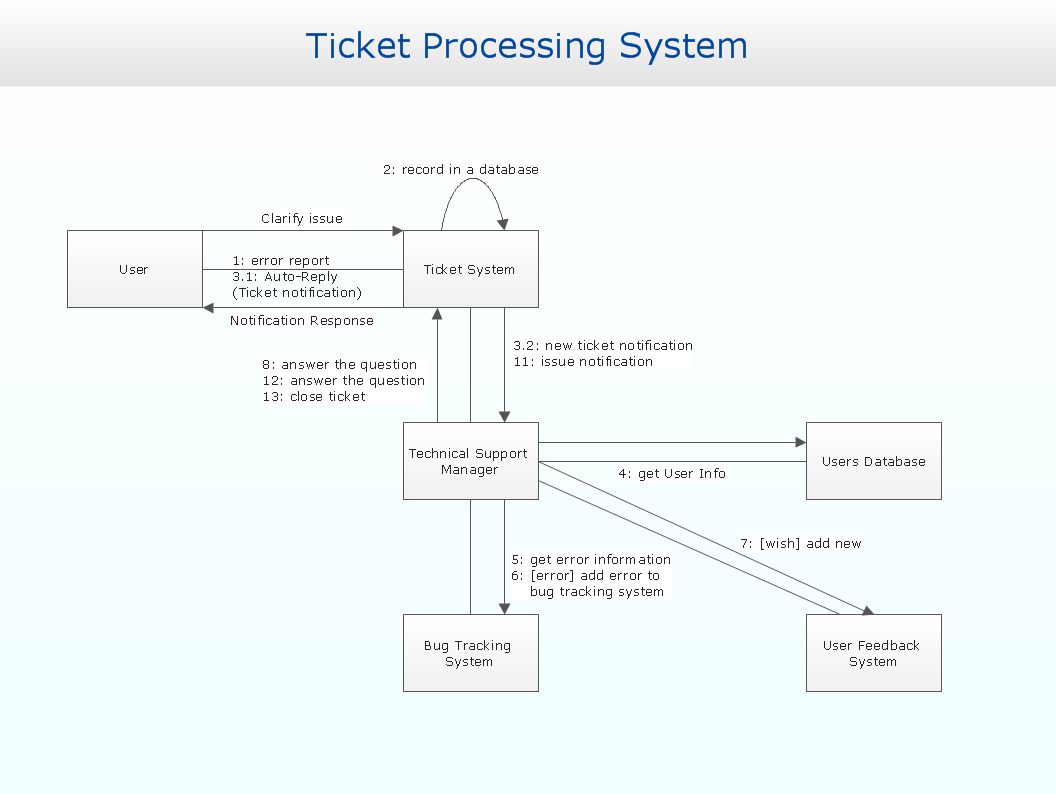
Picture: Communication Diagram UML2.0 / Collaboration UML1.x
A wireframe is a scheme of a future web page. Wireframe illustrates the web page structure, location and size of the main elements, as well as their interaction with the user. With such scheme designer defines the functionality of the page, not its appearance.
Picture: Wireframe Tools
Related Solution:
ConceptDraw DIAGRAM is a world-class diagramming platform that lets you display, communicate, and present dynamically. It′s powerful enough to draw everything from basic flowcharts to complex engineering schematics.
Video tutorials on ConceptDraw products. Try it today!
Picture: Business Process Mapping — How to Map a Work Process
Related Solutions:
ConceptDraw DIAGRAM is new software for business and technical drawing. Powerful business drawing tools, extensive libraries with pre-drawn shapes, free samples of business drawings, technical drawings and flowcharts, support of many graphic formats enable users to visually develop their business drawings charts and diagrams in any combination of drawings, diagrams and flow charts.
Picture: ConceptDraw DIAGRAM The best Business Drawing Software
Related Solution:
Describing a workflow or approval process can take hours and be too complicated, especially since there are options to do it quickly and vividly. Diagrams called flowcharts replace long paragraphs of boring text and represent information in a graphic way. You can draw one on paper or you can use flowchart software to do it quickly and scalable. This kind of software is easy to use and you don’t need any special skills to start using it. In addition, there are a lot examples and predesigned templates on the Internet.
Flowcharts are a best tool for staking out a huge and complex process into some small readable parts. Surely, flowcharts can be drawn manually but the use of standard symbols that make it clear for a wide audience makes a software tool preferred for this task. The core for a successful flowchart is its simplicity. That is why often before beginning making flowchart through software, people draw the sketch on a piece of paper. Designing an effective flowchart means the combination of the data needed to be shown and the simplicity with which you depict it.
Picture: Flowchart Software: A Comprehensive Guide
Related Solution:
How to draw a Process Flow Chart? It's very fast and easy to draw any Process Flow Chart using the tools of special Process Flow Chart software free.
Flowcharts Solution offers wide set of useful drawing tools, collection of samples, ready-to-use template and 2 libraries with predesigned vector elements which will help facilitate drawing process and designing professional looking process flow chart, process flow scheme, process block diagram, etc.
Picture: Process Flow Chart Software Free
Related Solution:
Drawing baseball diagrams using ConceptDraw DIAGRAM software extended with the Baseball solution saves your time, and adds more value to your work.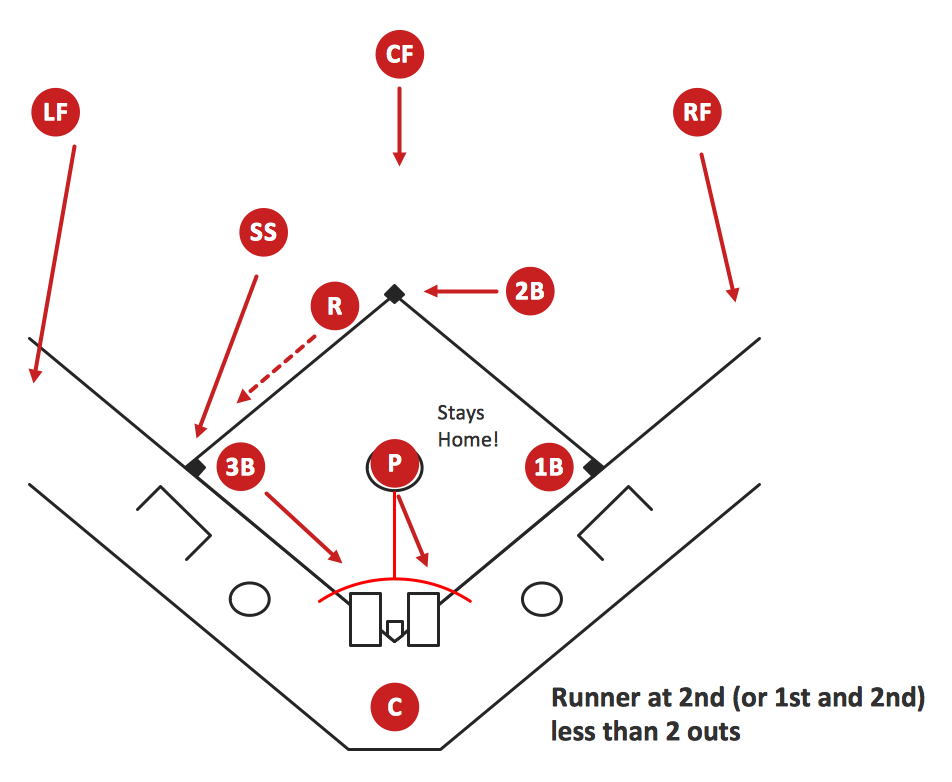
Picture:
Baseball Diagram
Basic Bunt Coverage – Runner at 2nd
Related Solution:
Boost your brand awareness and recognition through graphic design.
ConceptDraw DIAGRAM business graphics software provides wide opportunities for creativity and helps generate amazing visuals.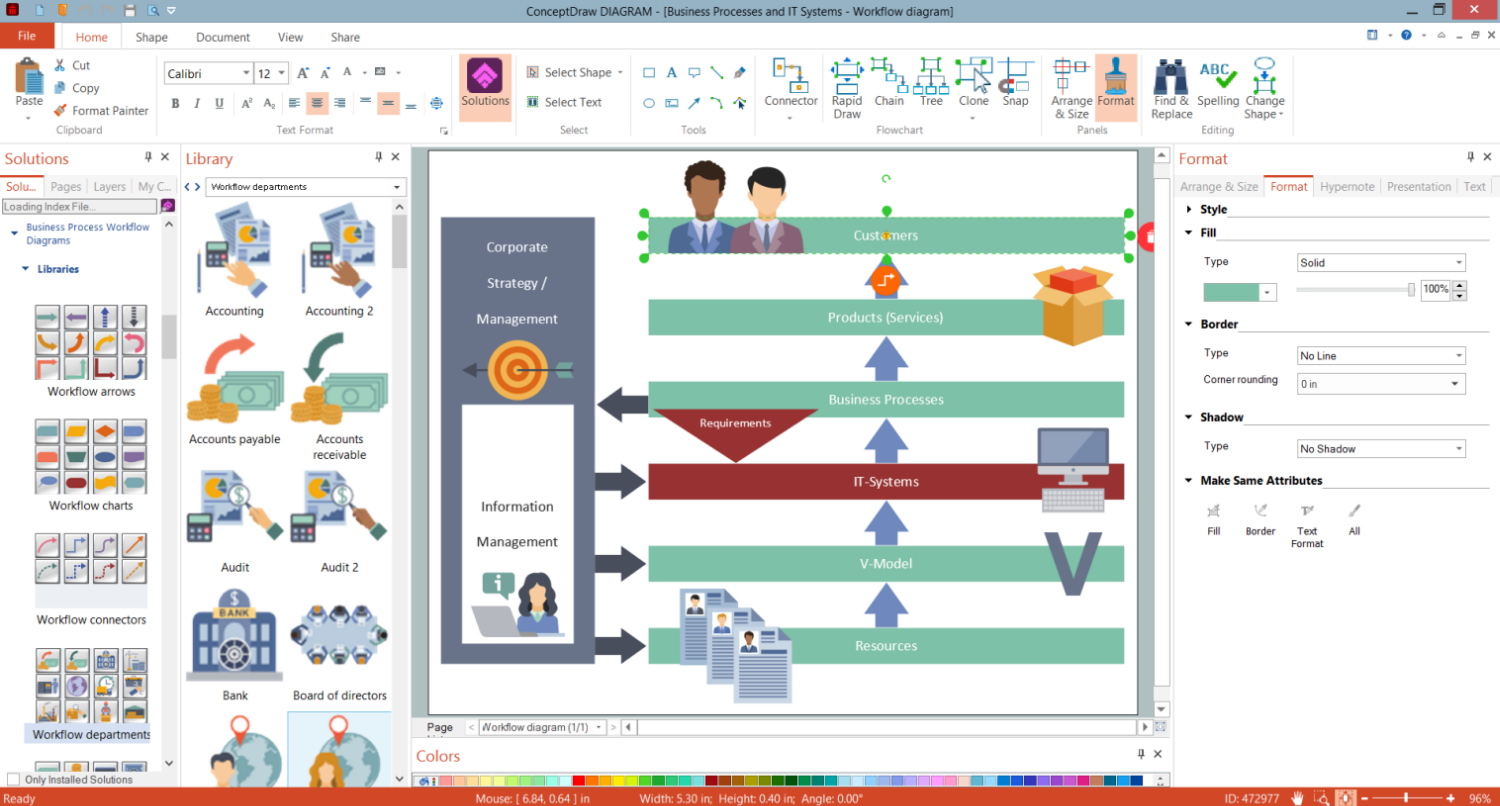
Picture: Business Graphics Software
UML Communication Diagram depicts the interactions between objects or parts in terms of sequenced messages and describes both the static structure and dynamic behavior of a system.
Picture: Diagramming Software for Design UML Communication Diagrams
ConceptDraw DIAGRAM extended with Seven Management and Planning Tools Solution from the Management Area of ConceptDraw Solution Park is the best software for drawing all types of diagrams from the Seven Management and Planning Tools: Affinity Diagram, Relations Diagram, Prioritization Matrix, Root Cause Analysis Tree Diagram, Involvement Matrix, PERT Chart, and Risk Diagram (PDPC).
Picture: PDPC
Related Solution:


