How To Create a Workflow Diagram
Using template
The fastest way to create a workflow diagram is using pre-designed template. ConceptDraw DIAGRAM with the Workflow Diagrams solution delivers rich set of workflow diagram templates you may start from.
ConceptDraw DIAGRAM is a professional diagramming software for drawing well-designed diagrams. With the Workflow Diagrams solution that contains vector library objects, samples, and template. One can start from opening template and then put in the page needed objects and connecting they with arrows.
How to Create a Basic Workflow Diagram
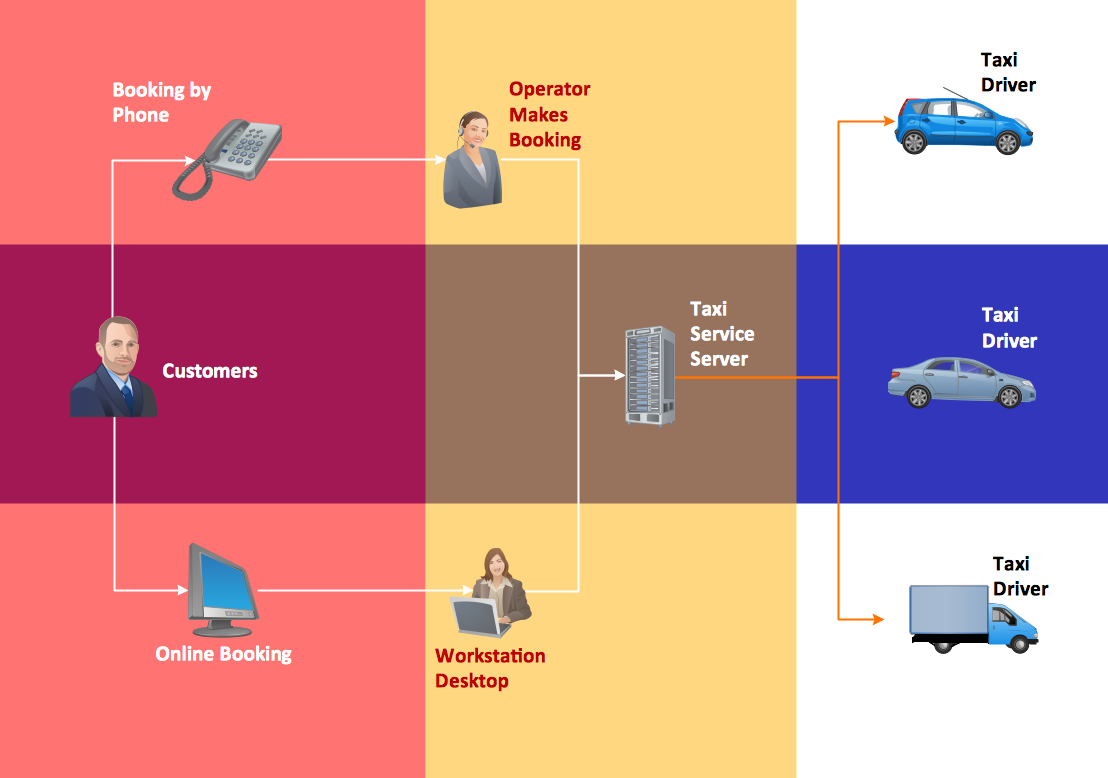
Pic.1 Workflow diagram sample: Taxi service.
This example shows a presentation-ready workflow chart or workflow diagram that clearly illustrates how a taxi service works.
See also Samples:
- Business Process Diagrams — Workflow Diagram
- Business Process Flow Diagrams
- BPMN - Business Process Modeling Notation (Process Flow Diagram)
- Flow Charts
- UML - (Professional Process Flow Diagram using UML notation)
TEN RELATED HOW TO's:
The Total Quality Management Diagram solution helps you and your organization visualize business and industrial processes. Create Total Quality Management diagrams for business process with ConceptDraw software.
Picture: TQM Software — Build Professional TQM Diagrams
Related Solution:
Need to draw a diagram, process chart, flowchart, organizational chart, graphic design? ConceptDraw can help you to make professional graphic documents quickly.
Picture: Best Diagramming
Related Solution:
To draw a good diagram of a business workflow you should have a ready-to-use set of pre-designed objects you may drag-and-drop to your document focusing on the workflow structure and meaning, not drawing tools. ConceptDraw DIAGRAM with Workflow Diagrams solution provides complete set of design element you may use to draw a good diagram of a business workflow.
Picture: How to Draw a Good Diagram of a Business Workflow?
Related Solution:
Event-Driven Process Chain Diagrams is using for improvement throughout an organisation.
ConceptDraw DIAGRAM - software that reduces the time needed to create a EPC diagrams.
Picture: The Building Blocks Used in EPC Diagrams
Related Solution:
Diagrams are a very important part of modern life. With the help of flow diagram software, a lot of companies can promote their ideas at the market. Its usefulness is totally doubtless.
This is a flow chart of the invoice payment flow. This flowchart details decrypts all stages of the process of obtaining and paying bills. It is a description of the universal process - such steps performs accounting departments of almost any organization. Since every business no matter what it does is a consumer of some goods or services. The given flow chart was made using ConceptDraw DIAGRAM software and the Diagrams solution for making flowcharts of any kind.
Picture: Flow Diagram Software
Related Solution:
If you ever wanted to try any diagramming tools except of Visio, but were afraid to lose existing documents, there’s good news for you. One of the most striking features of ConceptDraw DIAGRAM is it’s perfect compatibility with MS Visio, which guarantees that you won’t depend on operating system anymore, because another ConceptDraw DIAGRAM feature is that it’s cross-platform tool. Don’t waste your time looking for other options, you’ve found the solution already!
Business professionals often utilize the MS Visio as a common tool for making various issues on business visualization. MS Visio is a strong software with good capacity to maintain complex business solutions. But there is no MS Visio for Apple OS X. This is a large invocation, and one would be pleased to recognize that ConceptDraw DIAGRAM is the ideal alternative to MS Visio. Primarily, because this software works natively on both Windows and Apple OS X platforms. if you have migrated from Windows to Mac, or need to communicate in a cross-platform conditions, you’ll search for MS Visio replacer. ConceptDraw DIAGRAM is the exclusive professional business diagramming application that runs on both Windows and Apple OS X. The opportunity exchange files between PC and Mac, as well as between ConceptDraw DIAGRAM and Visio is the significant advantage that permits you to display and to collaborate business information in effortless and cost-effective way.
Picture: ConceptDraw DIAGRAM Compatibility with MS Visio
Network infrastructure planning is a very important process in the network construction, and the share of time allocated to this within the scope of the entire project may reach 60-80%. A competent and thorough approach to planning contributes to the quick investment return, and also increases the reliability and flexibility of the final system, reducing the probability of additional costs related to the incorrect implementation.
Any planning begins with an analysis of the business requirements to the final system. Basic network parameters, which should be assessed are the scalability, accessibility, cost, speed and safety.
Speed and cost are often mistaken for the most important parameters, and the rest of the parameters aren't even remembered. This is not entirely correct. Initially, it is necessary to assess the business plans for the future, because sometimes it is more profitable to invest more money in the beginning. If the business is to develop, then, consequently, demands on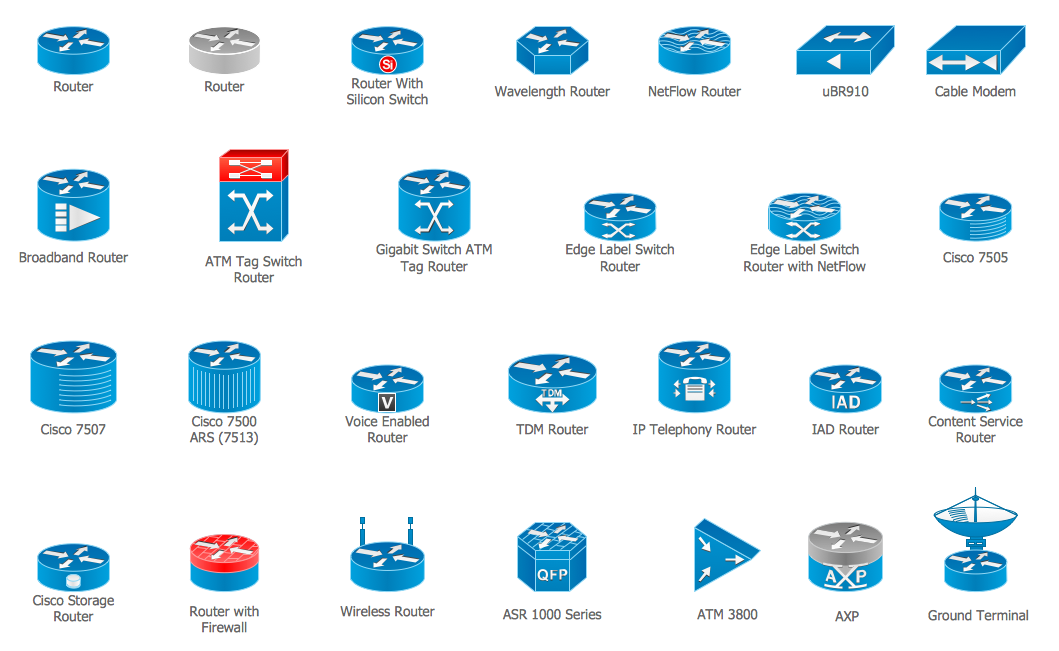
Picture: Cisco Routers. Cisco icons, shapes, stencils and symbols
Related Solution:
This sample shows computer network diagram of the hotel service process, structure of the hotel service departments and the connection of each department to the internet using the WLAN equipment (routers, hub. etc.).
This sample was created in ConceptDraw DIAGRAM diagramming and vector drawing software using the Computer and Networks solution from Computer and Networks area of ConceptDraw Solution Park.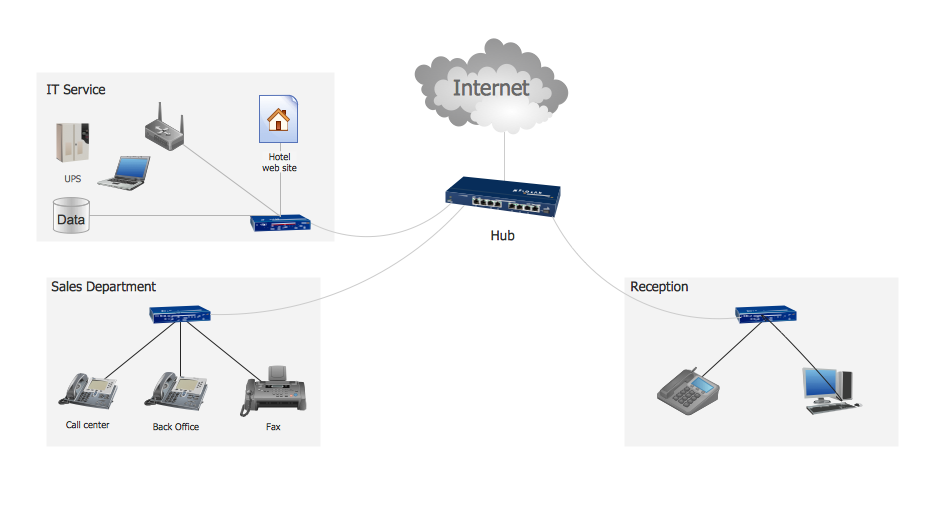
Picture: Hotel Service Process
Related Solution:
Also included are standardized hr flowchart symbols, meaning your diagrams will be relevant and understood by all business associates.
Picture: HR Flowchart Symbols
Related Solution:
ConceptDraw has several examples that help you to start using software for designing UML Use Case Diagrams.
Picture: UML Use Case Diagrams
ConceptDraw
DIAGRAM 18