Made with
ConceptDraw
DIAGRAM 18

UML Class Diagram. Design Elements

UML Class Diagram is a type of Structure Diagrams that shows the classes of a system, attributes, operations, and the relationships between them.

Class Diagram is one of important types of UML Diagrams. UML Class Diagrams are used for static modeling of the system, for data modeling, for conceptual modeling of the application, and for modeling of the system dictionary.

On the Class Diagram, Classes are represented as boxes that consist of three parts: name, attributes of the class, and operations or methods.

Use the following notations to set the visibility of a class member: Public (+), Private (-),
Protected (#), Derived (/), Static (_), Package (~). Notation must be placed before the name of class member.

There are a few types of associations between objects and classes on the Class Diagrams.

Bi-directional associations are represented by a line between two classes, it is default connection between classes.

Uni-directional associations are represented as the unbroken lines with an open arrowhead.

Aggregation is an association with the relation between the whole and its parts, and is represented as empty diamond on the Class Diagram.

Composition is a strong variant of aggregation, represents on as filled diamond.

Generalization or inheritance is when a child object or class assumes all properties of his parent object or class, is represented as empty triangle.

There are four notations: 0..1, 1, 0..*, 1..*, that indicate the multiplicity of associations.

The Rapid UML Solution for ConceptDraw DIAGRAM contains 13 vector stencils libraries with 393 interactive shapes that you can use to design your UML diagrams.

To design your own Class Diagram use the UML Class Diagram library.

UML Class Diagram library contains 39 shapes:

  • Class
  • Class 2
  • Object 1
  • Object 2
  • Self association
  • Interface
  • Template class
  • NARY
  • Text Label
  • Symbol { }
  • Symbol << >>
  • Divider (Vertical)
  • Divider
  • Association without ratio
  • Association
  • Association One-to-Many
  • Association Many-to-Many
  • Association One-to-One
  • Inheritance
  • Composition
  • Aggregation
  • Inheritance
  • Dependency
  • Connector
  • Package
  • Frame, fragment
  • Note
  • Callout
  • Component
  • Interface 2
  • Realization
  • Generalization
  • UML Connector (Direct)
  • UML Connector
  • UML Connector (opposite)
  • UML Connector (opposite direction)
  • Association (without aggregation)
  • Note Connector

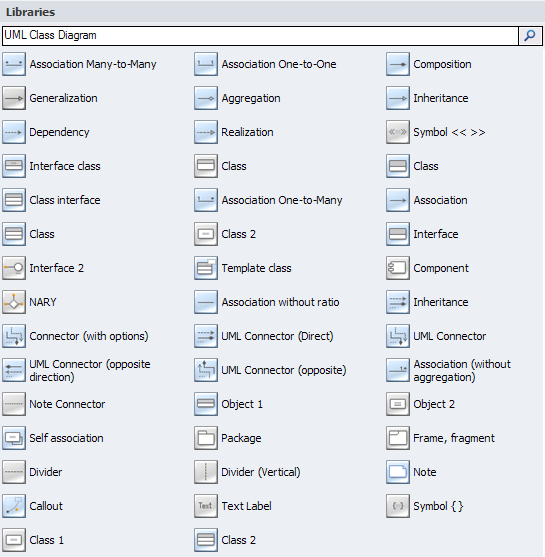
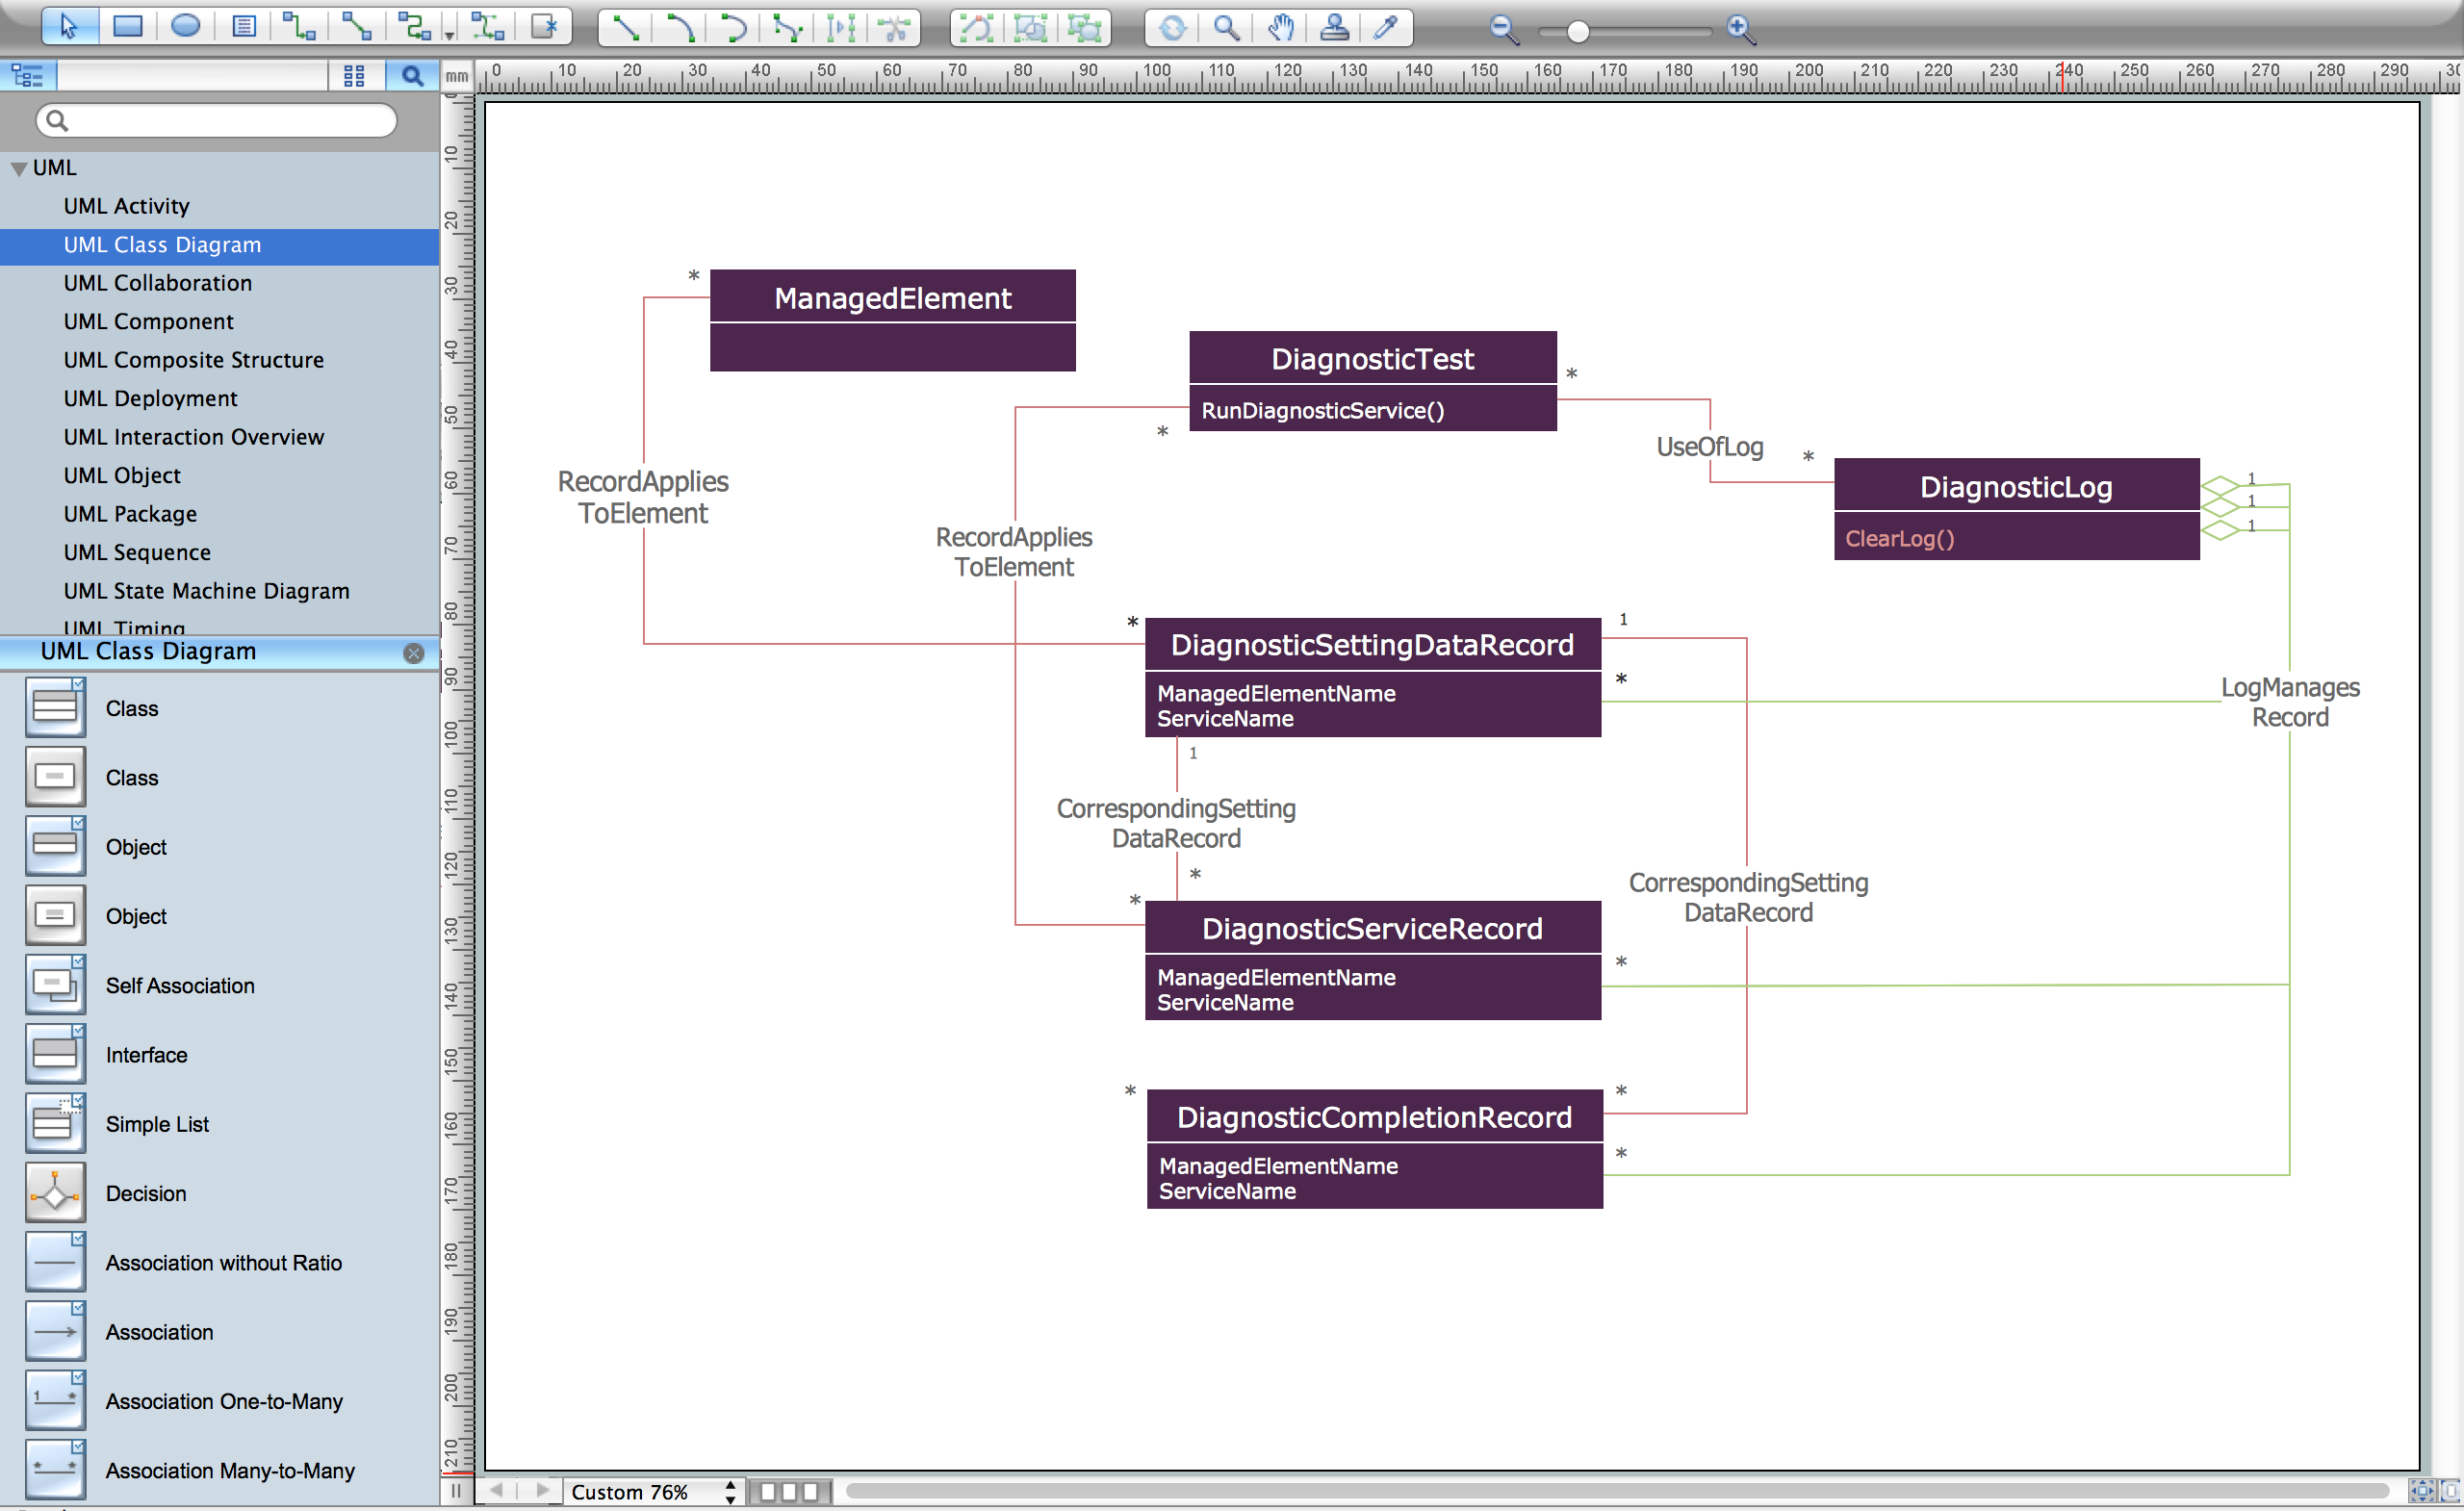
Pic.1. UML Class Diagram Library

UML Class Diagram. Design Elements *

Pic.2. UML Class Diagram Library Elements

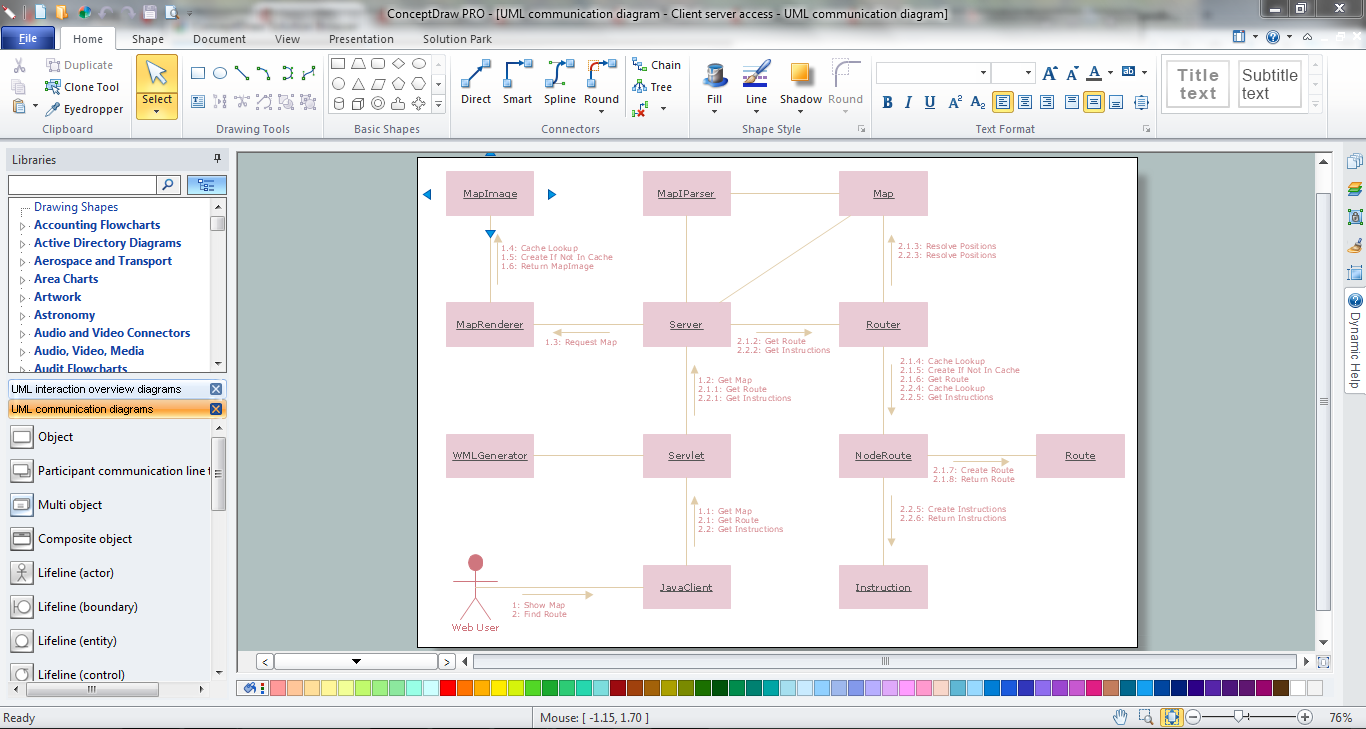
ConceptDraw Rapid UML solution provides UML Class Diagram library of vector stencils for drawing the class diagrams using class blocks and assembly connectors.

All libraries for creating UML diagrams are available inside the ConceptDraw DIAGRAM Templates and samples are located in the Rapid UML section of ConceptDraw STORE.

UML Diagram Solution

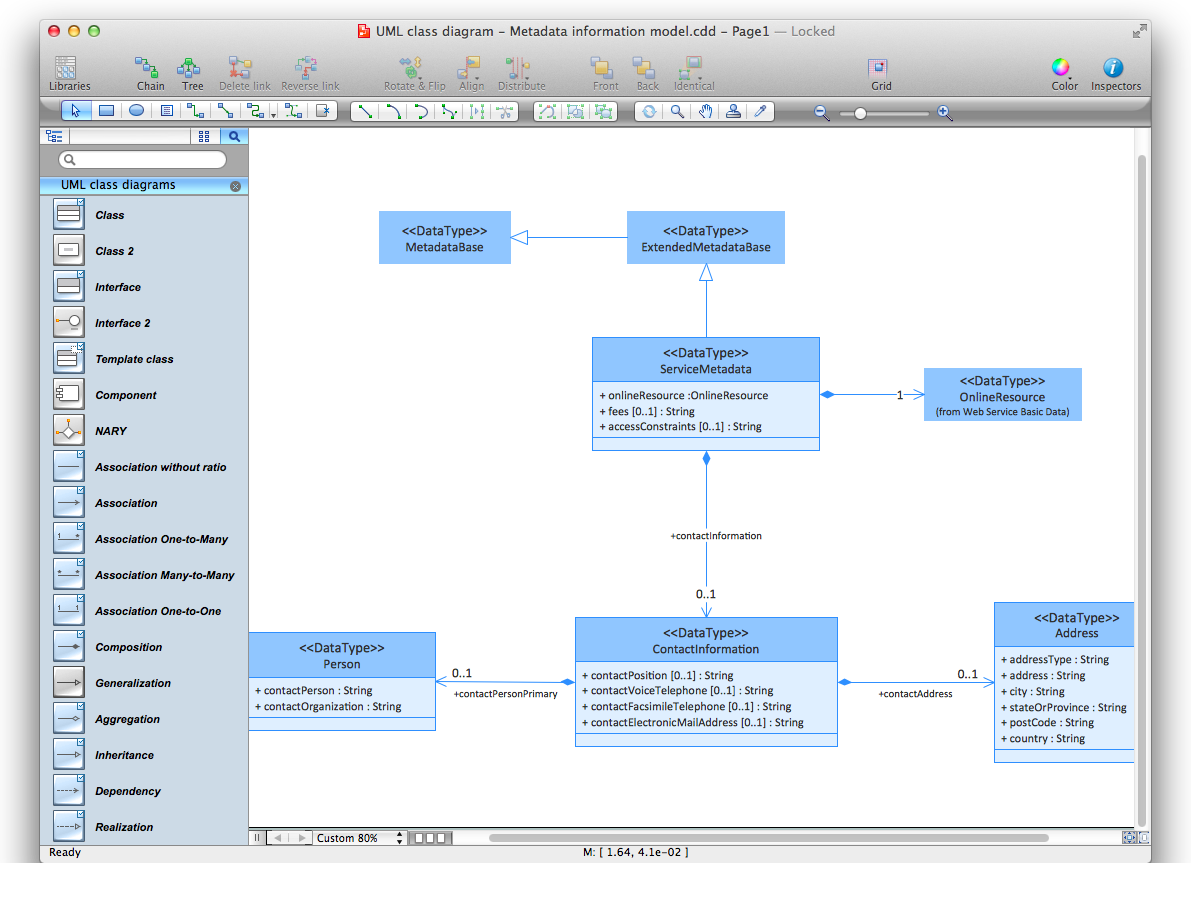
Pic.3. UML Diagrams solution

Use design element from the UML Class Diagram library to draw your own UML class diagrams of complex systems and software applications.

UML Class Diagram

UML Class Diagram


TEN RELATED HOW TO's:
UML Communication diagramming software with rich examples and template. ConceptDraw is ideal for software designers and software developers who need to draw UML Communication Diagrams.Communication Diagram UML2.0 / Collaboration UML1.x *
Picture: Communication Diagram UML2.0 / Collaboration UML1.x
UML Component Diagrams are used to illustrate the structure of arbitrarily complex systems and illustrates the service consumer - service provider relationship between components.UML Component Diagram *
Picture: UML Component Diagram
A network diagram represents the set of computers and network devices and the connections among them. This scheme can be developed for any institution or establishment. To illustrate this concept let’s take for example, a hotel network topology diagram or a school network diagram. These diagrams depict access points, servers, workstations, firewalls and another equipment needed to provide a network. On this masterpiece drawing one will see a simple scheme a of connecting computers together. Such form of connecting can be applied for a hotel, guest house, bungalow, hut or something else. This diagram shows the images of the real LAN components. So, it represents a physical category of a network construction. It looks similar to a star - so this network configuration is named a star topology. The typical feature of this construction is a center point - usually it is hub, or router. The rays of this star means network connections. Computers, peripherals and other network details are placed on the ends of the star rays.Hotel Network Topology Diagram *
Picture: Hotel Network Topology Diagram
Related Solution:
This sample was created in ConceptDraw DIAGRAM diagramming and vector drawing software using the UML Sequence Diagram library of the Rapid UML Solution from the Software Development area of ConceptDraw Solution Park. This sample shows the interactions of the customer with the system and is used at the registration on the sites.UML Sequence Diagram Example. SVG Vectored UML Diagrams Tools *
Picture: UML Sequence Diagram Example. SVG Vectored UML Diagrams Tools
Related Solution:
The ConceptDraw Flowchart component includes a set of samples and templates. This geathered as flowchart maker toolbox which focused on drawing flowcharts of any industry standards.Flowchart Components
Picture: Flowchart Components
Related Solution:
Business graphic applications show a special knowledge representations and include many features for creating schematic pictures. These graphic tools are known as flowchart maker or flowchart maker software.Flowchart Maker
Picture: Flowchart Maker
Related Solution:
IT world is extremely rational and logical. So what can be more precise than Software Diagrams to rate the results of work? Visual statistics is the best way to understand the data. This figure demonstrates the data flow diagram (DFD), which was created to describe the electronic system of custom purchase. This is the process of buying using electronic bar code scanning system. Such systems are used in large stores. The cashier scans the bar code, the system outputs the data on the price of the goods and carries out a purchase process. This DFD utilizes the Gane/Sarson notation. To create it The ConceptDraw DFD solution has been applied.Software Diagrams
Picture: Software Diagrams
This example shows the OOSE method. It was created in ConceptDraw DIAGRAM diagramming and vector drawing software using the Rapid UML Solution from the Software Development area of ConceptDraw Solution Park.Examples for OOSE Method *
Picture: Examples for OOSE Method
Related Solution:
Data flow diagrams are the graphical tool, used in the visualization of data flow of some data processing systems. It is the valuable process modeling tool. Also designing DFD is the important component of the initial part of any information system development project. The standard symbols are used to represent the interaction of a system components and how various kinds of components influence on data flow. The ConceptDraw Data Flow Diagrams solution is design to assist professional software engineers in making DFDs according to Gane and Sarson, and Yourdon and Coad notations. Do you imagine yourself as a successful IT specialist? To your mind, they all use data flow diagram examples to learn and to get inspired. Aren’t you still with us?Data Flow Diagram Examples *
Picture: Data Flow Diagram Examples
Related Solution:
You need design a Bank UML Diagram? Now, thanks to the ConceptDraw DIAGRAM diagramming and vector drawing software extended with ATM UML Diagrams Solution from the Software Development Area, you can design without efforts any type of Bank UML Diagram you want - Class, Activity, Communication, Component, Composite structure, Deployment, Interaction overview, Object, Package, Profile, Sequence, State machine, Timing, Use case.Bank UML Diagram *
Picture: Bank UML Diagram
Related Solution:
ConceptDraw
DIAGRAM 18