Using the libraries of the Rapid UML Solution for ConceptDraw DIAGRAM you can create your own visual vector UML diagrams quick and easy.
TEN RELATED HOW TO's:
It is easy to recreate any informational system structure using diagrams. There are three main components of any ER diagram: entity, attribute and relationship. Basing on these three components, one can define other, less used elements, such as weak entity or relationship, derived attribute, recursive relationship etc.
This is the set of graphic elements of ERD Chen's notation. This ERD notation is used to represent an entity–relationship models. It involves the set of geometric forms: rectangles - depicting entities, ovals - representing attributes and diamonds depicting relationships assigned for first-class objects, that can have relationships and attributes of their own. Connections are displayed with arrowed lines. It is known that the Chen's ERD notation is used to show a detailed view of entities and relationships. ConceptDraw Entity-Relationship Diagram solution from the Software Development section of Solution Park provides the ability to create ERD of database structure for software development purposes using the Chen’s notation elements.
Picture: Components of ER Diagram
Related Solution:
UML Apartment Plan. This sample was created in ConceptDraw DIAGRAM diagramming and vector drawing software using the UML Class Diagram library of the Rapid UML Solution from the Software Development area of ConceptDraw Solution Park.
This sample show the detailed plan of the apartment and is used by building companies, design apartments, real estate agencies, at the buying / selling of the realty.
Picture: UML Class Diagram Example - Apartment Plan
Related Solution:
The use case diagram (behavior scenarios, precedents) is the initial conceptual representation of the system during its design and development. This diagram consists of actors, use cases and relationships between them. When constructing a diagram, common notation elements can also be used: notes and extension mechanisms.
This sample was created in ConceptDraw DIAGRAM diagramming and vector drawing software using the UML Use Case Diagram library of the Rapid UML Solution from the Software Development area of ConceptDraw Solution Park.
This sample shows the types of user’s interactions with the system and is used at the registration and working with the database system.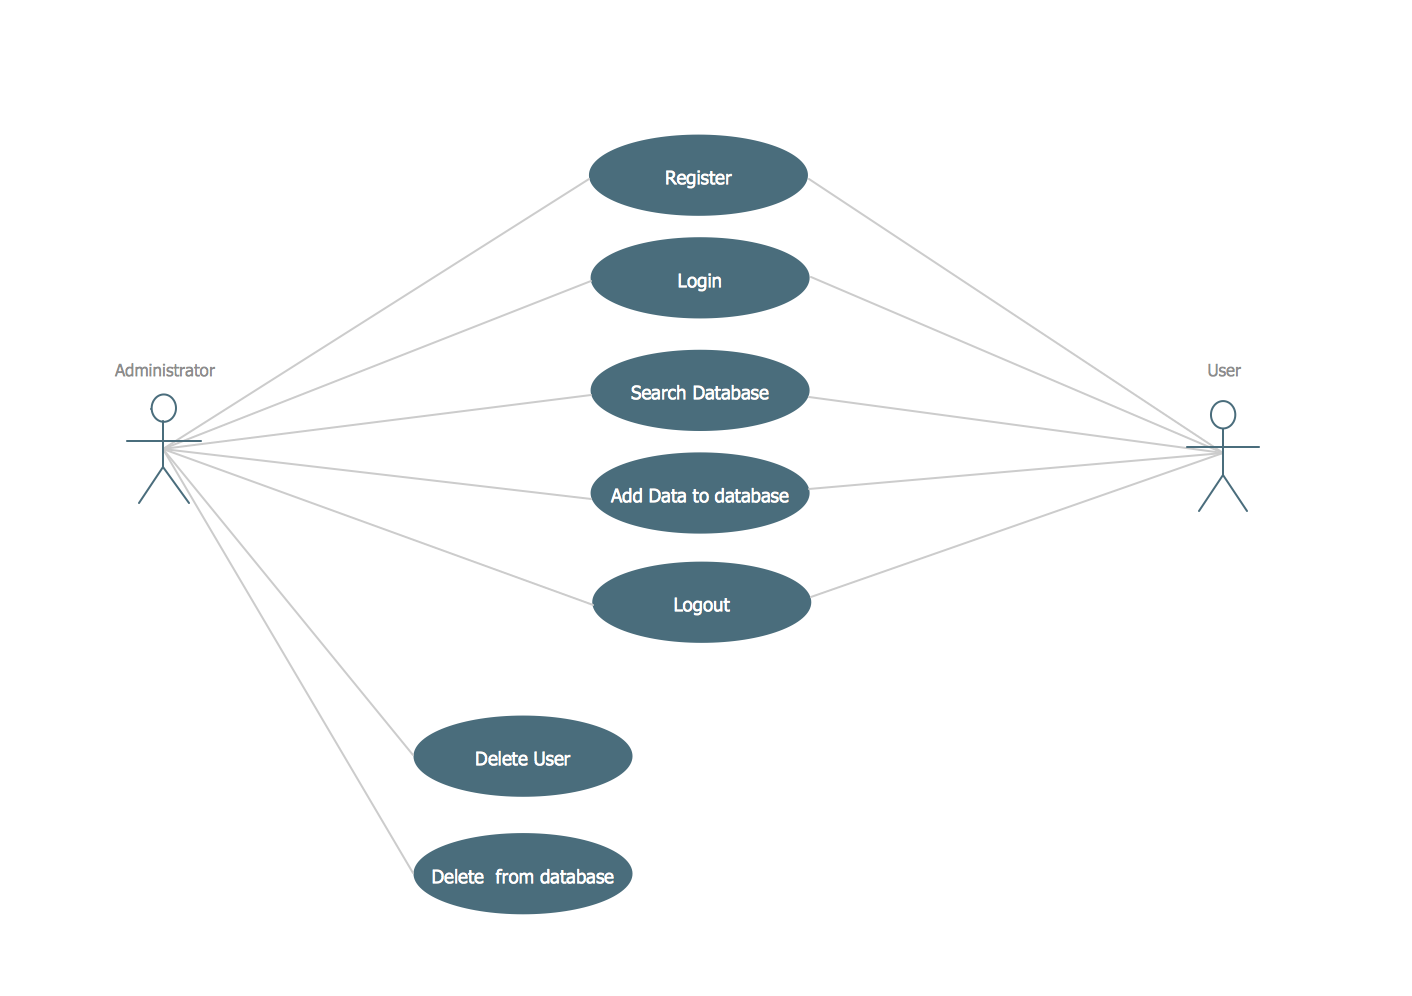
Picture: UML Use Case Diagram Example. Registration System
Related Solution:
The vector stencils library Activity diagrams from the solution Rapid UML contains specific data modeling symbols for ConceptDraw DIAGRAM software.
Picture: Data Modeling Diagram
When it comes to system construction, a class diagram is the most widely used diagram. UML Class Diagrams is a type of static structure diagram that is used for general conceptual modeling of the systematics of the application. Such a diagram would illustrate the object-oriented view of a system. The object orientation of a system is indicated by a class diagram. It describes the structure of a system by showing the general issues,classes of a system, attributes, operations, interfaces, inheritance, and the relationships between them.
Picture: UML Class Diagram Notation
Related Solution:
UML Collaboration Diagram depicts the interactions between objects or parts in terms of sequenced messages and describes both the static structure and dynamic behavior of a system.
Rapid UML solution provides templates, examples and libraries of stencils for quick and easy drawing all the types of system and software engineering diagrams according to UML 2.4 and 1.2 notations.
Picture: UML Collaboration Diagram (UML2.0)
Related Solution:
Easy charting software comes with beautiful chart templates and examples. This makes it easy to create professional charts without prior experience.
Graphs and Charts Area provide a wide collection of professional looking predesigned templates, samples and ready-to-use vector stencils that will help you to draw the charts and diagrams of various types: Pie Charts, Donut Charts, Line Charts, Column Charts, Bar Charts, Pyramids, Scatter Charts, Venn Diagrams, Spider Charts, Area Charts, Divided Bar Graphs.
Picture: Chart Software for Better Presentations
Related Solution:
This sample was created in ConceptDraw DIAGRAM diagramming and vector drawing software using the UML Class Diagram library of the Rapid UML Solution from the Software Development area of ConceptDraw Solution Park.
This sample shows the transport protocol mappings for SNMP (Simple Network Management Protocol), the classes of the transport system and relationships between them and is used in IP network.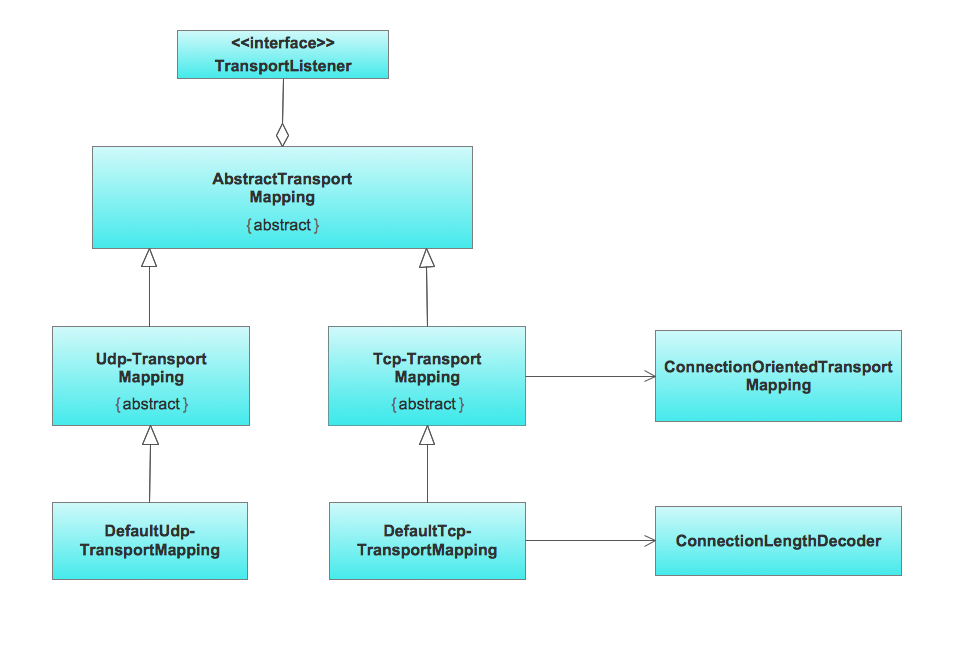
Picture: UML Class Diagram Example for Transport System
Related Solution:
The ConceptDraw vector stencils library Cisco Multimedia, Voice, Phone contains equipment symbols for drawing the computer network diagrams.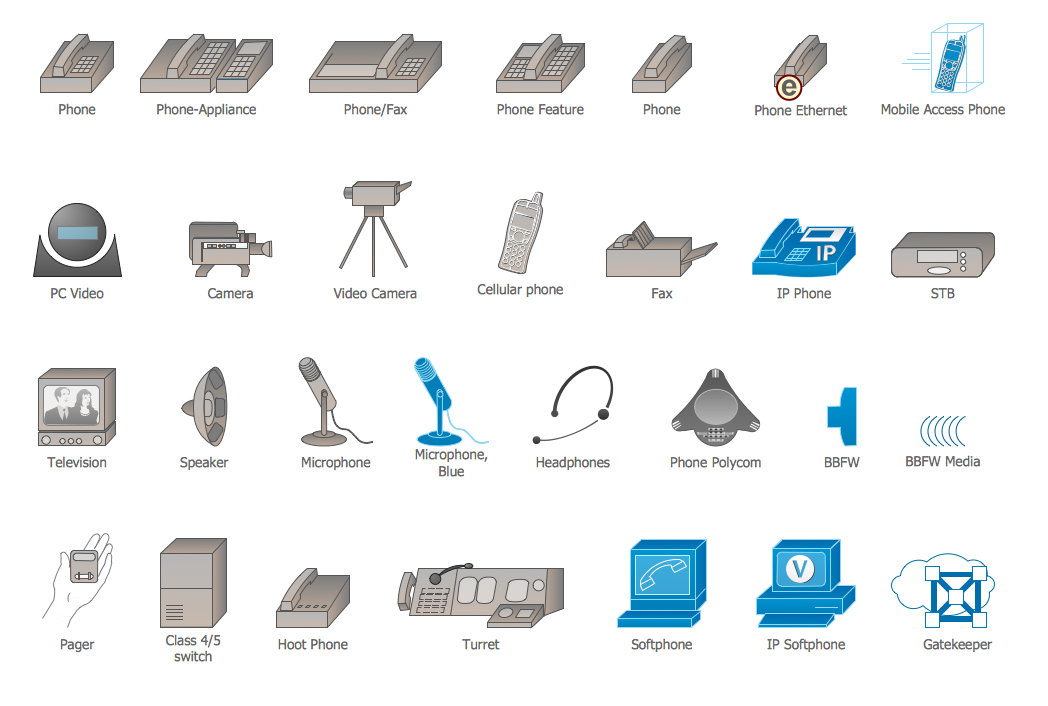
Picture: Cisco Multimedia, Voice, Phone. Cisco icons, shapes, stencils and symbols
Related Solution:
It's no secret that there is a list of skills that every average system administrator should have. And it's important to be able to manage domains via active directory technologies. The best way to keep all the details in mind is to draw a diagram representing users, groups and domains.
This diagram represents an Active Directory Services (Active Directory Domain Services). It can be helpful for system and network administrators to organize a network physical and logical elements (domains, data bases, servers, network equipment, end-user computers etc.) into a secure and logical structure. The logical structure of Active Directory is a hierarchical organization of all network components. The data that is stored in Active Directory comes from some diverse sources. The Active Directory diagram created using ConceptDraw Active Directory Diagram solution. It shows allocating group policies and functions assigned to end users. It helps to plan, manage and maintain the certain user access scenario.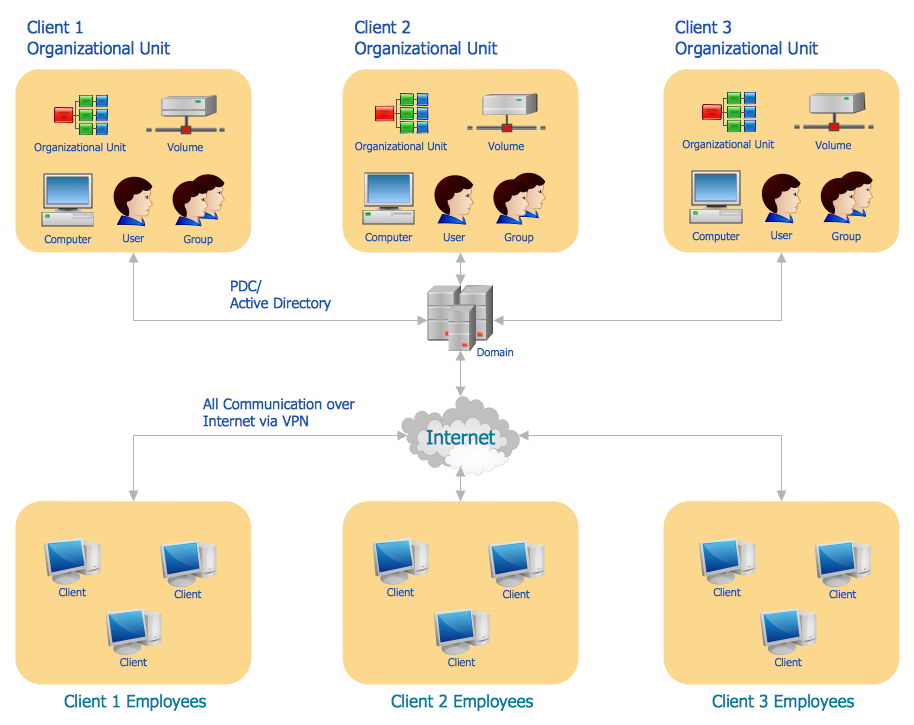
Picture: Active Directory Diagram
Related Solution:
