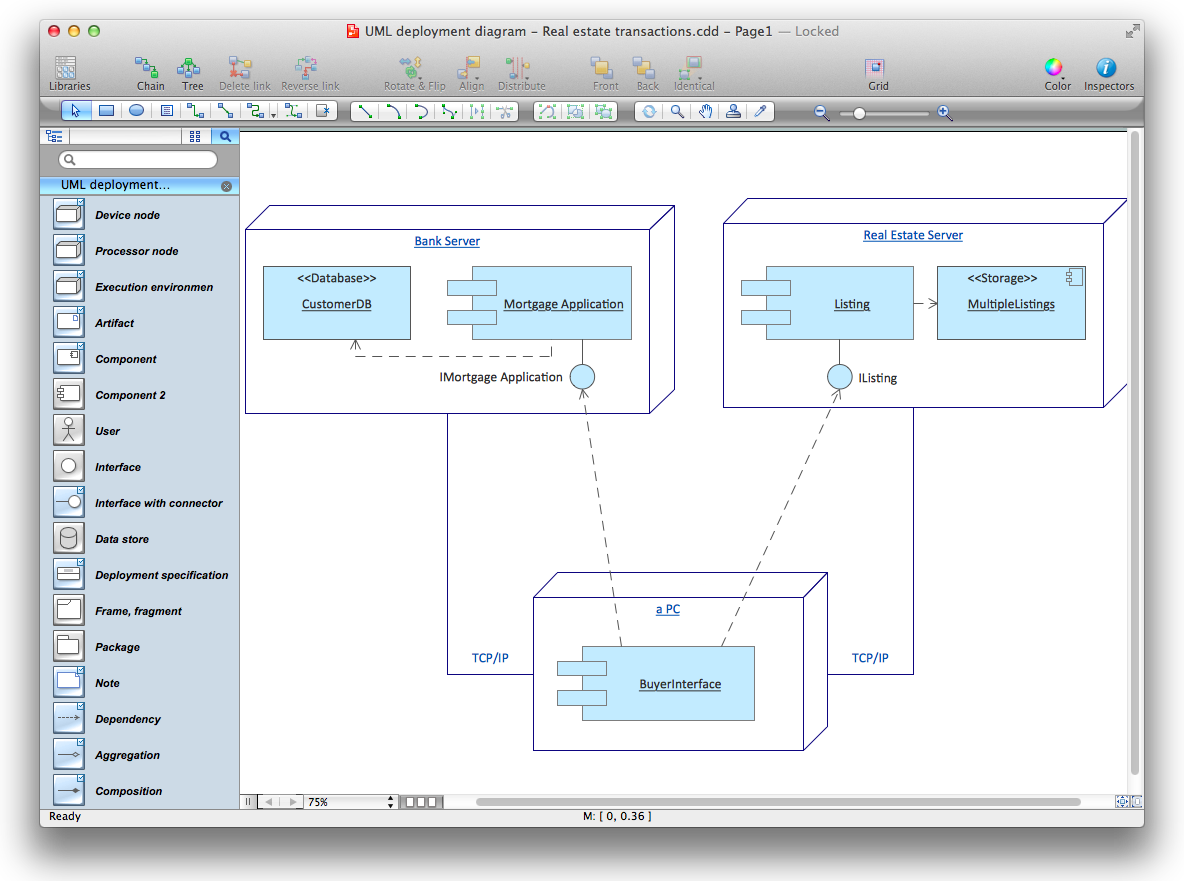

Examples of UML Deployment Diagram
This is an example of UML Deployment Diagram for an Apple iTunes process.

This UML deployment diagram sample is created using ConceptDraw DIAGRAM diagramming and vector drawing software enhanced with Rapid UML solution from ConceptDraw Solution Park.
Rapid UML solution provides templates, examples and libraries of stencils for quick and easy drawing all the types of system and software engineering diagrams according to UML 2.4 notation.
Use ConceptDraw DIAGRAM with UML deployment diagram templates, samples and stencil library from Rapid UML solution to model the physical deployment of artifacts on nodes of your software system.
TEN RELATED HOW TO's:
A Data Flow Diagram (DFD) is a graphical technique which allows effectively model and analyze the information processes and systems. The ability to fast and easy create the DFDs is made possible with Data Flow Diagrams solution from the Software Development area of ConceptDraw Solution Park. For designing the Data Flow Diagrams are used simple DFD flowchart symbols which are connected each other by arrows depicting the data flow from one step to another.
Picture: DFD Flowchart Symbols
Related Solution:
Use case diagrams are used at the development of software and systems for definition of functional system requirements or system of systems. Use case diagram presents the consecution of object’s actions (user’s or system’s) which are executed for reaching the definite result.
Picture: Use Case Diagrams technology with ConceptDraw DIAGRAM
26 libraries of the Electrical Engineering Solution of ConceptDraw DIAGRAM make your electrical diagramming simple, efficient, and effective.
Picture: Electrical Symbols — Thermo
Related Solution:
Talking about companies, that have influenced the entire industry, we should mention Cisco and it’s influence on network design. Nowadays, this equipment has became a kind of standard, and Cisco icons, shapes, stencils, symbols and design elements are easily recognized among others. You can use these icons to develop a network diagram of any complexity.
When dealing with creating a pack of network documentation, system administrator often have to depict a network containing a network equipment of such a well-known manufacturer as Cisco. As Cisco has developed its own production standard icons that are strongly recommended to use in Cisco network diagrams. The best way to draw Cisco Network diagram Cisco certified icons is using ConceptDraw solution for Cisco Network Diagrams. Using Cisco symbols library provided by this solution allows system administrator, or network architect to design a prototype of a new network or document an existing one.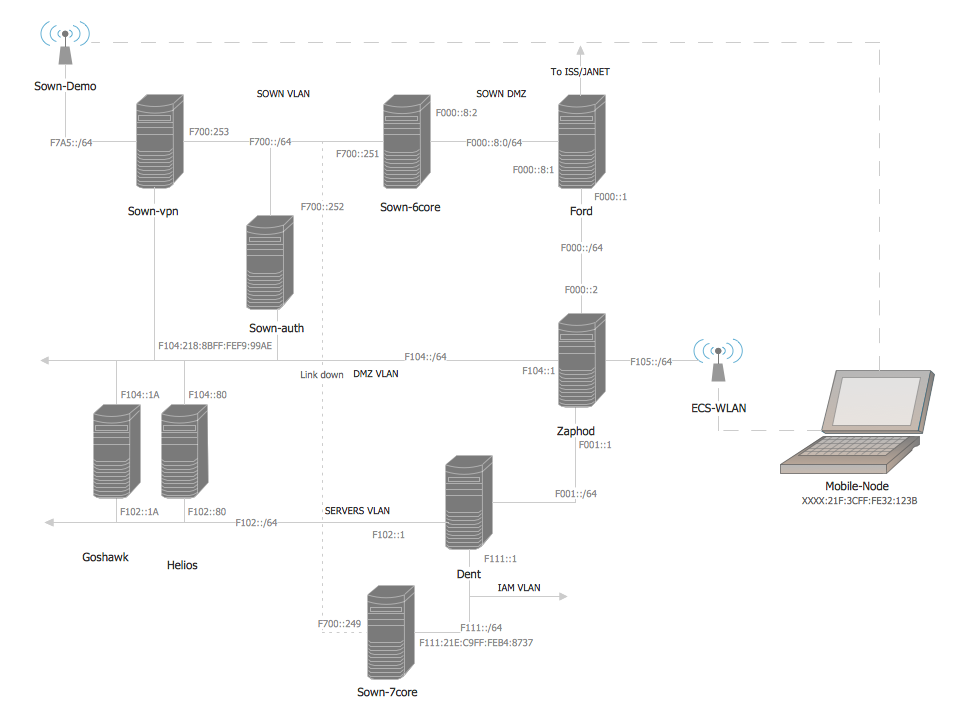
Picture: Cisco Network Design. Cisco icons, shapes, stencils, symbols and design elements
Related Solution:
It is so simple making the drawing process easier and faster. you just need to choose the right drawing software.
ConceptDraw Arrows10 Technology - This is so easy and fast to draw any type of diagram with any degree of complexity.
Picture: Simple & Fast Diagram Software
Related Solutions:
Successful Cafe Interior Design is so much broad definition, it includes a lot of things beginning from the choice of furniture and its placement, and finishing by the elements of design and interior, and by many other little details. ConceptDraw DIAGRAM offers the Cafe and Restaurant Floor Plan Solution from the Building Plans area allowing architects and designers develop and represent the Cafe Interior Design of any detailing.
Picture: Cafe Interior Design
Related Solution:
ConceptDraw DIAGRAM enhanced with Flowcharts Solution is the best flow chart maker online design software. Use it to ✔️ create clear and actionable Flowcharts, ✔️ improve decision-making, ✔️ enhance problem-solving in various scenarios, ✔️ enhance creativity and productivity across industries, ✔️ streamline workflows
Picture: Flow Chart Online
Related Solution:
Succeed in AWS architecture design, communication and collaboration with a team. 🔸 Create detailed and always up-to-date ✔️ AWS diagrams, ✔️ infrastructure based on AWS services, ✔️ auto-scalable architectures, ✔️ AWS-based applications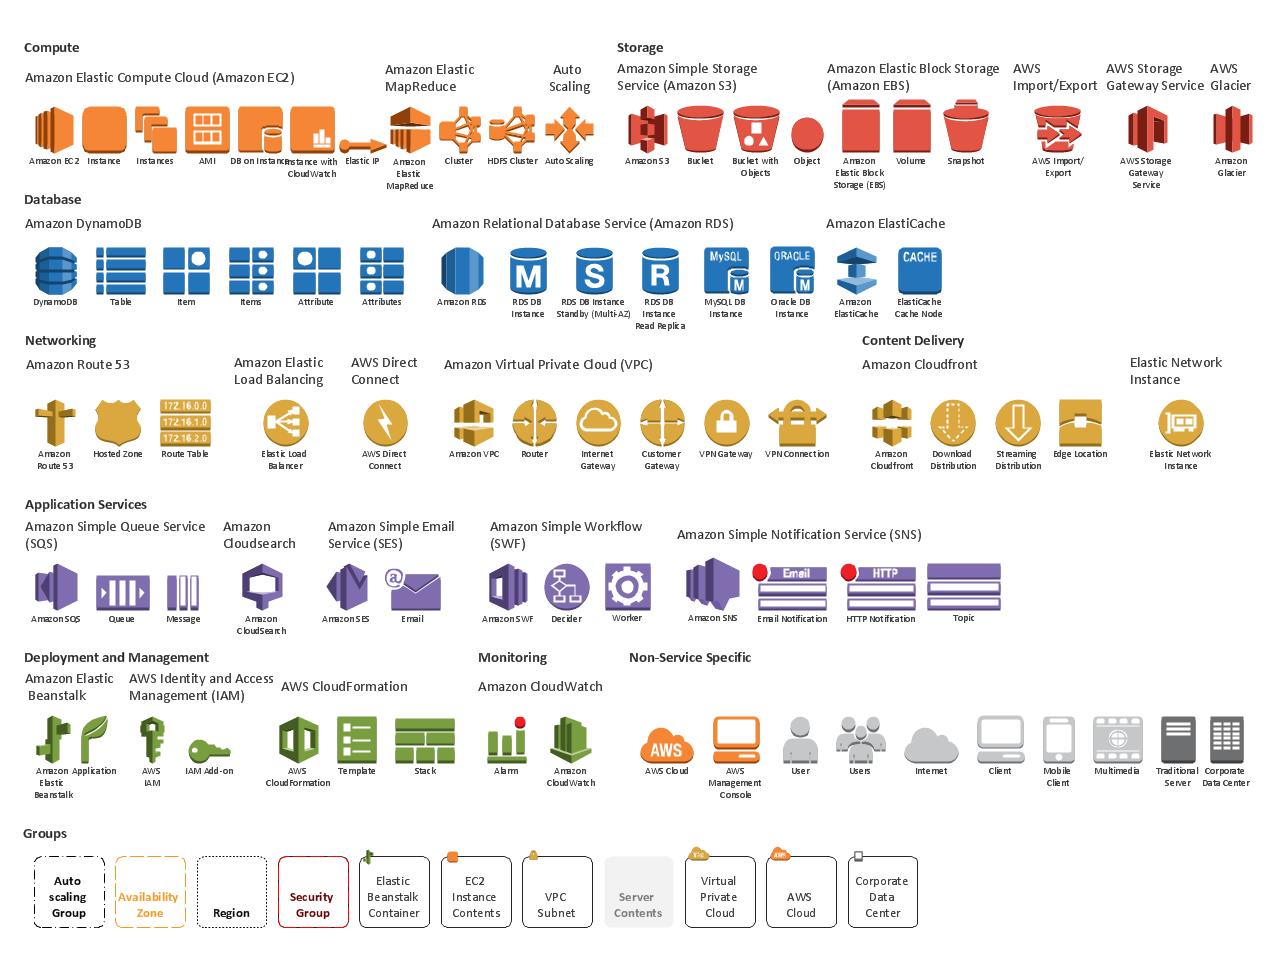
Picture: AWS icons 2.0
To maintain big and complex mechanical systems, you need an appropriate education and tools. It’s needless to say that mechanical drawing is important part of any industrial project. There are a lot of standard symbols depicting valves, pumps, motors, etc.
This drawing illustrates the content of the Fluid Power Equipment library provided by the ConceptDraw Mechanical Engineering solution. The solution is composed from the 8 libraries, containing about 500 elements related to mechanical engineering visualization. it will be helpful for drawing various schemes, charts and blueprints of pneumatic, and hydraulic equipment or other drawing related mechanical engineering. All drawings can be freely resized without loss of quality due to the vector graphics components of its facilities.
Picture:
Mechanical Drawing Symbols F.A.Q.
How to Use Mechanical Engineering Design Software
Related Solution:
Fishbone diagram, often reffered as Cause and Effect diagram or Ishikawa diagram, is one of the basic and the most effective tools for problems solving. It is a way of graphical identifying, structuring and exploration the root causes of a problem for determining effective decision.
ConceptDraw DIAGRAM enhanced with Fishbone Diagrams solution is a professional fishbone problem solving tool which helps you draw Business Productivity diagram, Cause and Effect, Fishbone, Ishikawa Diagrams to solve problems at your business.
Picture: Fishbone Problem Solving Tool
Related Solution:


