
Sample 1. Influence diagram.
This Influence diagram shows the making decision about the vacation activity.
Use the ready-to-use predesigned objects, templates and samples from the Basic Diagramming Solution for ConceptDraw DIAGRAM you can create your own Influence Diagrams quick and easy.
The Influence Diagrams produced with ConceptDraw DIAGRAM are vector graphic documents and are available for reviewing, modifying, and converting to a variety of formats (image, HTML, PDF file, MS PowerPoint Presentation, Adobe Flash or MS Visio).
TEN RELATED HOW TO's:
While creating flowcharts and process flow diagrams, you should use special objects to define different statements, so anyone aware of flowcharts can get your scheme right. There is a short and an extended list of basic flowchart symbols and their meaning. Basic flowchart symbols include terminator objects, rectangles for describing steps of a process, diamonds representing appearing conditions and questions and parallelograms to show incoming data.
This diagram gives a general review of the standard symbols that are used when creating flowcharts and process flow diagrams. The practice of using a set of standard flowchart symbols was admitted in order to make flowcharts and other process flow diagrams created by any person properly understandable by other people. The flowchart symbols depict different kinds of actions and phases in a process. The sequence of the actions, and the relationships between them are shown by special lines and arrows. There are a large number of flowchart symbols. Which of them can be used in the particular diagram depends on its type. For instance, some symbols used in data flow diagrams usually are not used in the process flowcharts. Business process system use exactly these flowchart symbols.
Picture: Flowchart Symbols: Meaning and Examples
Related Solution:
Astronomy solution provides the Stars and Planets library with wide variety of solar system symbols. You can find here vector objects of solar system, of stars and planets of the universe.
To quickly draw any astronomy illustration: create new document and simply drag the needed solar system symbols from the Stars and Planets library, arrange them and add the text. You can also use the predesigned templates and samples from the ConceptDraw STORE as the base for your own sun solar system illustrations, astronomy and astrology drawings.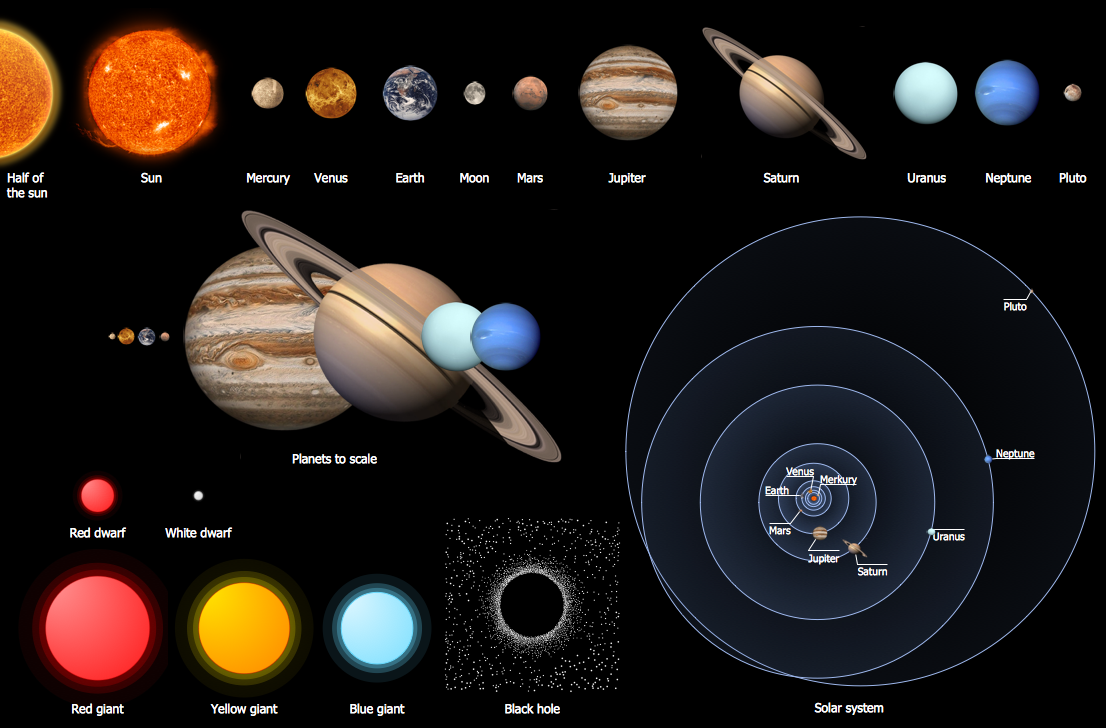
Picture: Solar System Symbols
Related Solution:
Create flowcharts, flow charts, and more with ConceptDraw flowchart software.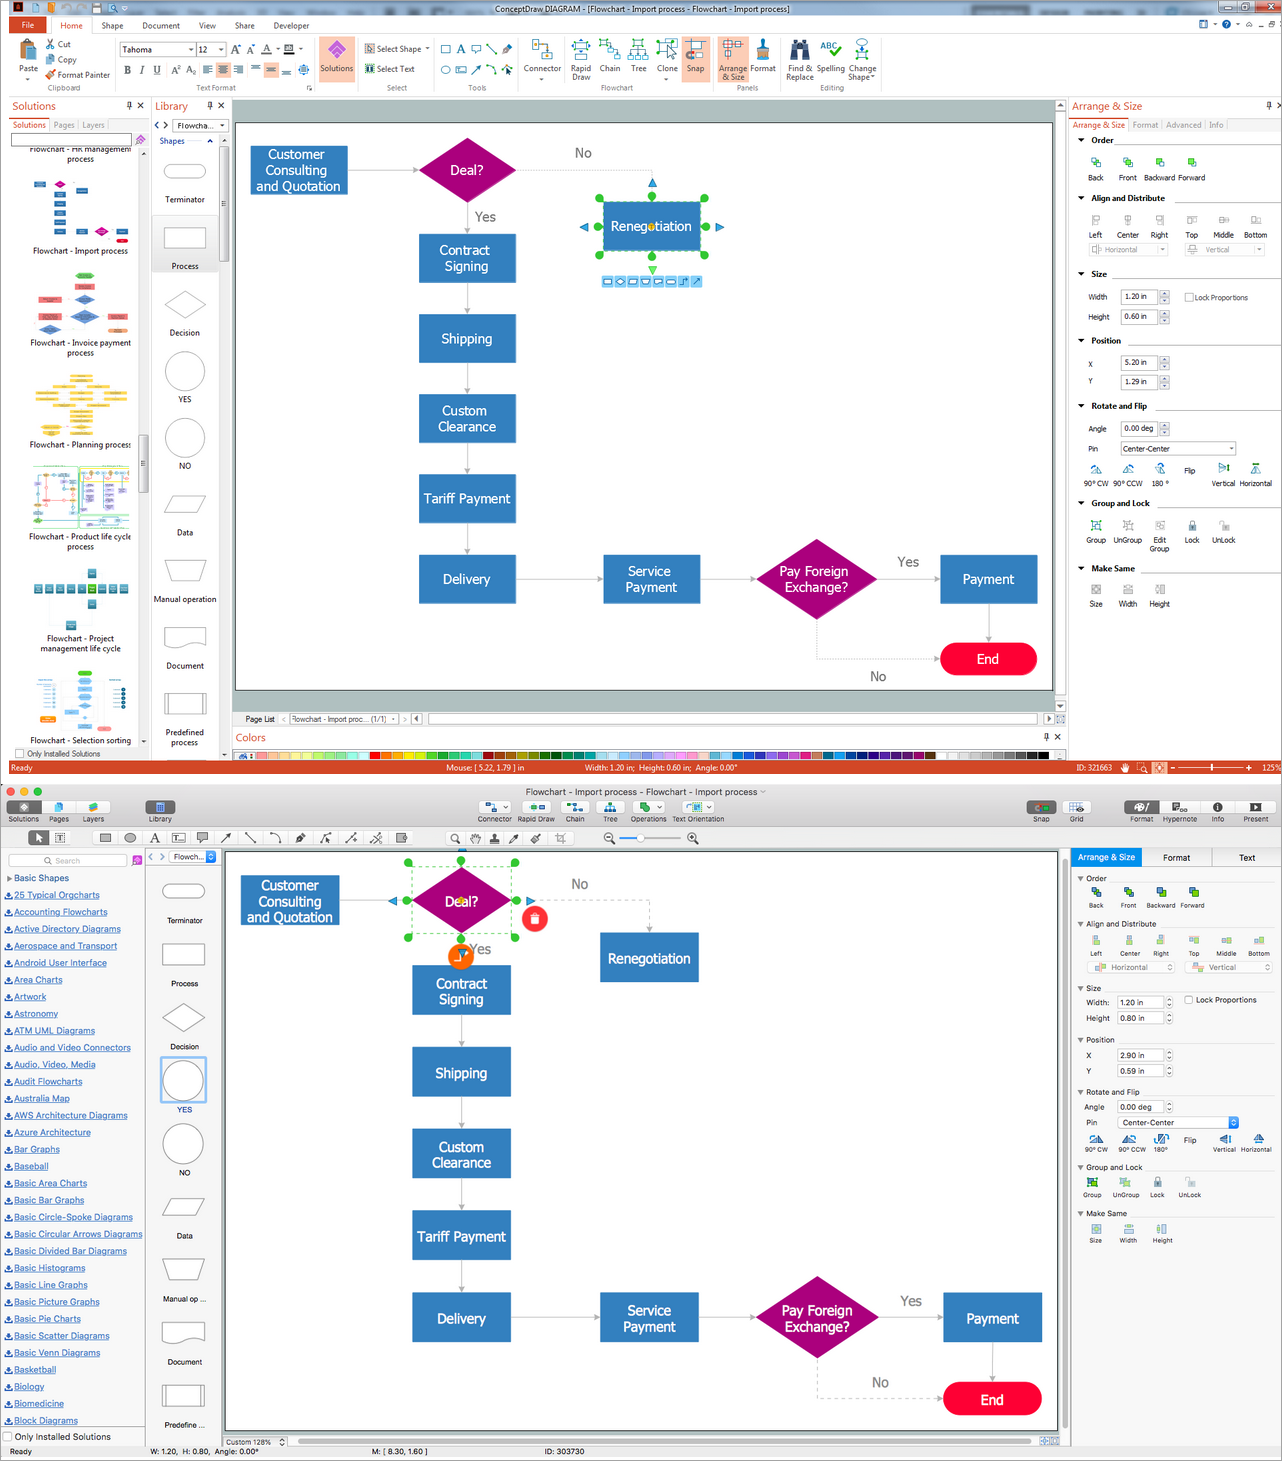
Picture: Basic Diagramming. Flowchart Software
Related Solution:
ConceptDraw DIAGRAM extended with Divided Bar Diagrams solution from Graphs and Charts area of ConceptDraw Solution Park is the best software for quick and simple drawing the Divided Bar Diagrams and Bar Diagram Math.
Picture: Bar Diagram Math
Related Solution:
Website wireframes are convenient and widely used by developers, visual designers, business analysts, and many other people related with projection, development and promotion websites. Usually website wireframes look lacking of brilliance, but they effectively reflect website functionality, content and visually represent its skeletal framework.
ConceptDraw DIAGRAM software offers a unique Website Wireframe solution from the Software Development area with all needed tools for fast and easy drawing professional looking website wireframe with attractive interface design.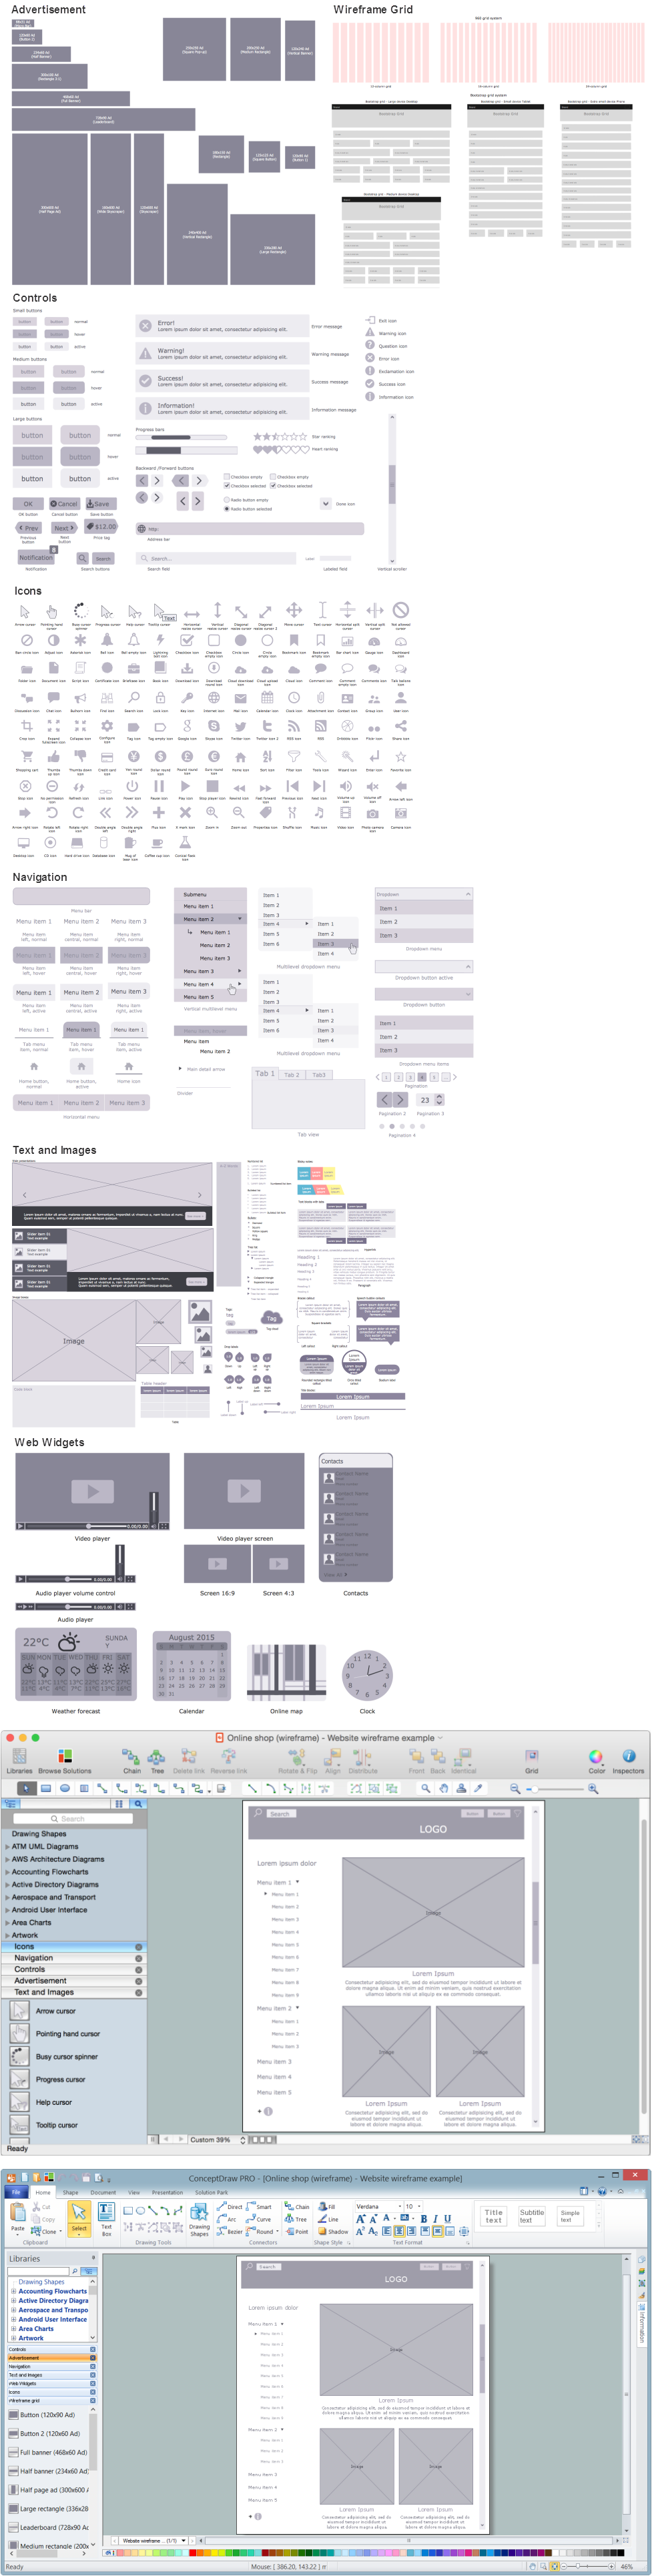
Picture: Interface Design
Related Solution:
Explore practical flowchart examples including business process diagrams, workflow charts, swimlane flowcharts, and IT troubleshooting flows. Review common patterns and start from ready templates.
Picture: Flowchart Examples
Related Solution:
When you need a drawing software to create a professional looking cross-functional charts, ConceptDraw with its Arrows10 Technology - is more than enough versatility to draw any type of diagram with any degree of complexity.
Use templates with process maps, diagrams, charts to get the drawing in minutes.
Picture: Cross-Functional Process Map Template
The 7 Management and Planning Tools solution implements well-known methodologies for problem analysis and solving. Different products from the ConceptDraw Office suite can be used as a complete solution for any of the methodologies in this solution. ConceptDraw Office provides visual communication during every stage of work.
Picture: 7 Management & Planning Tools
Related Solution:
ConceptDraw DIAGRAM diagramming and vector drawing software extended with Marketing Diagrams Solution from the Marketing Area of ConceptDraw Solution Park is the best software for quick and easy creating Marketing Flow Chart of any complexity and design.
Picture: Marketing Flow Chart
Related Solution:
There’s no shortage of ways the new Microsoft® PowerPoint® import capability in ConceptDraw MINDMAP can help you.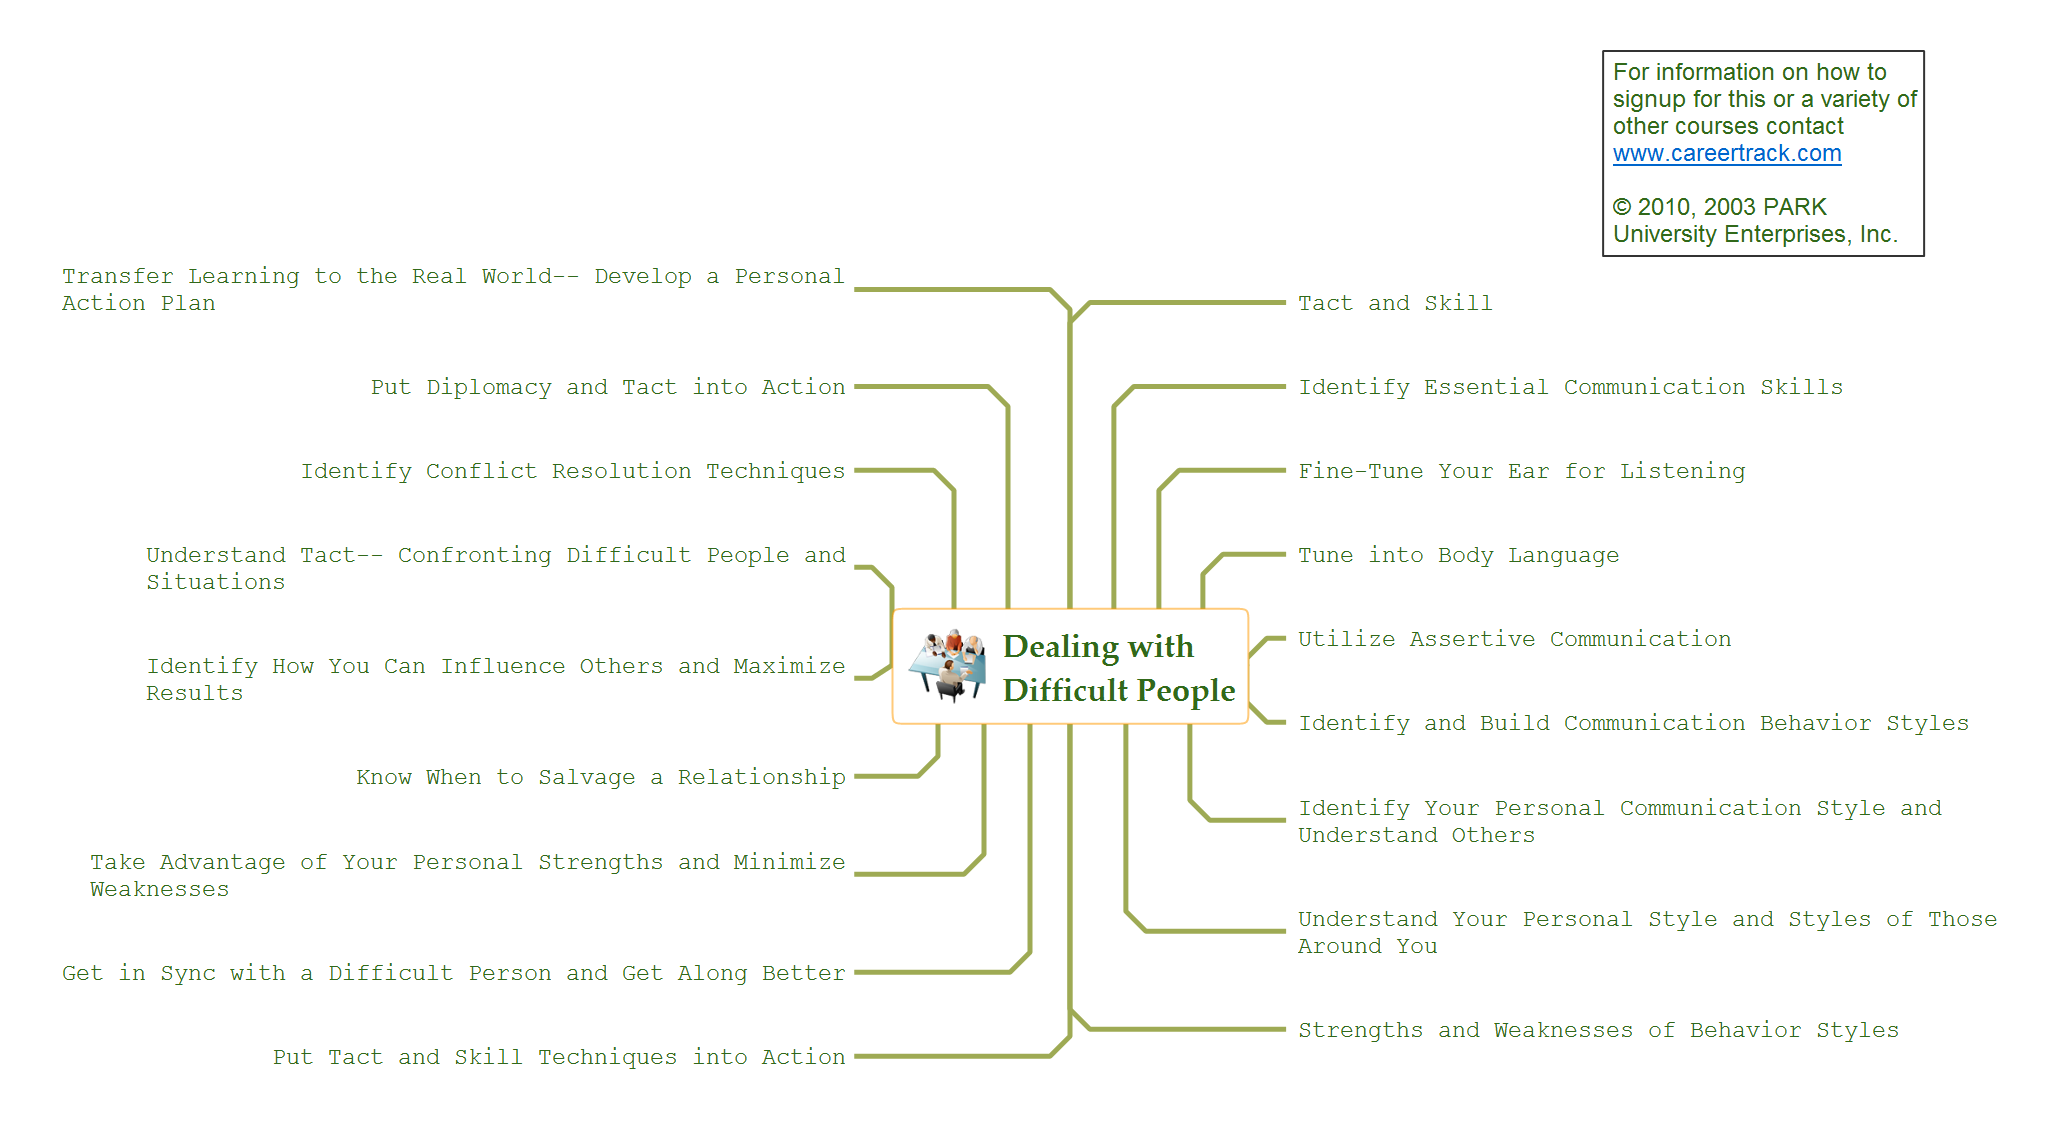
Picture: How to Use the Export To PowerPoint Function in Your Mindmap Tool
Related Solution: