
Example 1. Infographic Maker
ConceptDraw DIAGRAM Infographic Maker is ideal infographics software thanks to the Pictorial Infographics Solution which provides the best numerous collection of predesigned pictorial infographics examples and samples, and 10 libraries with variety of predesigned vector pictograms.
Simply type the text and drag the needed pictograms from the libraries to save your time and to create pictorial infographics quick and easy.

Example 2. Pictorial Infographics - World Population
The following features make ConceptDraw DIAGRAM the best Pictorial Infographic Maker:
- You don't need to be an artist to draw professional looking chats in a few minutes.
- Large quantity of ready-to-use vector objects makes your drawing infographics quick and easy.
- Great number of predesigned samples give you the good start for your own pictorial infographics.
- ConceptDraw DIAGRAM provides you the possibility to use the grid, rules and guides. You can easily rotate, group, align, arrange the objects, use different fonts and colors to make your diagram exceptionally looking.
- All ConceptDraw DIAGRAM documents are vector graphic files and are available for reviewing, modifying, and converting to a variety of formats: image, HTML, PDF file, MS PowerPoint Presentation, Adobe Flash, MS Visio.
- Using ConceptDraw STORE you can navigate through ConceptDraw Solution Park, managing downloads and updates. You can access libraries, templates and samples directly from the ConceptDraw STORE.
- If you have any questions, our free of charge support is always ready to come to your aid.
NINE RELATED HOW TO's:
ConceptDraw PROJECT is an effective tool for new and experienced users with a fine balance of usability and powerful functionality.
Picture: ConceptDraw PROJECT Software Overview
Choose the business illustration design you love best, and sign our design your own style with Business and Finance Illustrations library from ConceptDraw DIAGRAM.
The Business and Finance solution contains 12 vector clipart libraries: Advertising, Business, Business people clipart, Business people figures, Currency, Mail and post, Management, Marketing, Money, Office, Project management, Time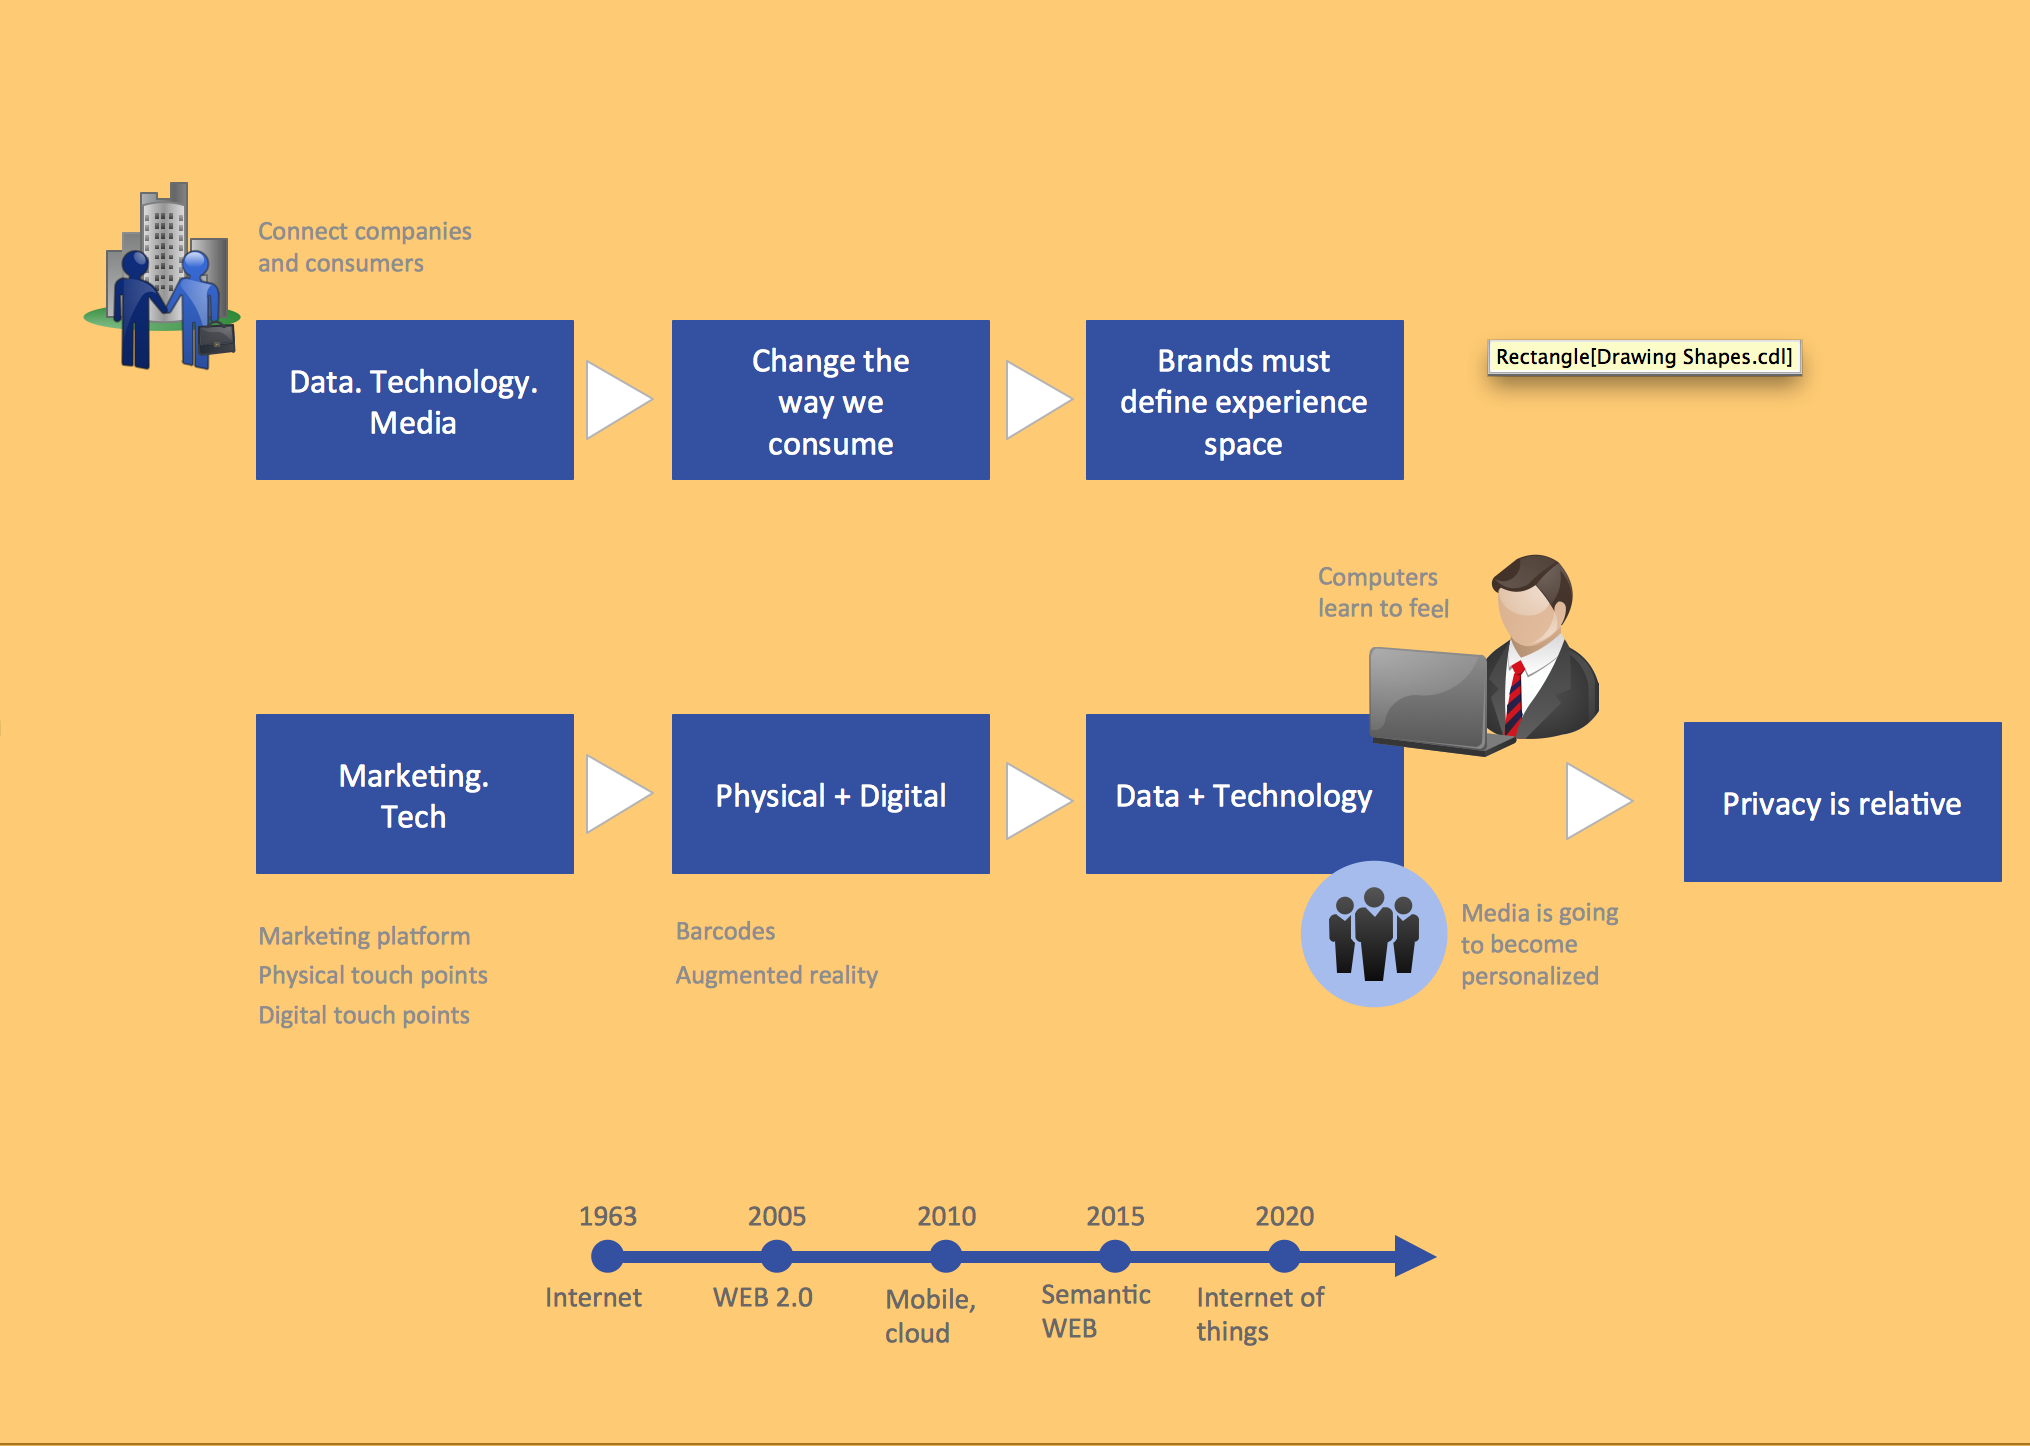
Picture: Business and Finance Illustrations
Related Solution:
The HR Management Software is an incredibly powerful tool for those who need to analyze or present human resource process flows in a visually effective manner.
Picture: HR Management Software
Related Solution:
ConceptDraw helps you to start designing your own UML Collaboration Diagrams with examples and templates.
Picture: Diagramming Software for Design UML Collaboration Diagrams
As restaurant industry is growing rapidly nowadays, researches show that almost half of the adults have worked in a restaurant or a cafe. Moreover, many of them dream to start their own someday. Unfortunately, it takes a lot of time to write a business plan and to find a great location, although some know how to create a restaurant floor plan in minutes or how to plan budget effortlessly. Hiring employees can also cause a lot of headache, but this is crucial for further success, because every guest comes to restaurant for a good service and delicious food. It is also worth noting that restaurant concept is also important, because it defines target audience and influences the menu.
This diagram represents the floor plan of an ongoing sports-theme establishment - restaurant, cafe, or other food service. A number of widescreen monitors installed along the perimeter provide visitors the opportunity to follow the course of a match from anywhere in the dining room of restaurant or cafe. The most of sports fans believe that food and alcohol is a big part of any sports show. That is why the dining room takes the most space - almost 60% of the total establishment space. Nearly all sports fans consume beverages while watching sports - beer, soda or water at least. Thus, the restaurant floor plan designers added a large lavatory there. Moreover, project developers considered unnecessary the gender division of such delicate place - perhaps they guess that only men are watching football, or believe that alcohol will eliminate the most of gender differences.
Picture: How To Create Restaurant Floor Plan in Minutes
Related Solution:
A floor plan is an essential element of any building or architectural plan. It shows a view from above of relationships between physical features on one floor of a structure. Thanks to modern digital drawing tools, you can easily learn how to create floor plans. Software like ConceptDraw DIAGRAM provides an intuitive and modern interface and an assortment of powerful tools, so that nothing will get in the way of your creativity.
When considering a moving to a new office, or making rearrangement of an office, its better to draw an office floor plan picture. The objective of any office space organization is to maintain a business functionality in a proper manner. This diagram illustrates a layout of usual cubical office. It shows just walls, windows and cubicles. You can use it as a template for your custom office layout diagram. the all you need is to launch ConceptDraw DIAGRAM with its Office Plans solution. Then, you can make changes and add necessary equipment, using the vector objects library, supplied with solution.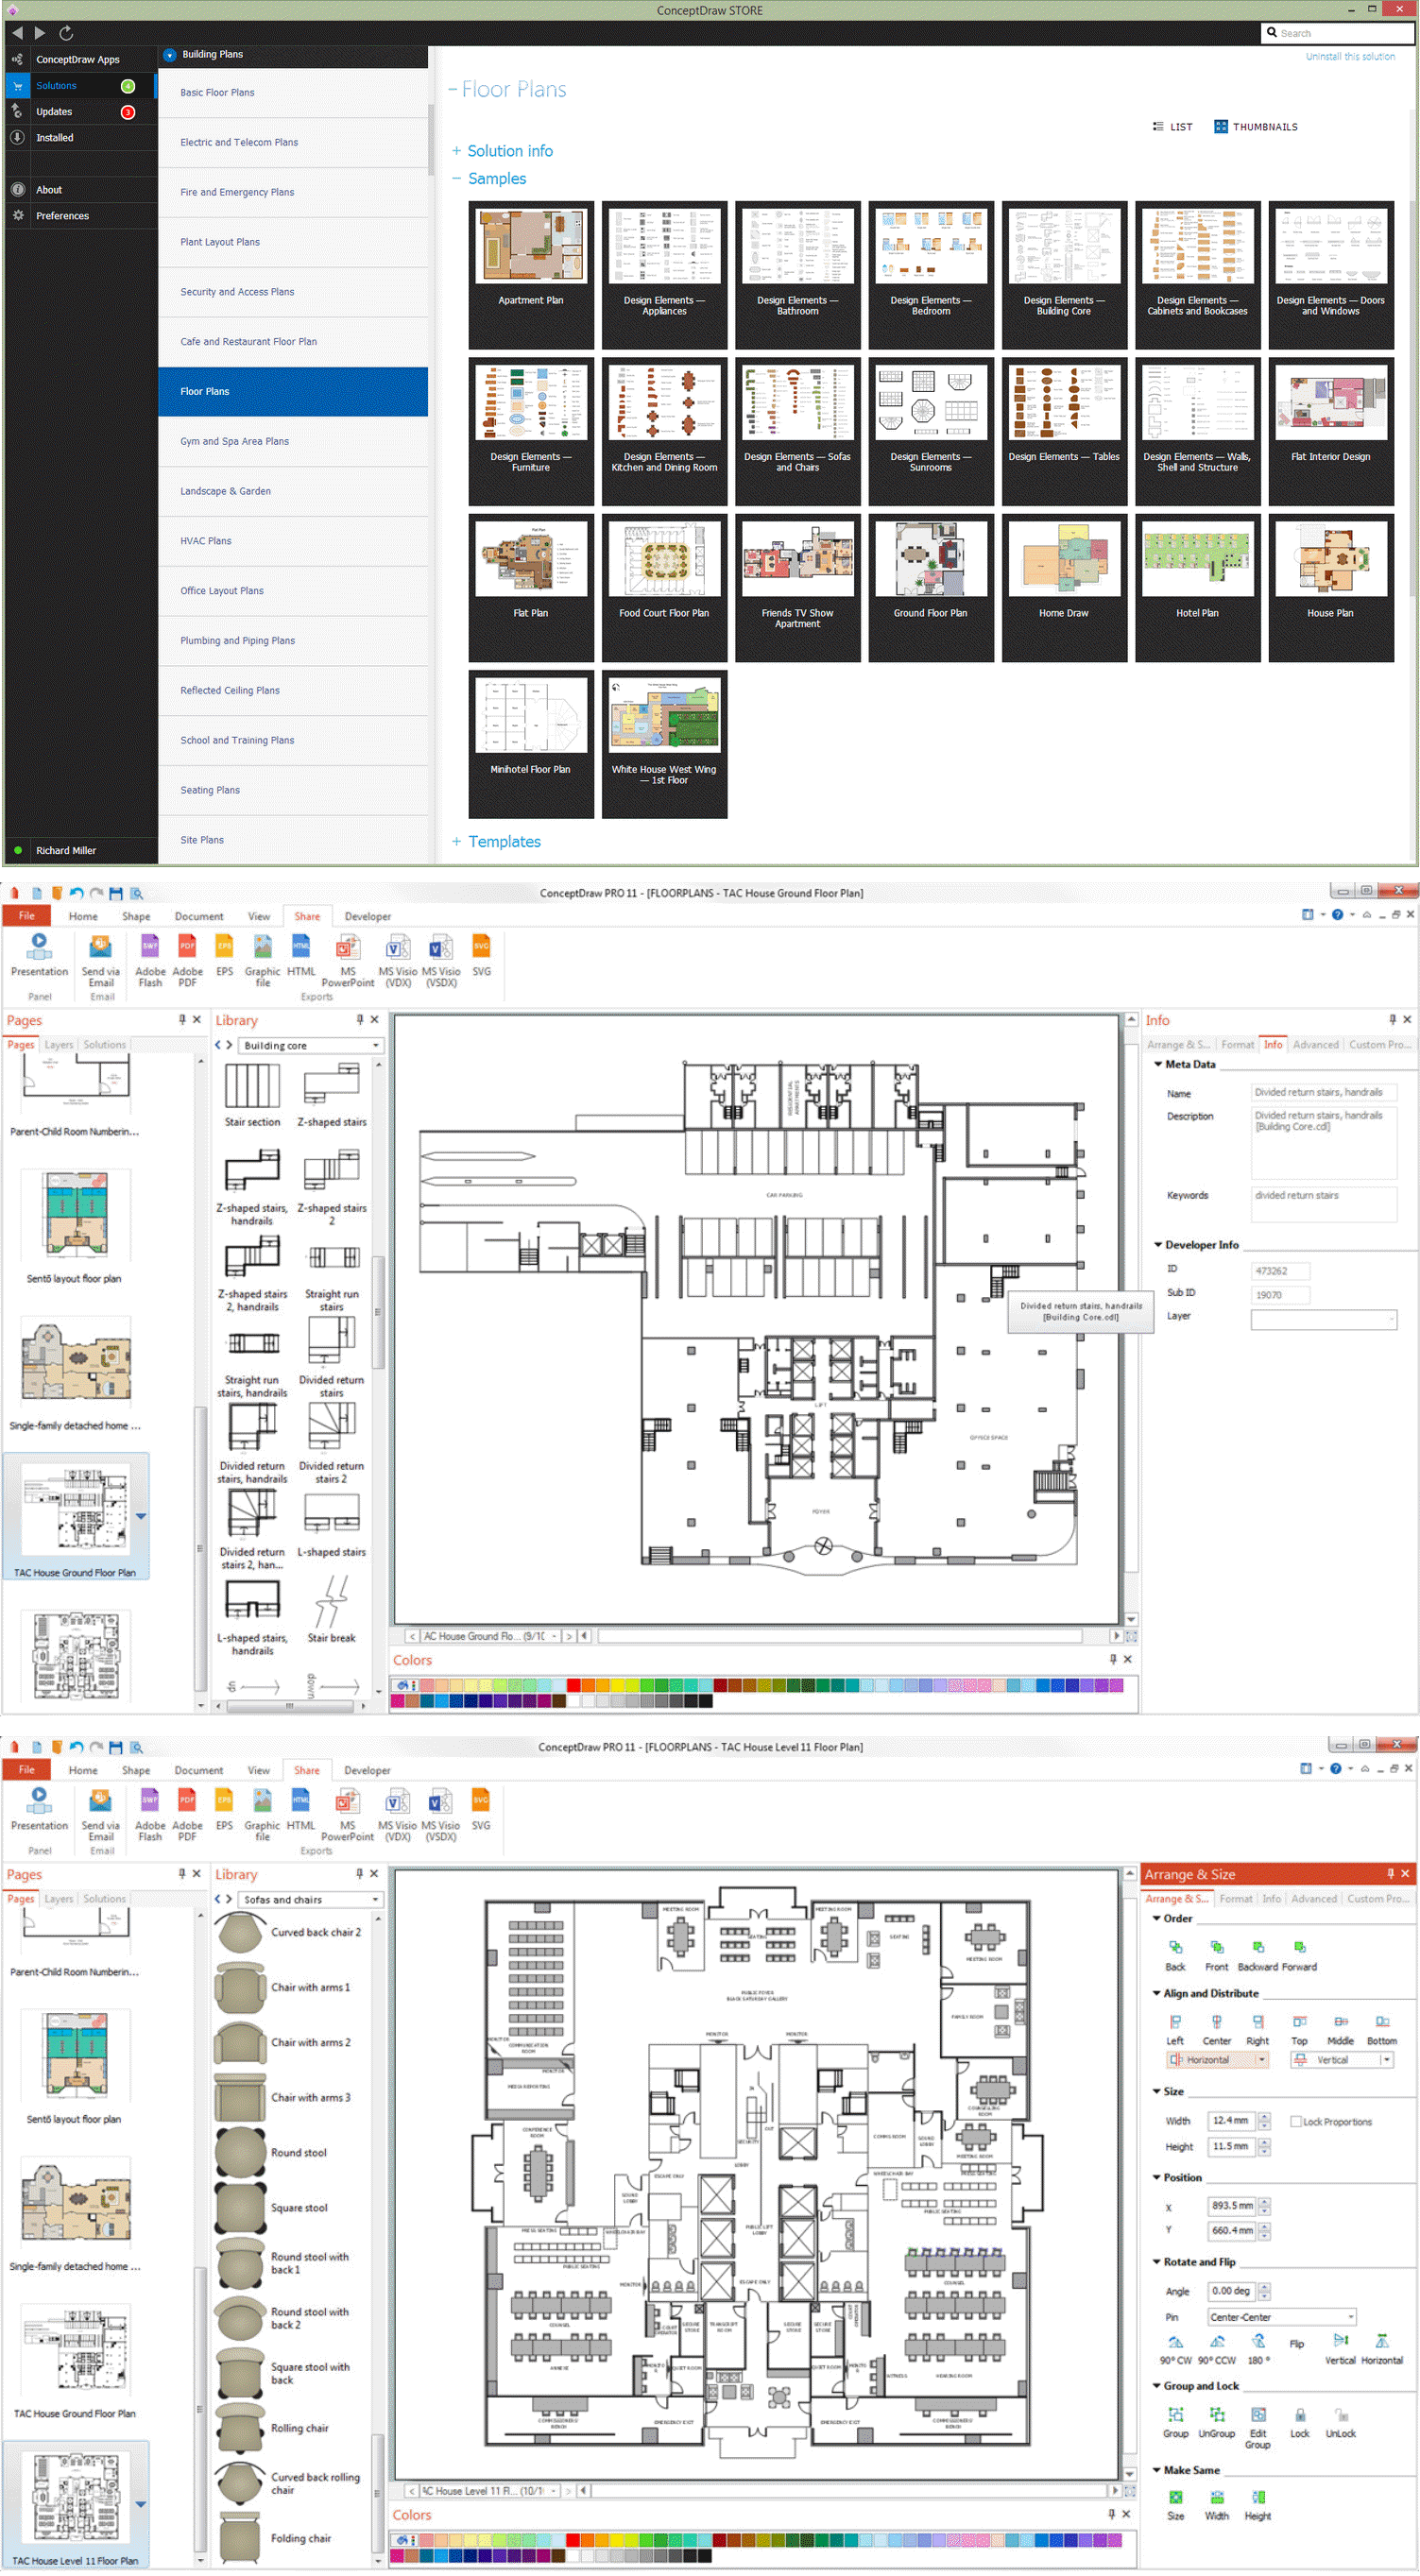
Picture: How To Create Floor Plans
Related Solution:
To maintain big and complex mechanical systems, you need an appropriate education and tools. It’s needless to say that mechanical drawing is important part of any industrial project. There are a lot of standard symbols depicting valves, pumps, motors, etc.
This drawing illustrates the content of the Fluid Power Equipment library provided by the ConceptDraw Mechanical Engineering solution. The solution is composed from the 8 libraries, containing about 500 elements related to mechanical engineering visualization. it will be helpful for drawing various schemes, charts and blueprints of pneumatic, and hydraulic equipment or other drawing related mechanical engineering. All drawings can be freely resized without loss of quality due to the vector graphics components of its facilities.
Picture:
Mechanical Drawing Symbols F.A.Q.
How to Use Mechanical Engineering Design Software
Related Solution:
The Circle Diagrams are the diagrams which represent the central element surrounded by other items in a circle. This type of diagram is very popular and widely used in marketing and management, for process modeling, market, resource, time and cost analysis, for visualization causes and effects. If you dream to design the Circle Diagrams quick and easy – the ConceptDraw DIAGRAM software extended with Business Diagrams Solution from the Management Area is exactly what you need.
Picture: Circle Diagrams
Related Solution:
The Total Quality Management Diagram solution helps you and your organization visualize business and industrial processes. Create Total Quality Management diagrams for business process with ConceptDraw software.
Picture: Organizational Structure Total Quality Management
Related Solution:


