GUI Prototyping with ConceptDraw DIAGRAM
|
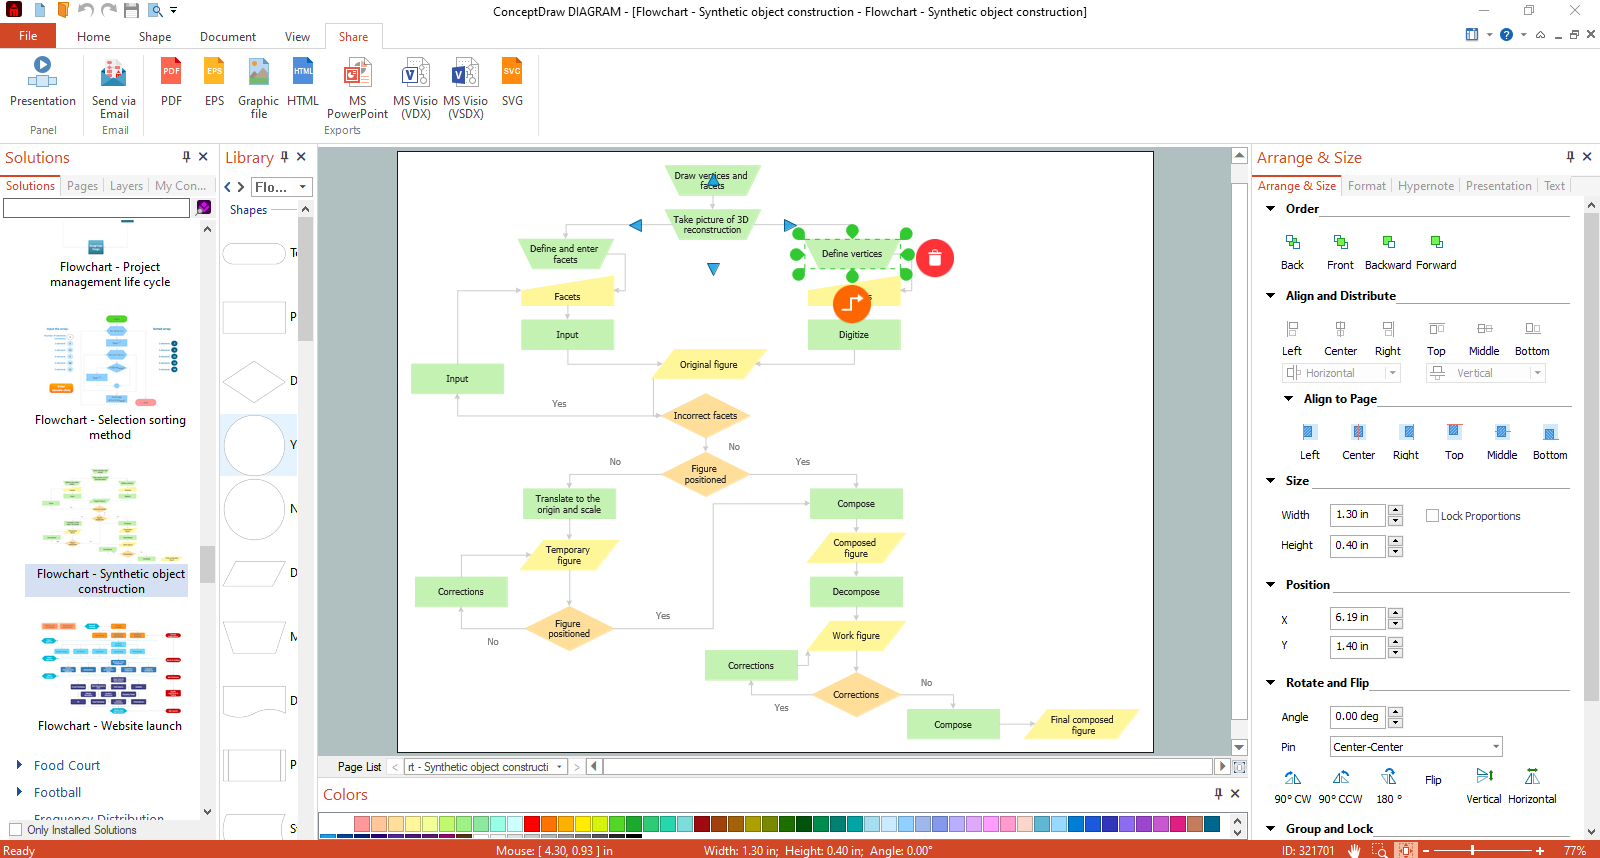
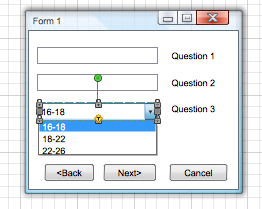
Developing some software, project managers, software engineers and GUI developers often have to create a software model. Very often, they need to develop its graphic design to demonstrate the layout of the developed software to clients or coordinate the process of development with your QA department, and discuss its usability and convenience. Thus, the final look of the diagram in work can be defined even at the development phase. Moreover, you can also define to what extent it will be convenient to the final user. But how to create such program elements as dialogs, menus, buttons at the development phase, when there is no runnable application? You can use some development system with the resource-editor or start creating an application prototype, or just create a text project with a set of necessary dialogs. In case you require a data type to get a clearer idea of interface, you will have to advance far enough in creation of an application prototype in order to get a sound look of interface. All this takes plenty of time . Another crucial point here is that such an approach does not allow attracting unskilled designers and managers to interface development. A quite unlike situation occurs if try drawing interface in some graphic package. Whichever you choose a package of vector or raster graphics, development of interface becomes a designer's task, let alone acceptable speed. Moreover , interface elements will be static a priori . And it will take you a lot of extra time to draw the same dialog, with an opened combo box, for instance. Although, of course, you can draw a program in any state and with any data. Diagramming tool ConceptDraw from CS Odessa Corporation offers the third approach. This program is for 2-D vector drawing, but for more acceleration of prototyping of graphic interface, it offers a set of libraries with ready-to-use GUI elements.
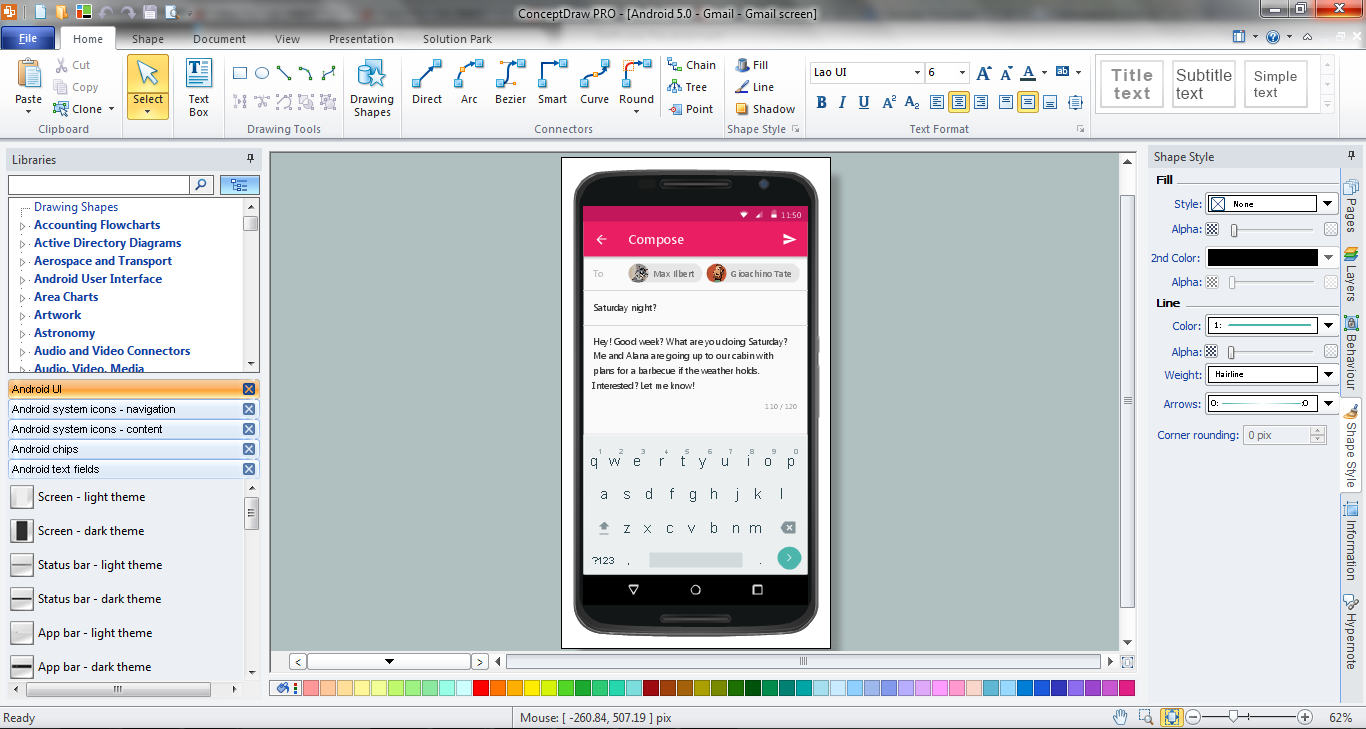
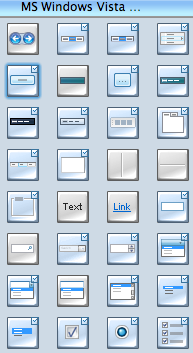
. To create some interface object in ConceptDraw, you need to open ConceptDraw STORE and, considering the needed OS, choose the necessary template in which element libraries will appear.
For instance, Windows User Interface (together with it MS Office elements will appear) or Mac OS X User Interface. Then in the Libraries panel the libraries with GUI elements, which can be added to your document, will appear.
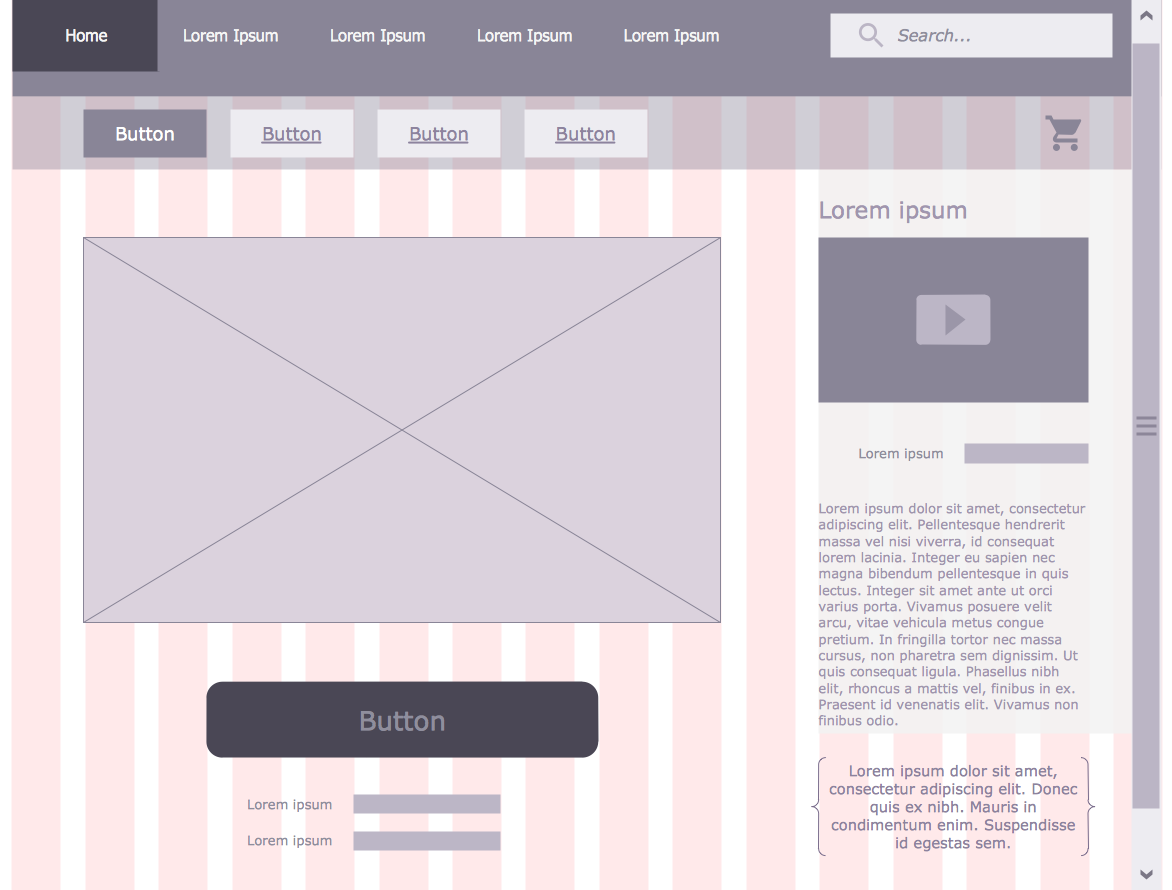
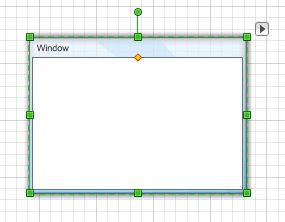
Using Drag&Drop or double-clicking on the needed element you will add it to your document and will be further able to edit it. First, add an empty dialog to the document.
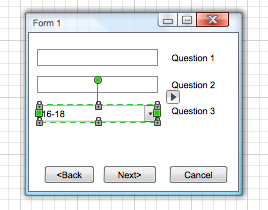
Similarly, you can add any necessary components for creation of interface. After you have added them, the only thing left is to properly arrange them and edit corresponding to your needs. For instance, if you add the button for closing the dialog, take it by the green square on the right
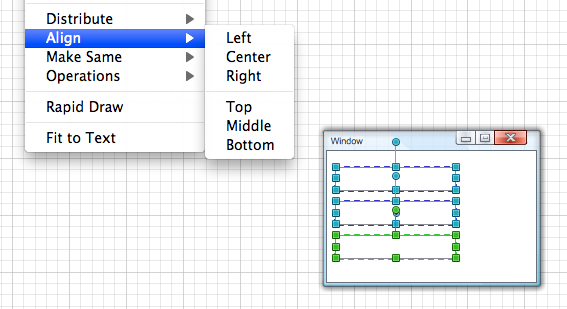
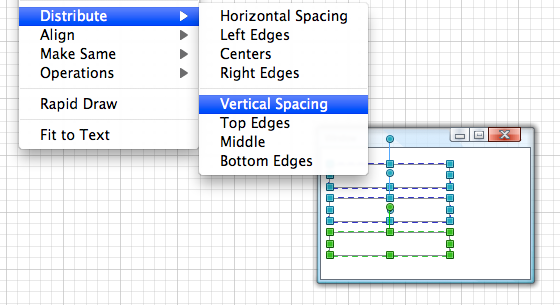
You can also arrange objects by selecting them with pressing Shift, and having chosen on of the variants of arrangement on the toolbar Align.
Or you can distribute objects by using buttons on the same toolbar.
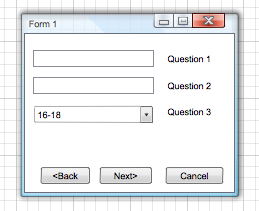
Thus, without too much effort, you will get a dialog of the similar type in a couple of minutes. And you do not have to use programming for this. Besides, ConceptDraw is the only cross-platform program that allows to create interface for you upcoming software not only for Windows, but also for Mac OS (X). That is why it is the best choice for companies and developers who work on markets of Win and Mac applications. |

 and then move it to the right upper corner of the dialog marked with a cross (the handle becomes red in right place), it will be connected to the dialog window and will further move together with it. Similarly, you can add other buttons and as well as any other objects.
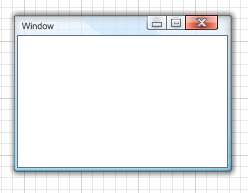
 on Snap&Glue toolbar.
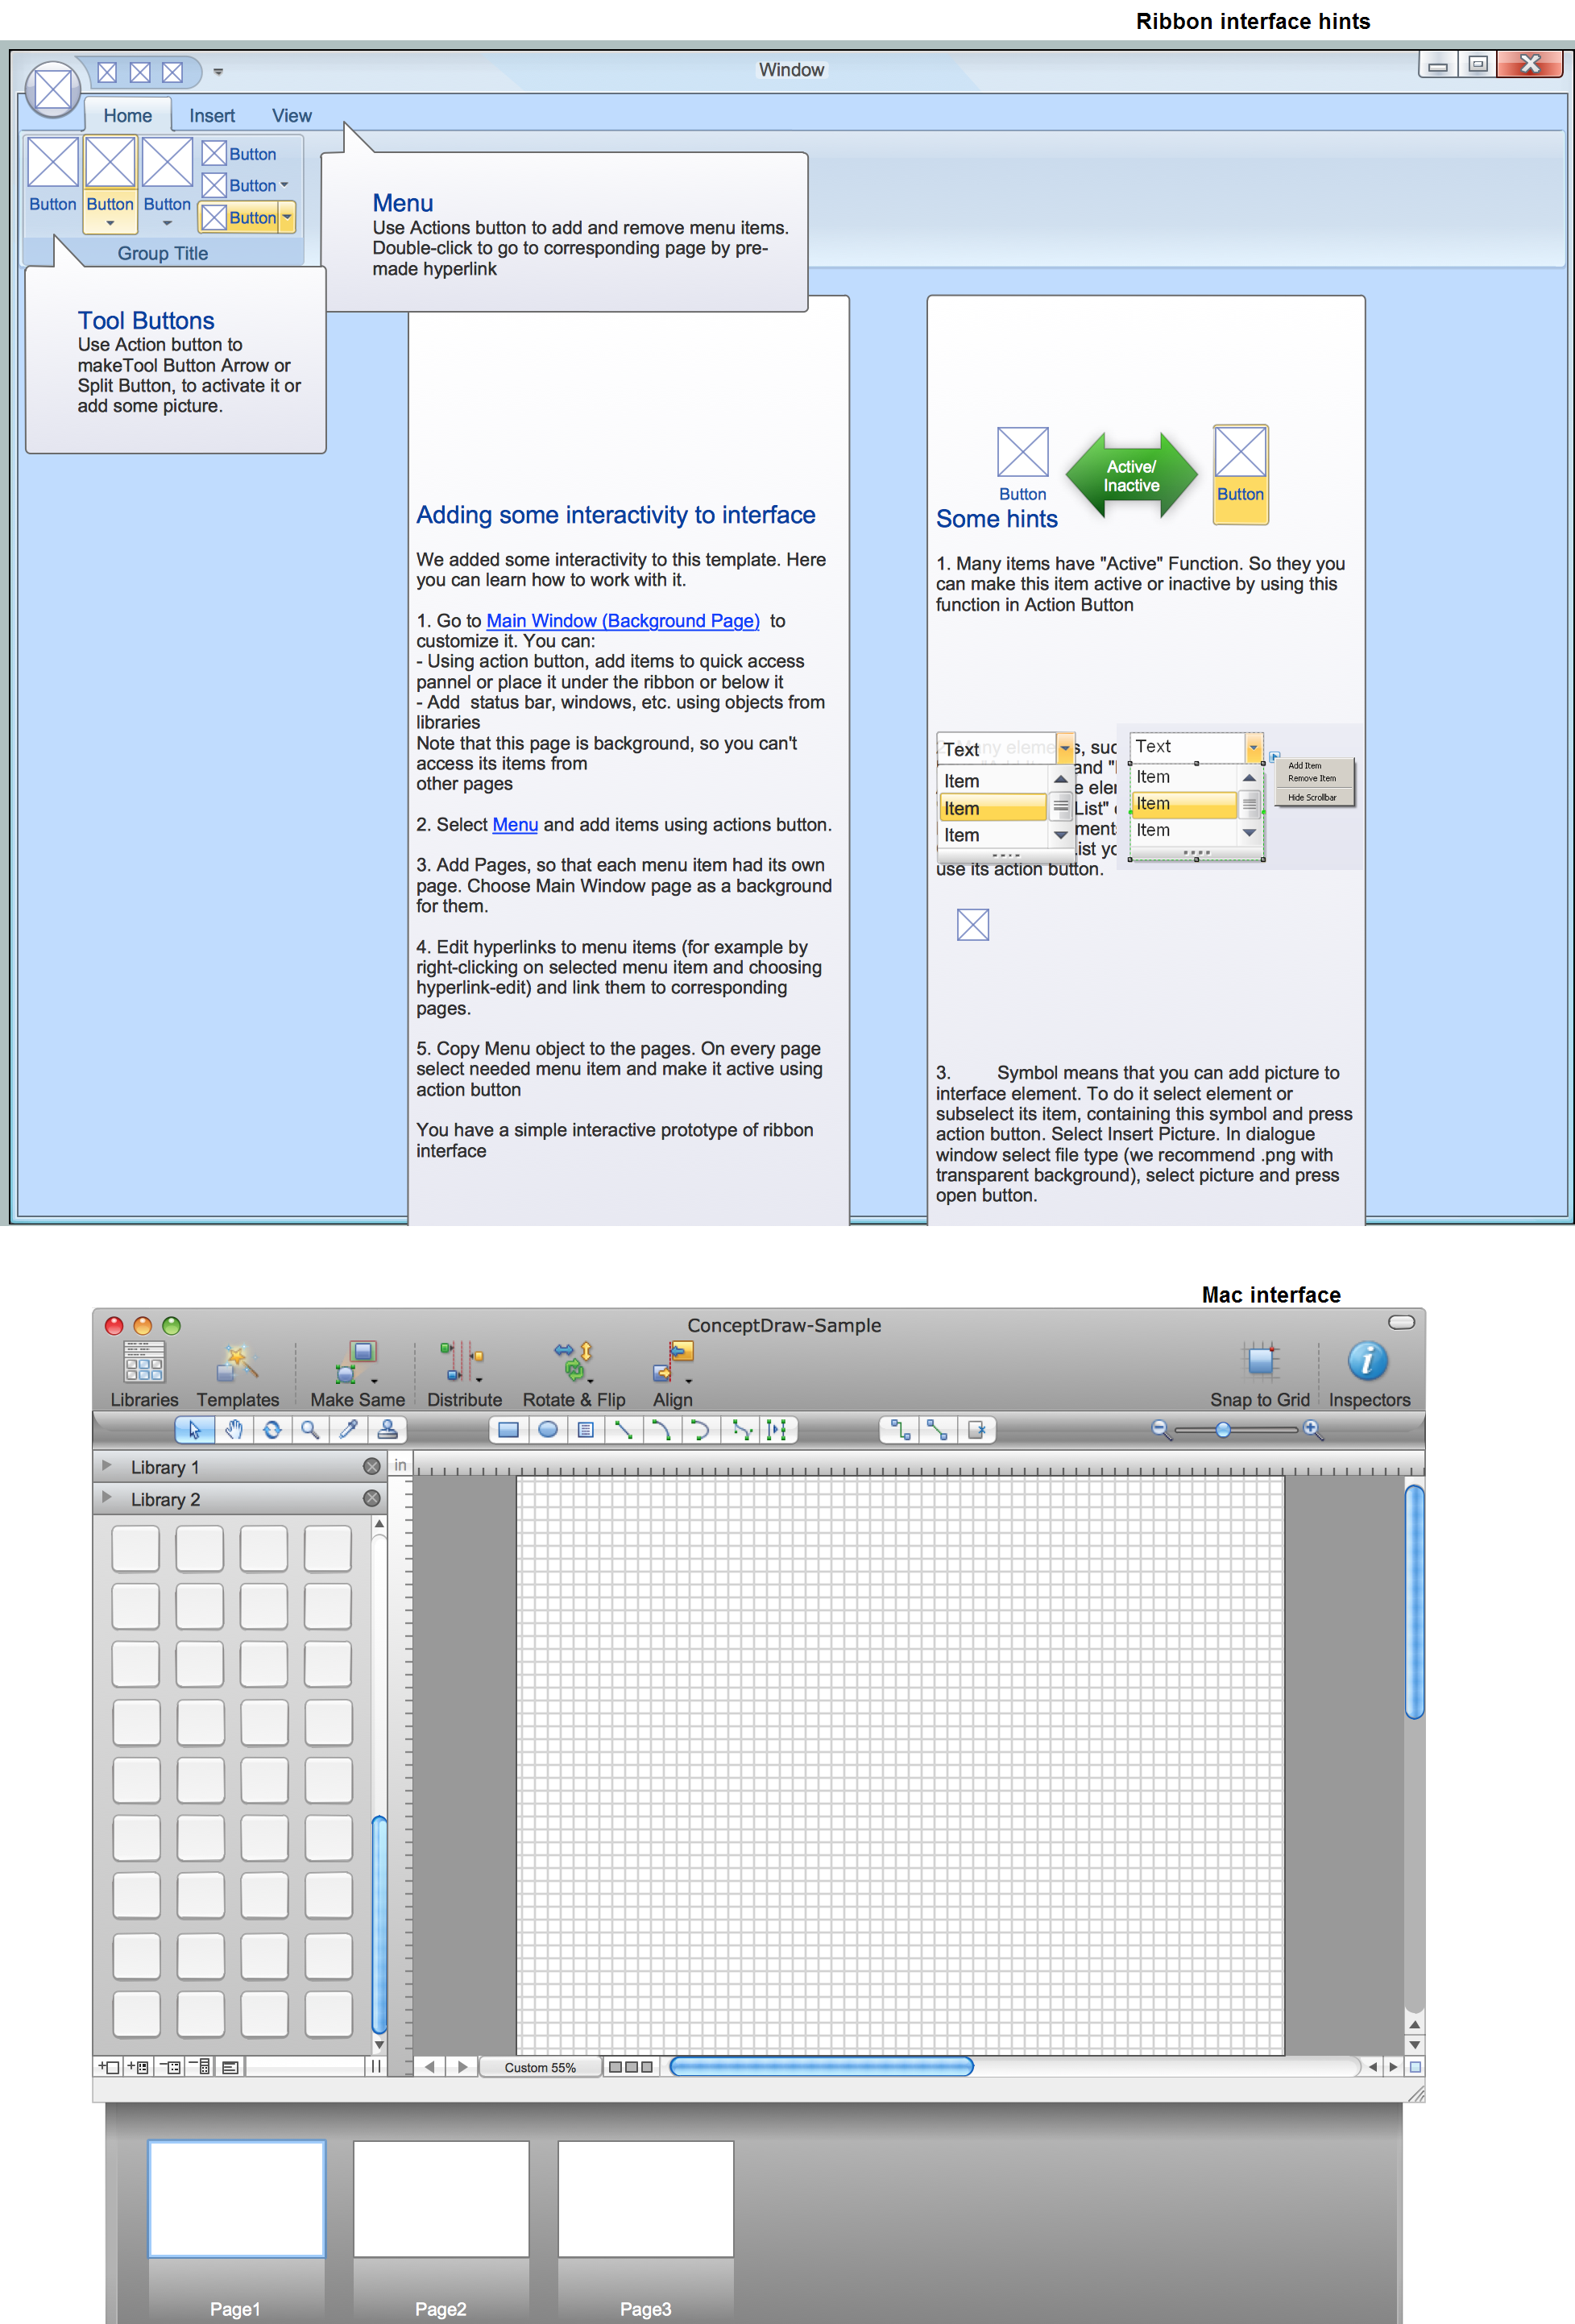
Example 1. GUI Interface — Mac and Ribbon
ConceptDraw DIAGRAM is a Perfect Tool for:
- Designing and planning tasks such as:
- Jacobson Use Cases Diagram
- SSADMN Diagram
- Yourdon and Coad Diagram
- Command OLE Diagram
- Block Diagrams
- Data Modeling Diagram
- SysML Diagram
- Chen RED Diagram
- Martin RED Diagram
- IDEF0 Diagram
- Booch OOD Diagram
- Gane Sarson Diagram
- Memory Object Diagram
- Data Flow Diagram
- FlowCharts
- UML Diagram
- Program Structure Diagrams
- ORM Diagram
- Developing Visualization Solutions
- Project Planning (Gantt Charts, Timelines, Project Schedules)