Applications
To understand what practical benefits you can reach with ConceptDraw DIAGRAM take a look at this range of articles. They describe the versatile possibilities of ConceptDraw DIAGRAM expedient applications.
 |
Network and System Diagramming | |
 |
Software and Database Design | |
 |
Business diagramming & Org Charts | |
 |
Web Site Planning and Design | |

|
Home and Landscape design | |
 |
Beneficial collaboration |
- Business flowchart tool
- Business flowcharting software
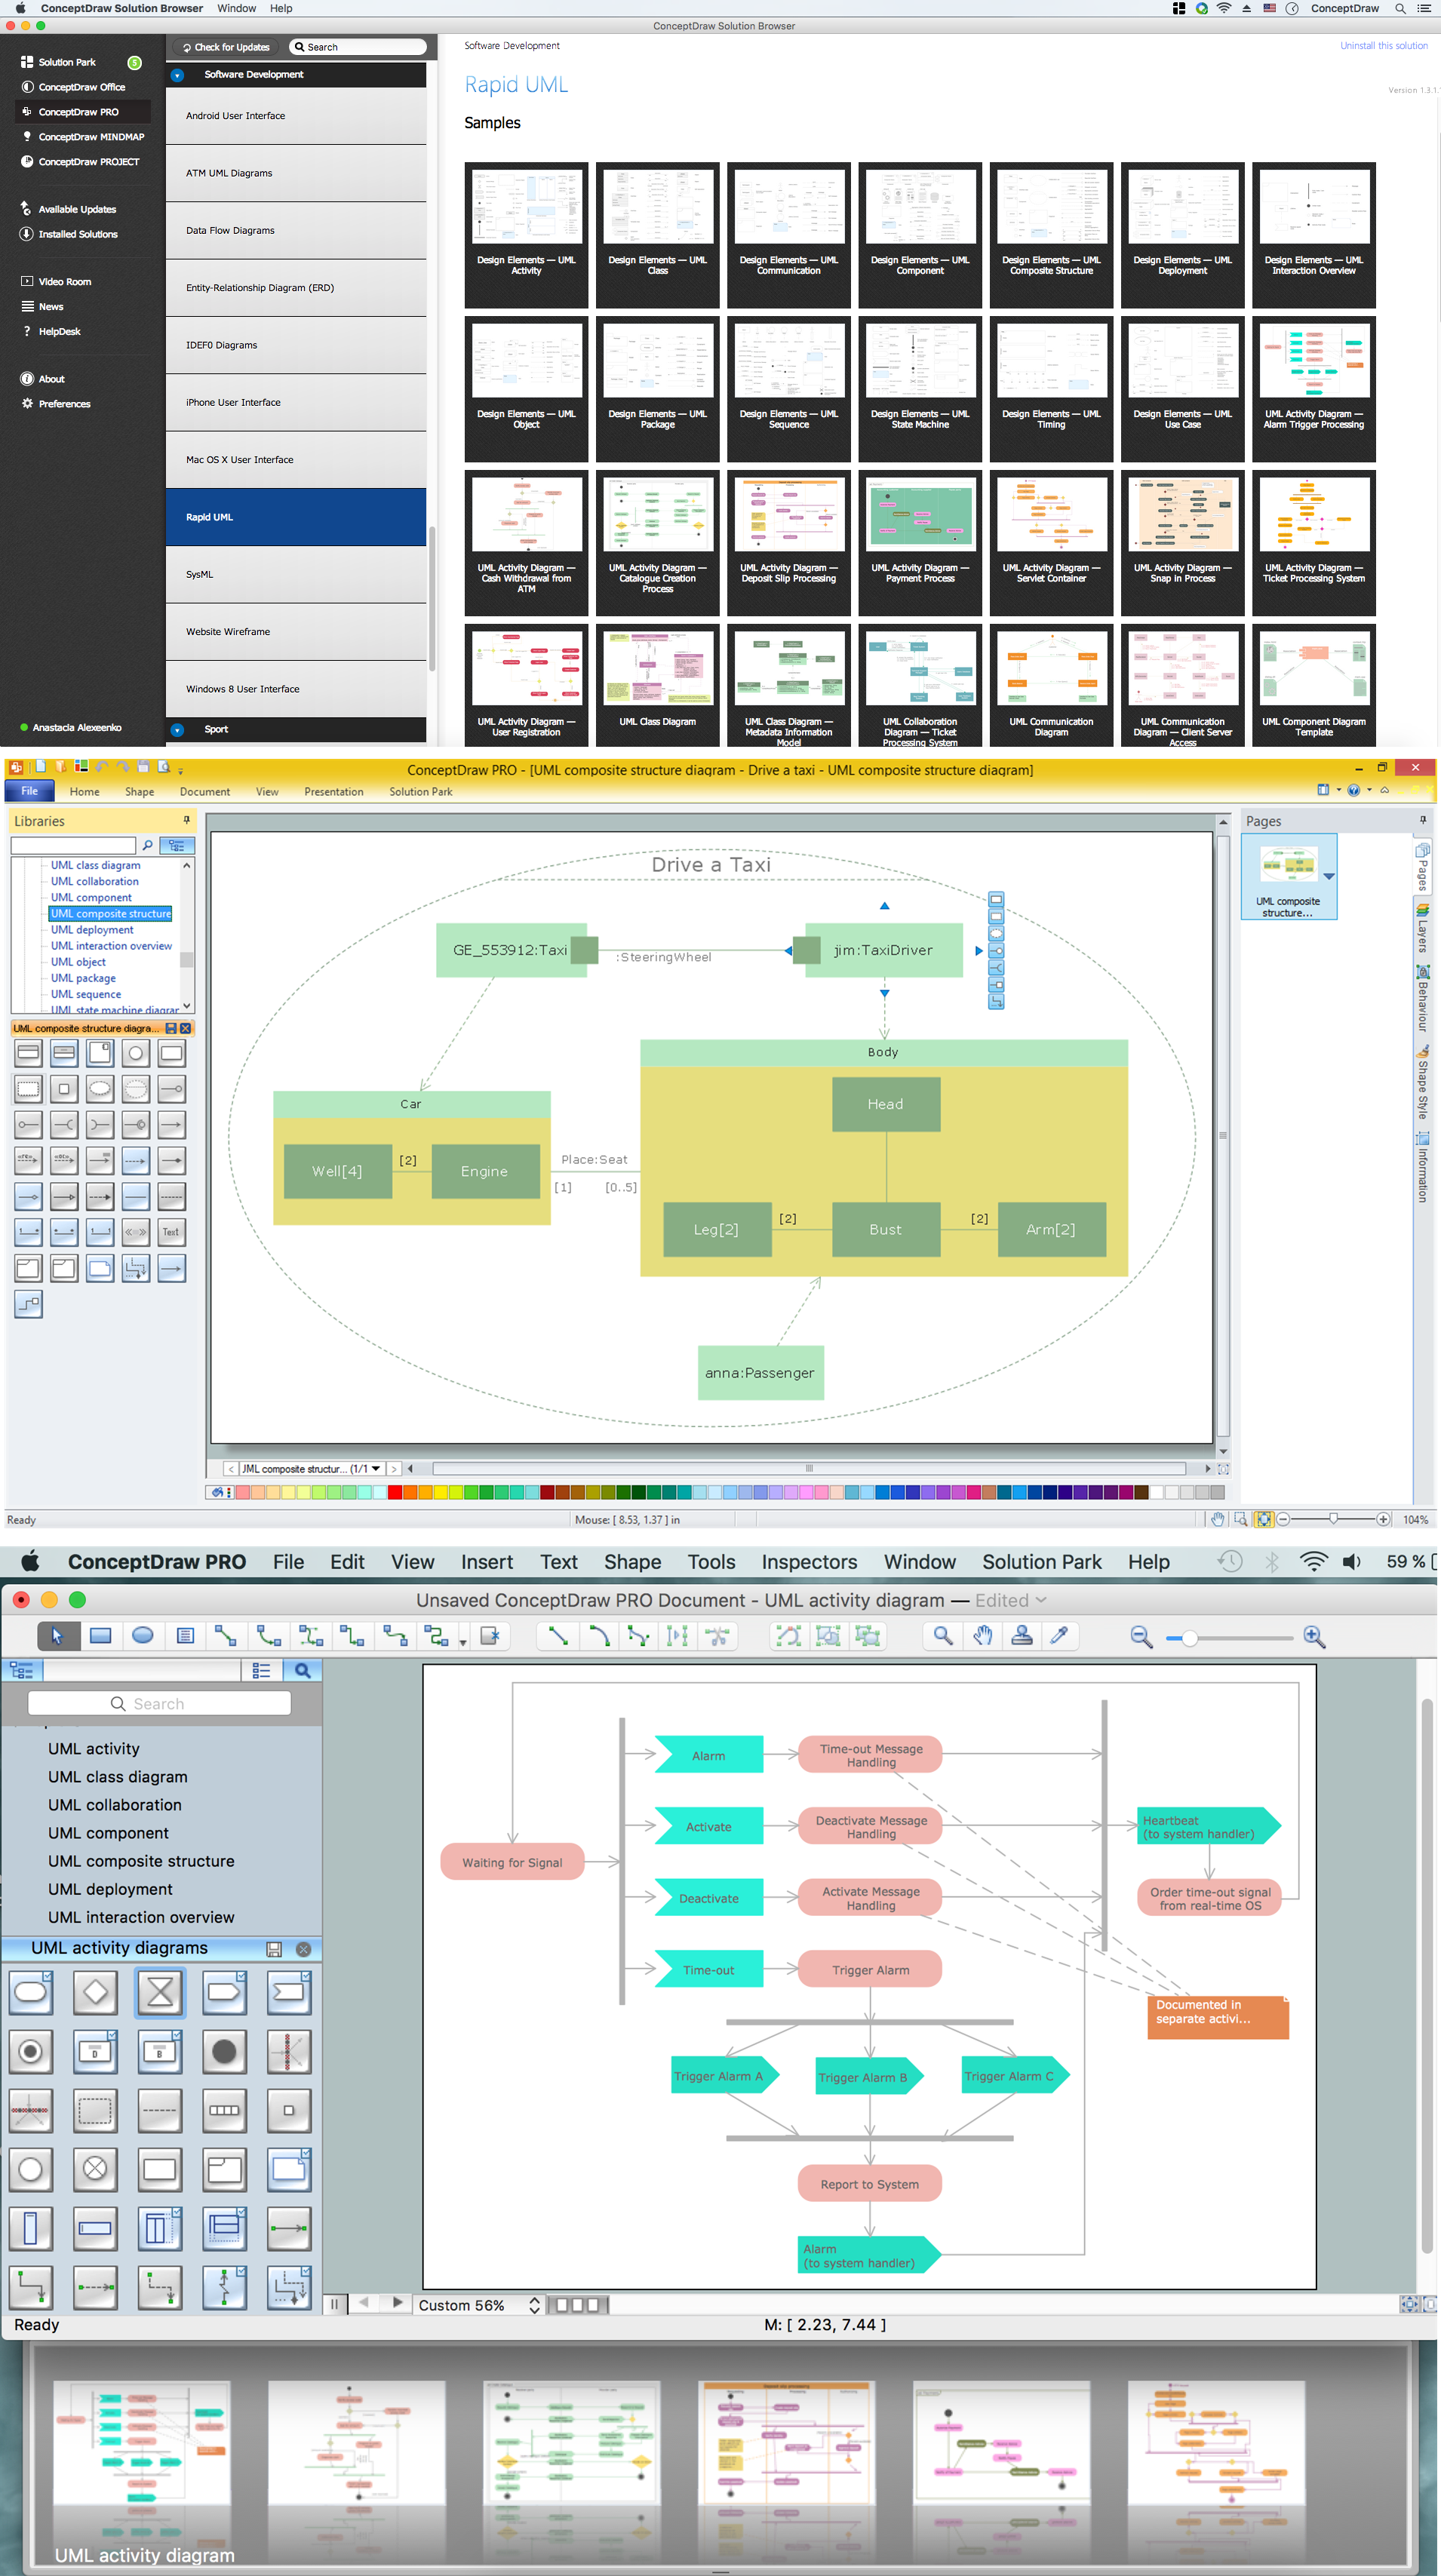
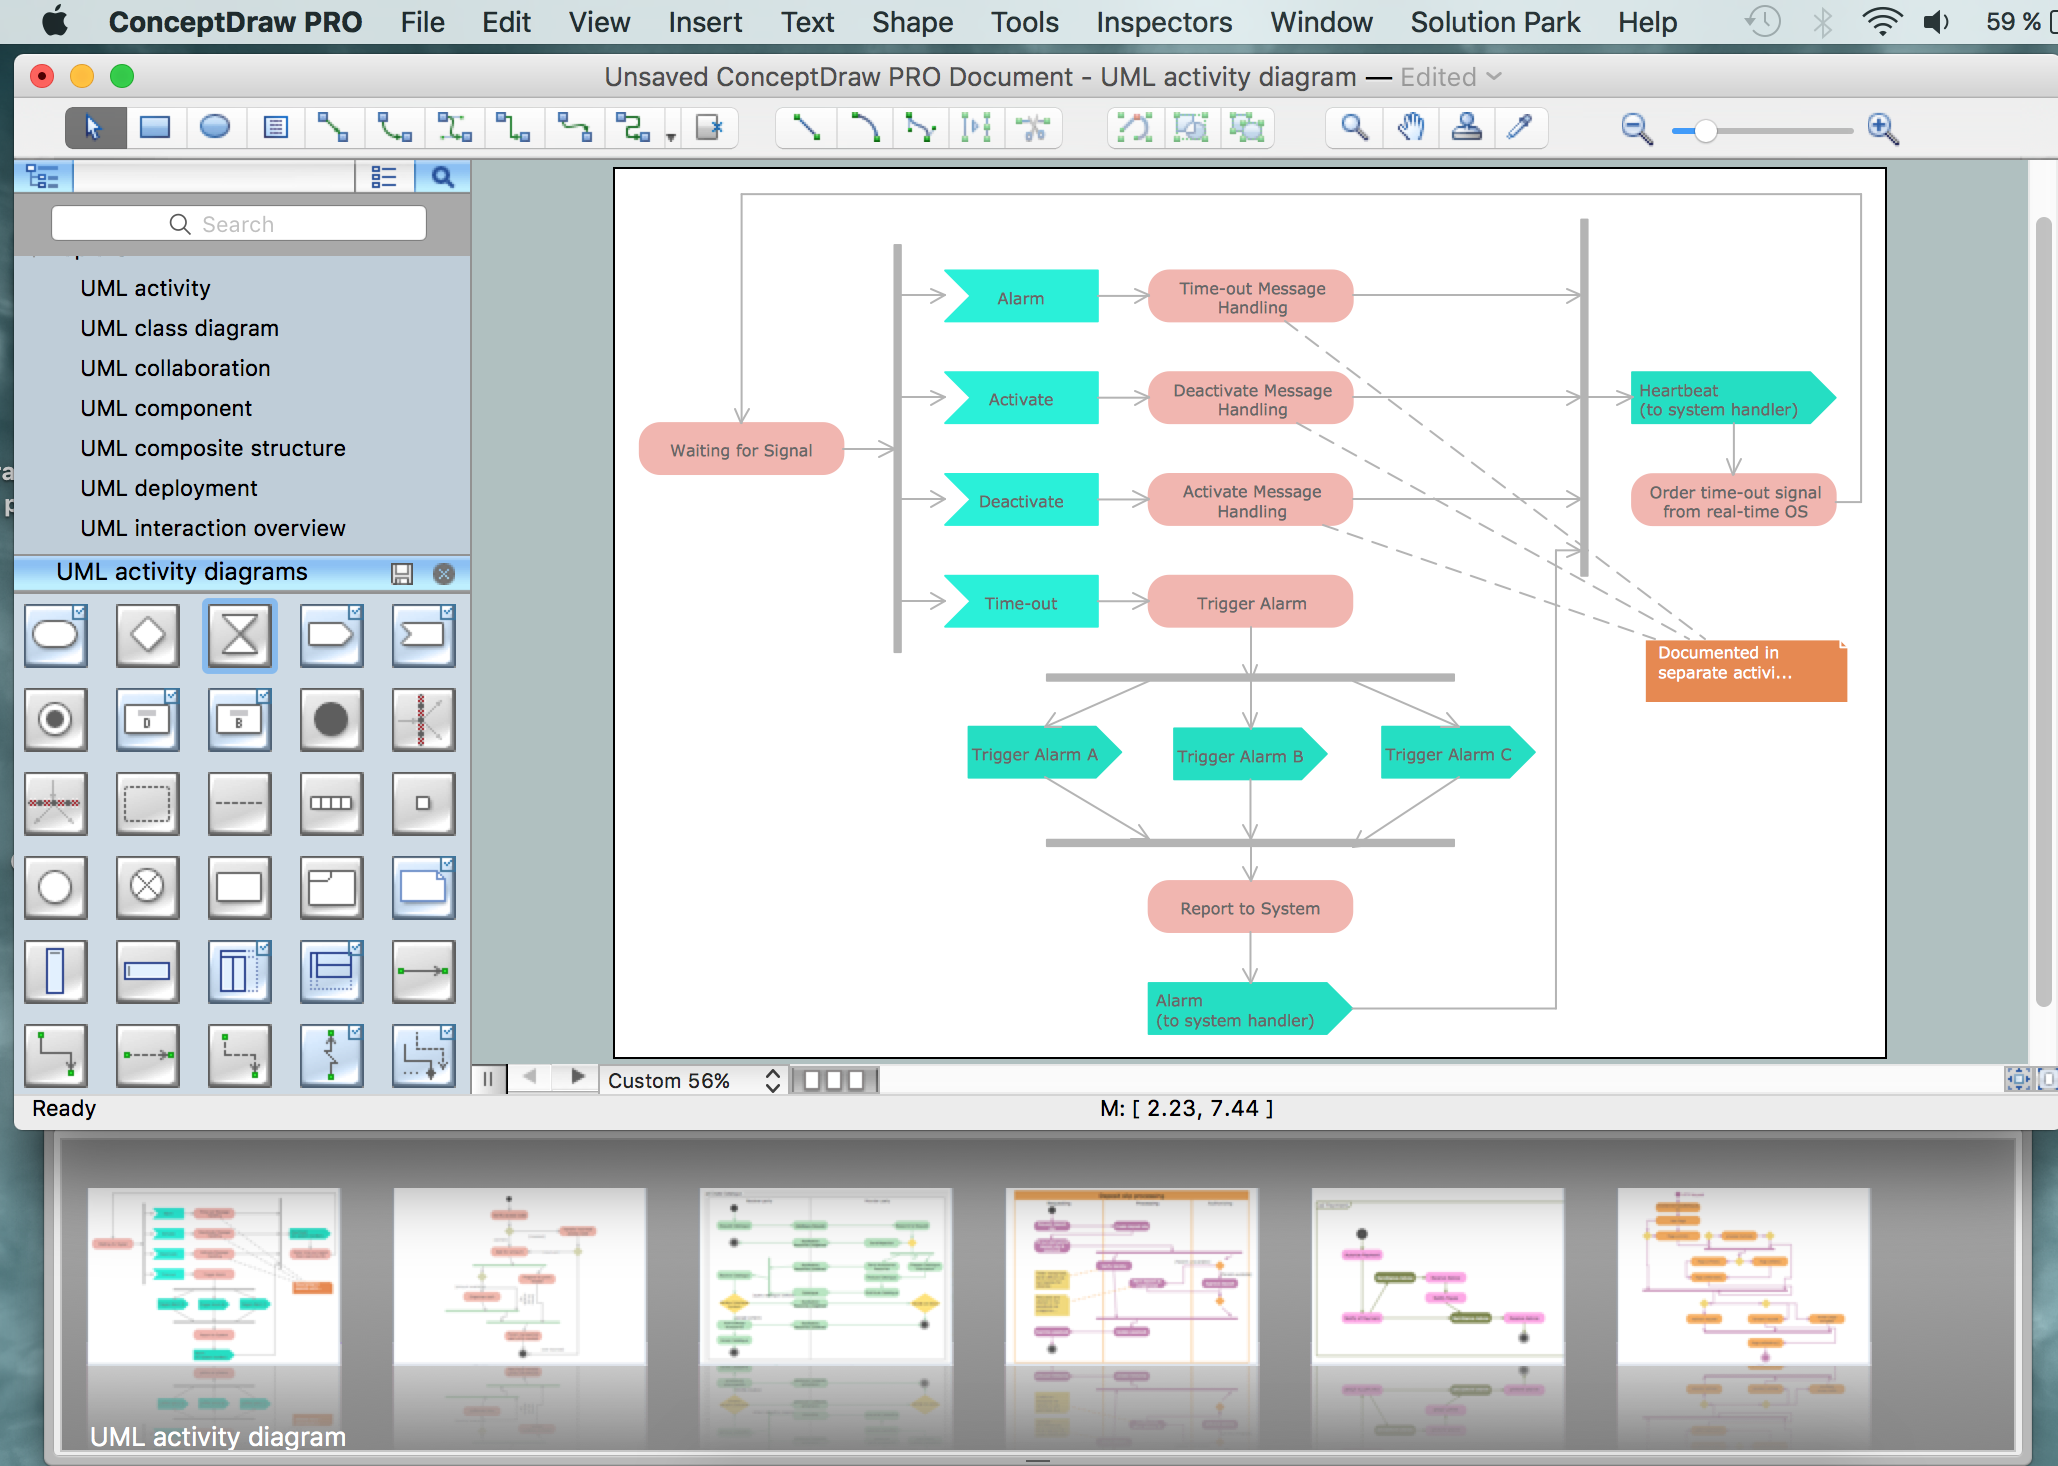
- UML modeling tool
- Data flow diagram software
- Data flow diagrams
- DFD software
- Network diagram tool
- Database modeling software
- ER Diagram tool
- Floor Plan software
- Organigram software
- Organization chart software
- Organizational chart software
- Business Drawing Software
- Technical Drawing Software
- Visualizing a FileMaker database in ConceptDraw
- ConceptDraw DIAGRAM connecting with databases
- The Review of Object Model Access to Databases
- GUI Prototyping with ConceptDraw
- ConceptDraw DIAGRAM as an alternative to MS Visio for MAC and PC
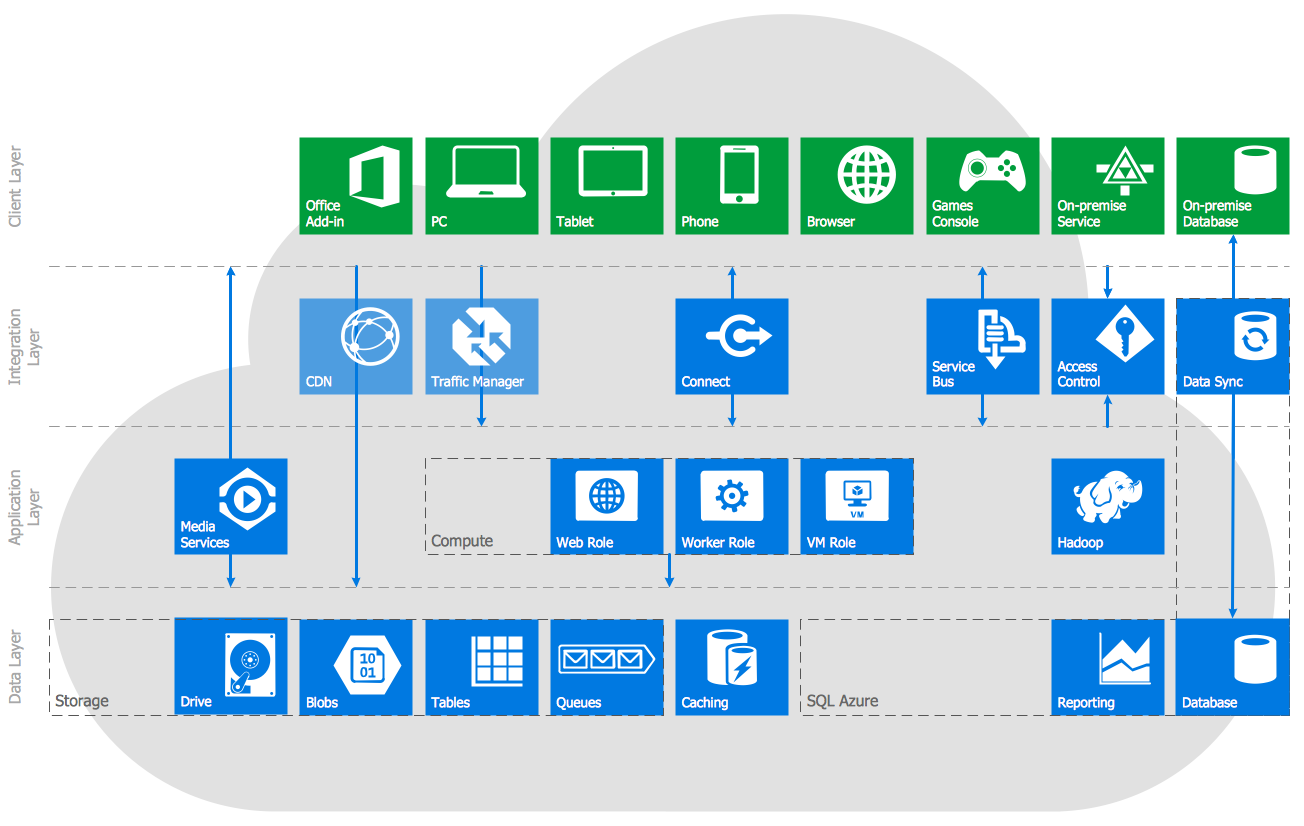
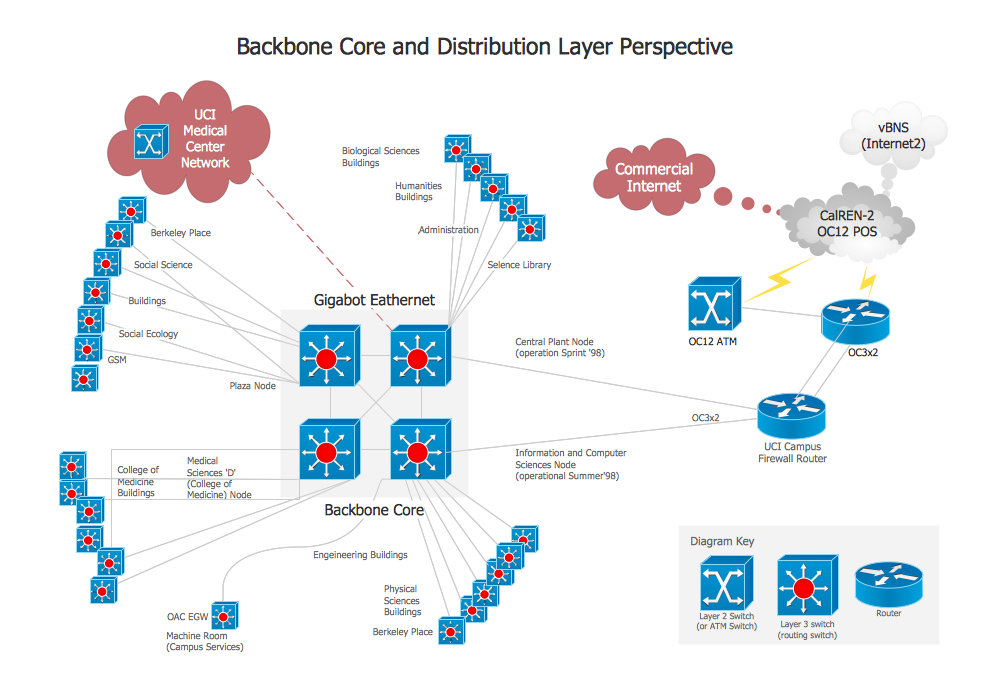
- visualization of network with the help of ConceptDraw
- Internet solutions on ConceptDraw base
- Development of software with the help of ConceptDraw
- Visualization of databases with the help of ConceptDraw
- Business diagramming & Org Charts
- Draw Organizational Structure
- Venn diagram
- Wiring (electrical) diagram
- Chore chart
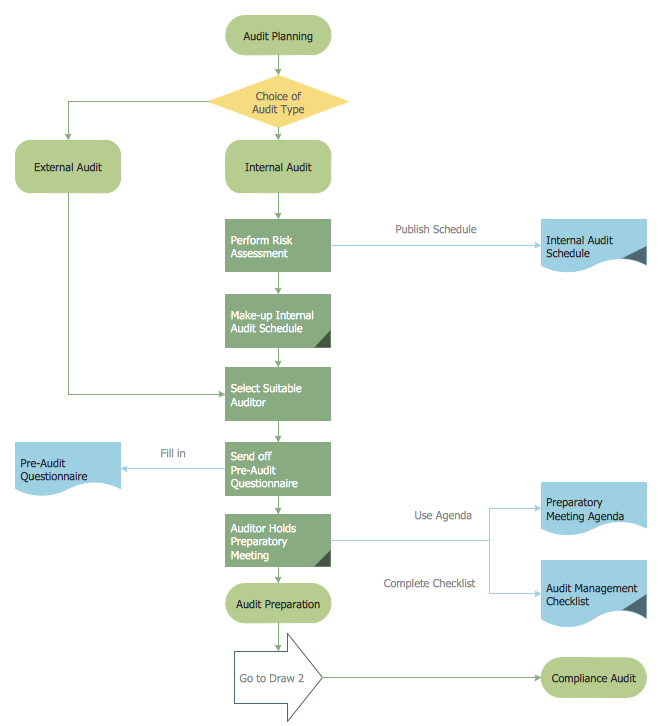
- Business Processes
- ConceptDraw UML
- ConceptDraw DIAGRAM ERD
- ConceptDraw DIAGRAM Flowchart
- ConceptDraw DIAGRAM Orgchart
- Use Case Diagrams technology
- Total Quality Management with ConceptDraw DIAGRAM
- Swim Lane diagrams
- Structured Systems Analysis and Design Method (SSADM)
- Network diagrams
- Garrett IA diagrams with ConceptDraw DIAGRAM
- Control and Information Architecture Diagrams (CIAD)
- Data flow diagrams
- Room planning with ConceptDraw DIAGRAM
- Program Evaluation and Review Technique (PERT)
- Data structure diagram
- Business Processes description with ConceptDraw DIAGRAM
- Active Directory diagram
- Building Plans
- Concept maps
- Bubble diagrams in Landscape Design
- Bubble diagrams
- Data modelling
- Value stream
- Work Flow Diagram
- IDEF 9
- IDEF 4
- IDEF 3
- IDEF 1X
- IDEF 1
- IDEF 0
The most popular items
|
|
UML Diagrams |
|
ER Diagrams |
|
Organization chart software |
|
Landscape architecture |