|
Diagram a network, draw Computer Network Diagrams, Designs, Schematics, Network Maps with our network diagram tool - ConceptDraw DIAGRAM in a couple of minutes! Pre-drawn shapes representing computers, network devices plus smart connectors help design diagram network, create accurate network diagrams and documentation to be used in your network diagram project.
Use ConceptDraw DIAGRAM as network design tool for drawing:
- Network Diagrams (wireless network diagram, diagram home network, network wiring diagrams, network cable diagrams, lan network diagrams, network topology diagrams, local network area diagrams, logical network diagrams, network physical diagrams, network security diagrams, activity network diagrams, network wiring cable diagrams, network wan diagrams, network voip diagrams, network cabling diagrams)
- Directory Services Diagrams (Active Directory, LDAP Directory diagrams)
Key Features:
- ConceptDraw is a network diagramming tool that includes task-specific libraries of highly detailed, accurate shapes and graphics of computers, servers, hubs, switches, printers, mainframes, face plates, routers etc. for computer networks, telecommunications, wireless Internet, power, storage and other equipment.
- Network design tool ConceptDraw DIAGRAM provides a convenient way of connection network components with intelligent smart-connectors.
- To design a network diagram use handy quick-start templates supplied by ConceptDraw DIAGRAM (for example Basic Network diagram, Logical Network diagram, Active Directory, LDAP Directory templates and others).
- When you work on a network diagram project with such a tool it's helpful to use multiple layers to separate different areas of visibility. There are also hyperlinks for multi-page documents.
- After you have diagrammed a network you can export it to graphic formats as PDF, Power Point, Flash, and HTML with hyperlinks.
- Use Custom properties for storing detailed information on network equipment during your work with ConceptDraw DIAGRAM
- The built-in ConceptDraw Basic scripting language is for custom integration of your diagram with any data sources.
Computer Network Diagram
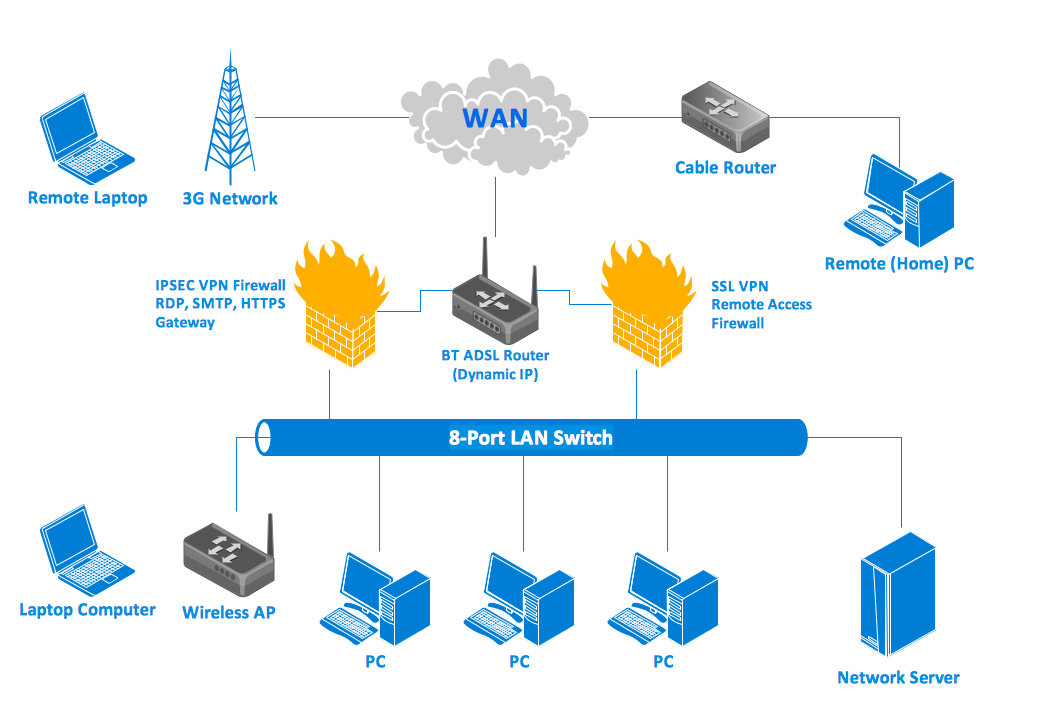
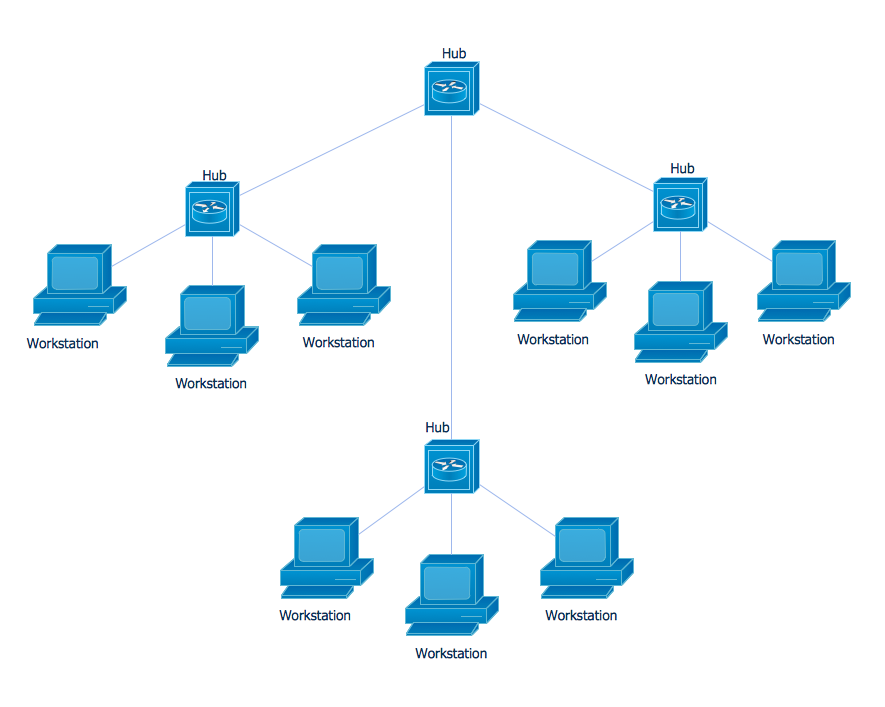
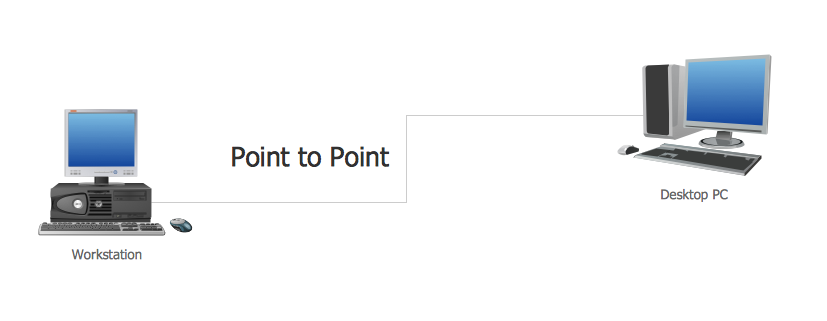
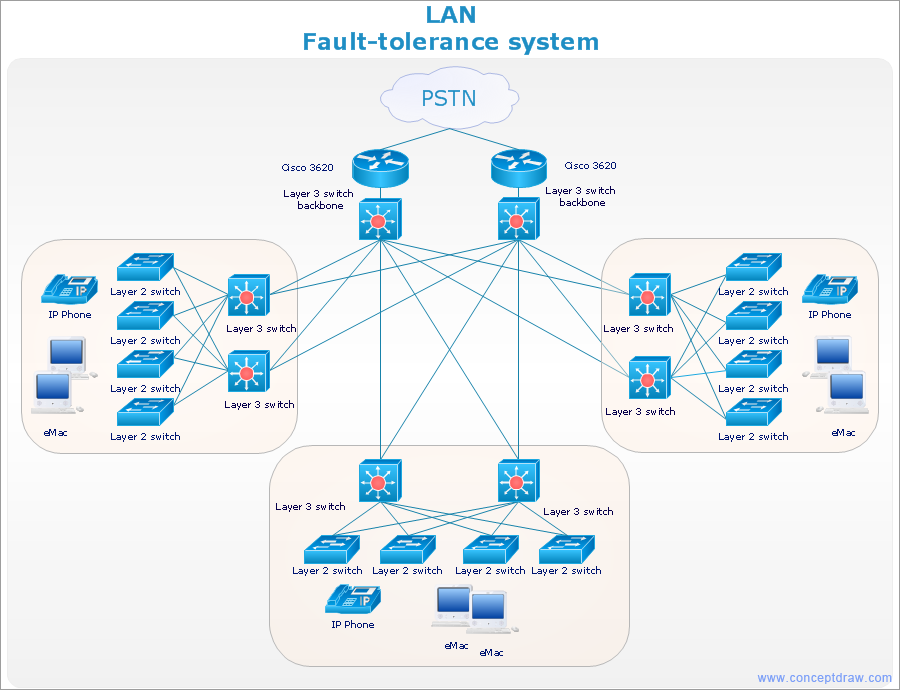
- With ConceptDraw DIAGRAM you can diagram a network or create a computer network diagram using specialized libraries of network components such as computers, hubs, smart connectors etc. that simulate network design topologies and devices, network architectures (all these shapes are parts of network diagram tool ConceptDraw DIAGRAM
- For CISCO specific network drawing diagrams, ConceptDraw DIAGRAM is supplied with CISCO specific diagrams shape library.
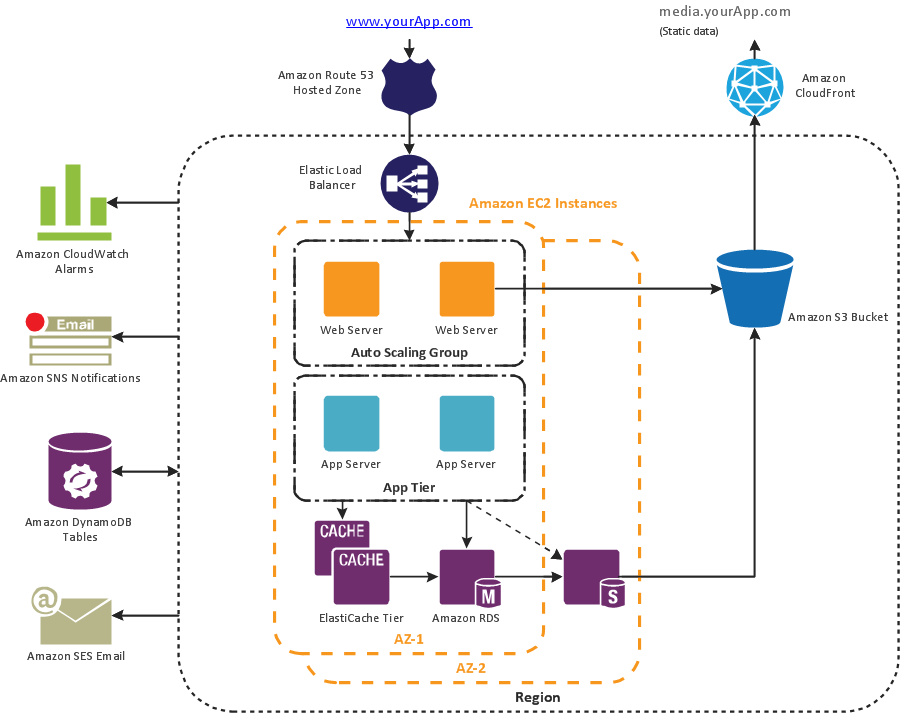
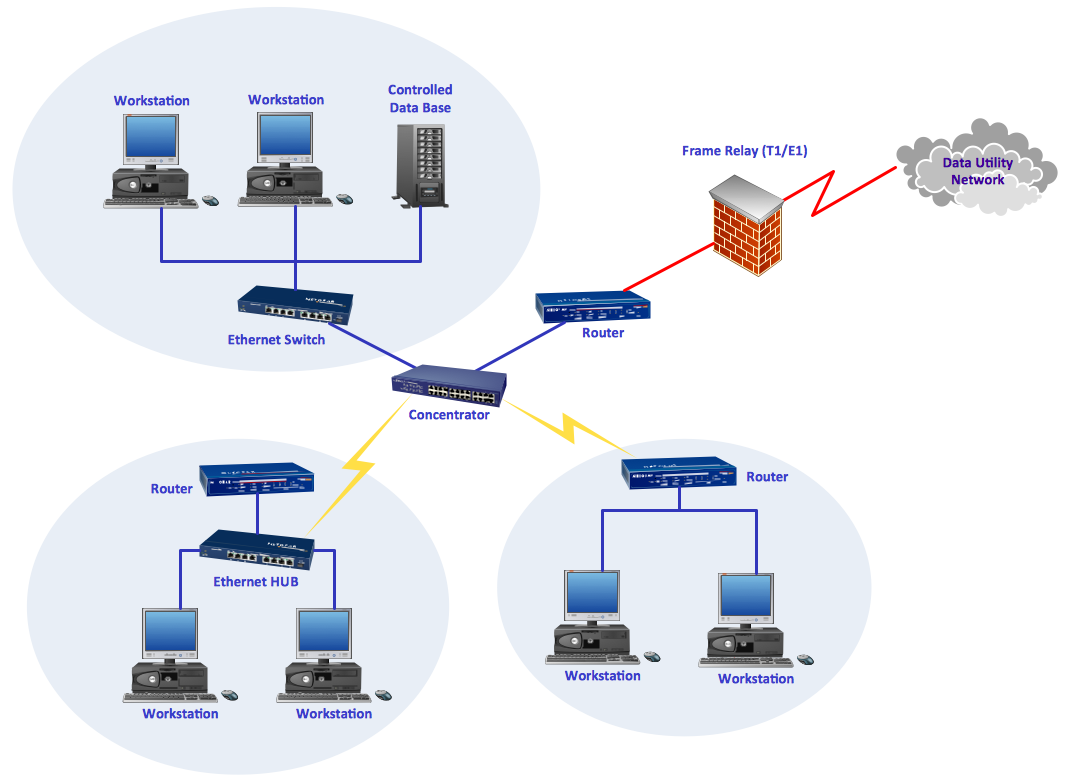
- With ConceptDraw DIAGRAM you can draw a detailed network diagram where you can visually show the way network equipment is logically and physically connected and arranged in a room, office, or building.
- You can create a complex network diagram that consists of different Concept Draw diagrams, each with specified level of detail, connected by hyperlinks.
You can easily connect network topology shapes by using smart connectors that can be visually attached to library shapes. After you have joined the device and connector your device remains connected even if you want to move it somewhere. You can store data, such as network name and IP address, manufacturer's name, product number, serial number, price and other information with the shapes. This information can be used in ConceptDraw Basic scripting language for automatic calculations.
Also you can use ConceptDraw Basic scripting language for receiving up-to-date information from manufactory databases.
ConceptDraw DIAGRAM makes it simple to share your network diagram project with others in a business presentation or on the web.
Directory service diagrams
With directory service templates in ConceptDraw DIAGRAM you can:
- Draw and design new directories visually changing the structure of already existing ones.
- Easily change location of your network drawing components, plan, update, and migrate programs by using the design of the directory structure.
ConceptDraw DIAGRAM has all necessary Active Directory Sites and Service shapes, Directory connectors to show relationships between domains, sites, and services on the network. These shapes are designed to be used in planning a directory or a network, or for planning distribution and replication of information among different servers at different sites.
|

_Win_Mac.png)