How should diagramming software work? Is it possible to develop a diagram as quickly as the ideas come to you?
The innovative ConceptDraw Arrows10 Technology included in ConceptDraw DIAGRAM is a powerful drawing tool that changes the way diagrams are produced. While making the drawing process easier and faster.
ConceptDraw DIAGRAM is a powerful tool that helps you create a process map diagram quickly and easily. Fine-tuning the objects in ConceptDraw DIAGRAM allows you to create a really professional finished article. ConceptDraw Arrows10 Technology gives drawing connectors a smart behavior that provides quick and precise placement, allows for easy changes and automatic rearrangement.
Auto-connection mode automatically connects objects as they are added to the page.
The auto-connection mode has two settings you can select “tree” or “chain” mode.
Just select the appropriate mode and then start adding basic shapes or shapes from a selected library into your diagram.
While creating your diagram with one of auto-connection modes all the shapes stay selected, so you can switch between the modes or change connector types without having to reselect.
You can switch between “chain” and “tree” modes to produce a diagram of any complexity, or change the connection type for an existing diagram.
If you have already placed objects in your drawing just select them and press Tree or Chain button to connect all of them just in one click.
Sample 1. Bubble diagram - Employee needs.
ConceptDraw DIAGRAM diagramming software provides vector shapes and connector tools for quick and easy drawing diagrams for business, technology, science and education.
Use ConceptDraw DIAGRAM enhanced with solutions from ConceptDraw Solution Park to create diagrams to present and explain structures, process flows, logical relationships, networks, and other visually organized information and knowledge.
The innovative ConceptDraw Arrows10 Technology included in ConceptDraw DIAGRAM is a powerful drawing tool that changes the way diagrams are produced.
While making the drawing process easier and faster.
This is more than enough versatility to draw any type of diagram with any degree of complexity.
Picture: How to Dramatically Reduce Drawing Time - New connection modes
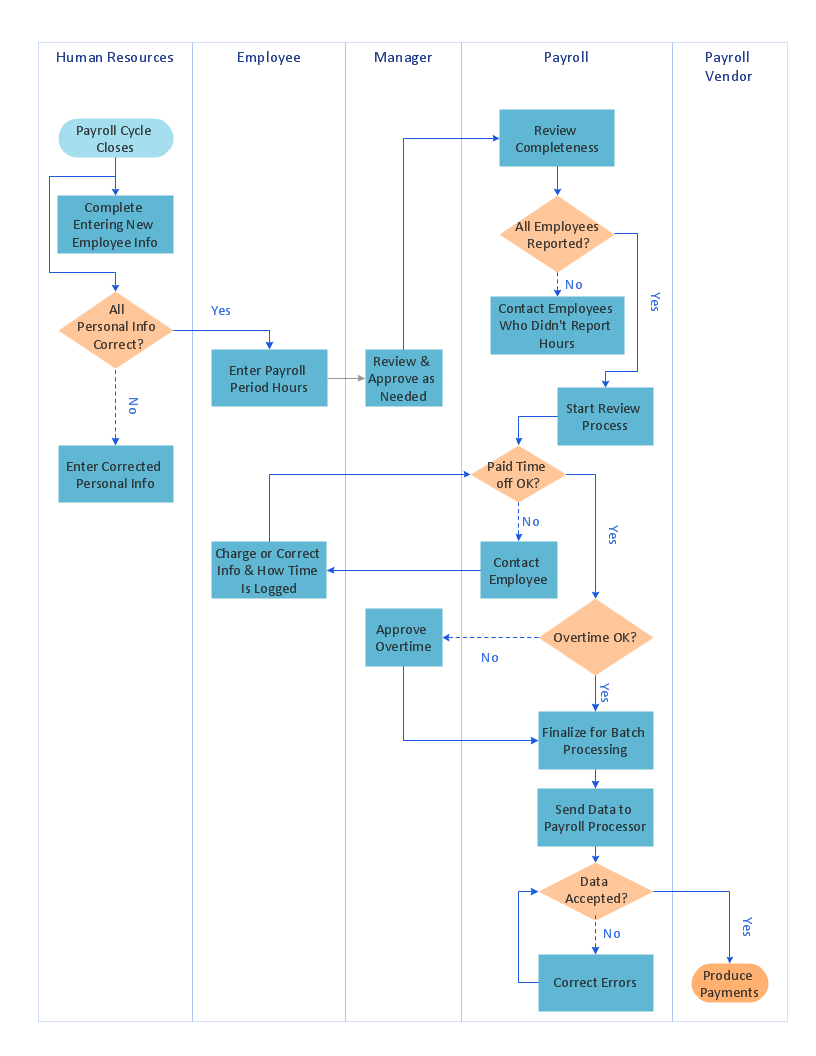
Any business process consists from a number of tasks carrying out the certain business goal. It is useful to diagram business processes to ensure that they are as foolproof, logical and sequential as possible. This business process diagram describes a typical booking process flow by the example of a cab booking process. It can be used as a roadmap for any booking system implementation. Diagramming a business process allows you to look at the entire project and take into account all types of possible scenarios. Business process diagram helps you investigate and clarify the process thoroughly so that you can find out how it can be improved. Business process diagram supports team communications by ensuring that each process element is clear and everyone in the team is on the same page.
Sometimes your company brings you less profit than you expect it to be, and it’s difficult to reveal the causes. Maybe it’s time to learn new technologies, because business diagram are easily developed by means of special software, so you won’t make any extra effort. In return, you will increase your productivity and get more done in a less time.
Is it possible to develop a diagram as quickly as the ideas come to you? The innovative ConceptDraw Arrows10 Technology included in ConceptDraw DIAGRAM is a powerful drawing tool that changes the way diagrams are produced.
While making the drawing process easier and faster.
Flow chart is a diagrammatic representation of an algorithm and essential part of planning the system. Flow charts are widely used in technical analysis and programming for easy writing programs and explaining them to others. So, one of the most popular type of flow charts is Technical Flow Chart.
Technical Flow Chart can be drawn by pencil on the paper, but it will be easier to use for designing a special software. ConceptDraw DIAGRAM diagramming and vector drawing software extended with Flowcharts Solution from the Diagrams Area of ConceptDraw Solution Park will be useful for this goal.
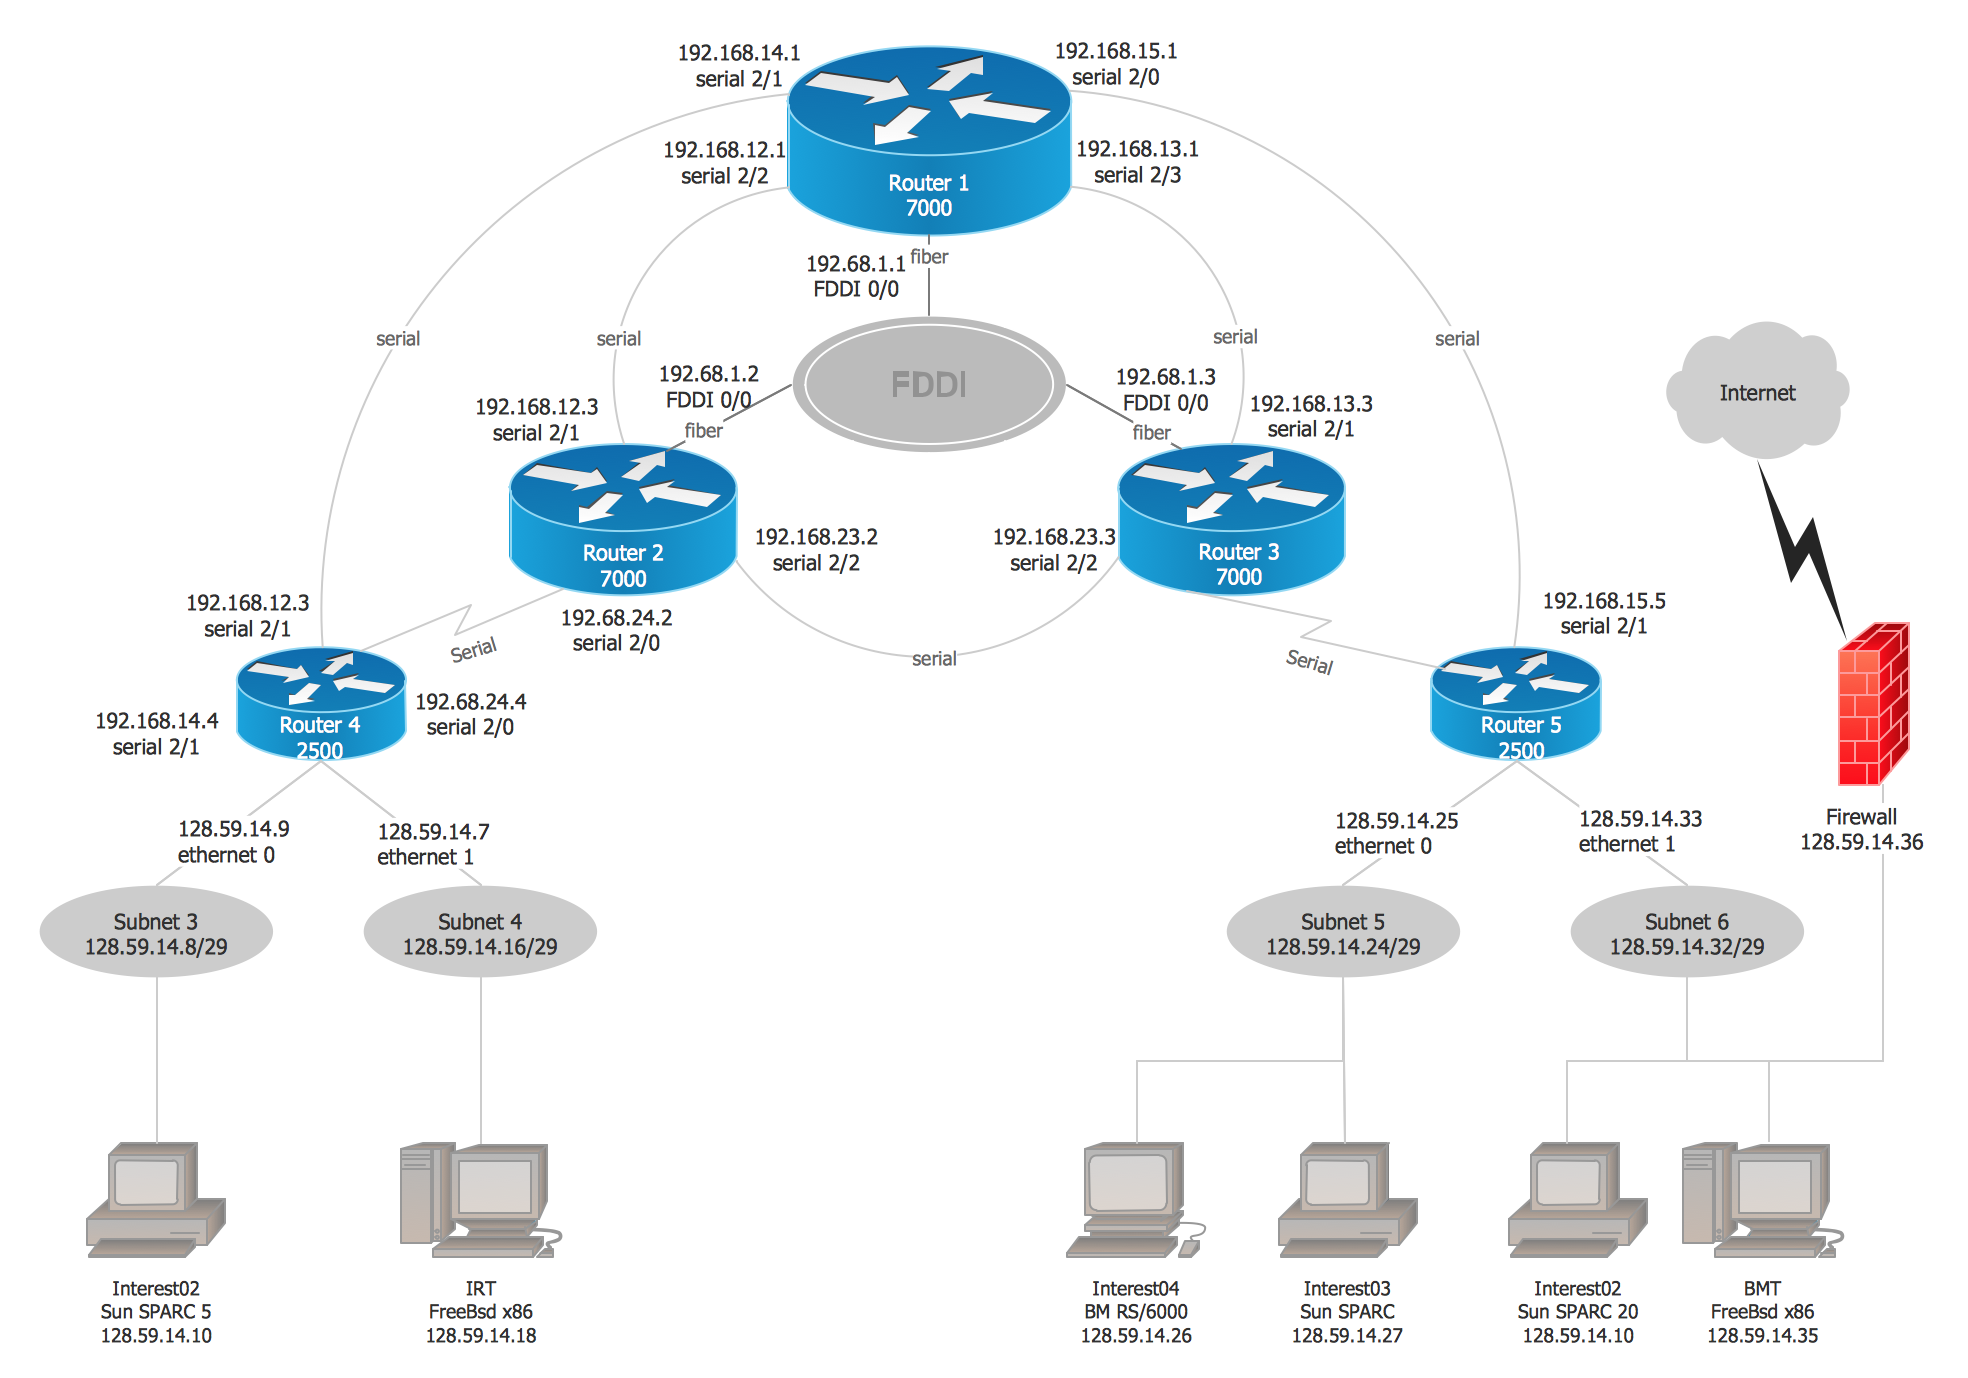
Computer networks nowadays are spread all across the world. The large number of parameters, such as geographic scale or communication protocols, can divide networks. One of the most common types of networks is called local area network (LAN). It convenient to represent network examples by means of diagrams.
This local area network (LAN) diagram provides an easy way to see the way the devices in a local network are interacted. The diagram uses a library containing specific symbols to represent network equipment , media and the end-user devices such as computers (PC, mac, laptop) , network printer, hubs, server and finally a modem. There are two types of network topologies: physical and logical. The current diagram represents precisely a physical type of LAN topology because it refers to the physical layout of a local network equipment.
If you ever wanted to try any diagramming tools except of Visio, but were afraid to lose existing documents, there’s good news for you. One of the most striking features of ConceptDraw DIAGRAM is it’s perfect compatibility with MS Visio, which guarantees that you won’t depend on operating system anymore, because another ConceptDraw DIAGRAM feature is that it’s cross-platform tool. Don’t waste your time looking for other options, you’ve found the solution already!
Business professionals often utilize the MS Visio as a common tool for making various issues on business visualization. MS Visio is a strong software with good capacity to maintain complex business solutions. But there is no MS Visio for Apple OS X. This is a large invocation, and one would be pleased to recognize that ConceptDraw DIAGRAM is the ideal alternative to MS Visio. Primarily, because this software works natively on both Windows and Apple OS X platforms. if you have migrated from Windows to Mac, or need to communicate in a cross-platform conditions, you’ll search for MS Visio replacer. ConceptDraw DIAGRAM is the exclusive professional business diagramming application that runs on both Windows and Apple OS X. The opportunity exchange files between PC and Mac, as well as between ConceptDraw DIAGRAM and Visio is the significant advantage that permits you to display and to collaborate business information in effortless and cost-effective way.
Picture: ConceptDraw DIAGRAM Compatibility with MS Visio
If you want to find a way to understand complex things in minutes, you should try to visualize data. One of the most useful tool for this is creating a flowchart, which is a diagram representing stages of some process in sequential order. There are so many possible uses of flowcharts and you can find tons of flow charts examples and predesigned templates on the Internet. Warehouse flowchart is often used for describing workflow and business process mapping. Using your imagination, you can simplify your job or daily routine with flowcharts.
Warehouse flowcharts are used to document product and information flow between sources of supply and consumers. The flowchart provides the staged guidance on how to manage each aspect of warehousing and describes such aspects as receiving of supplies; control of quality; shipment and storage and corresponding document flow. Warehouse flowchart, being actual is a good source of information. It indicates the stepwise way to complete the warehouse and inventory management process flow. Also it can be very useful for an inventory and audit procedures.
The Cisco Network Diagrams solution from the Computer and Networks area of ConceptDraw Solution Park provides a wide collection of predesigned templates and samples that help you to create the Cisco Network Diagrams in one moment.
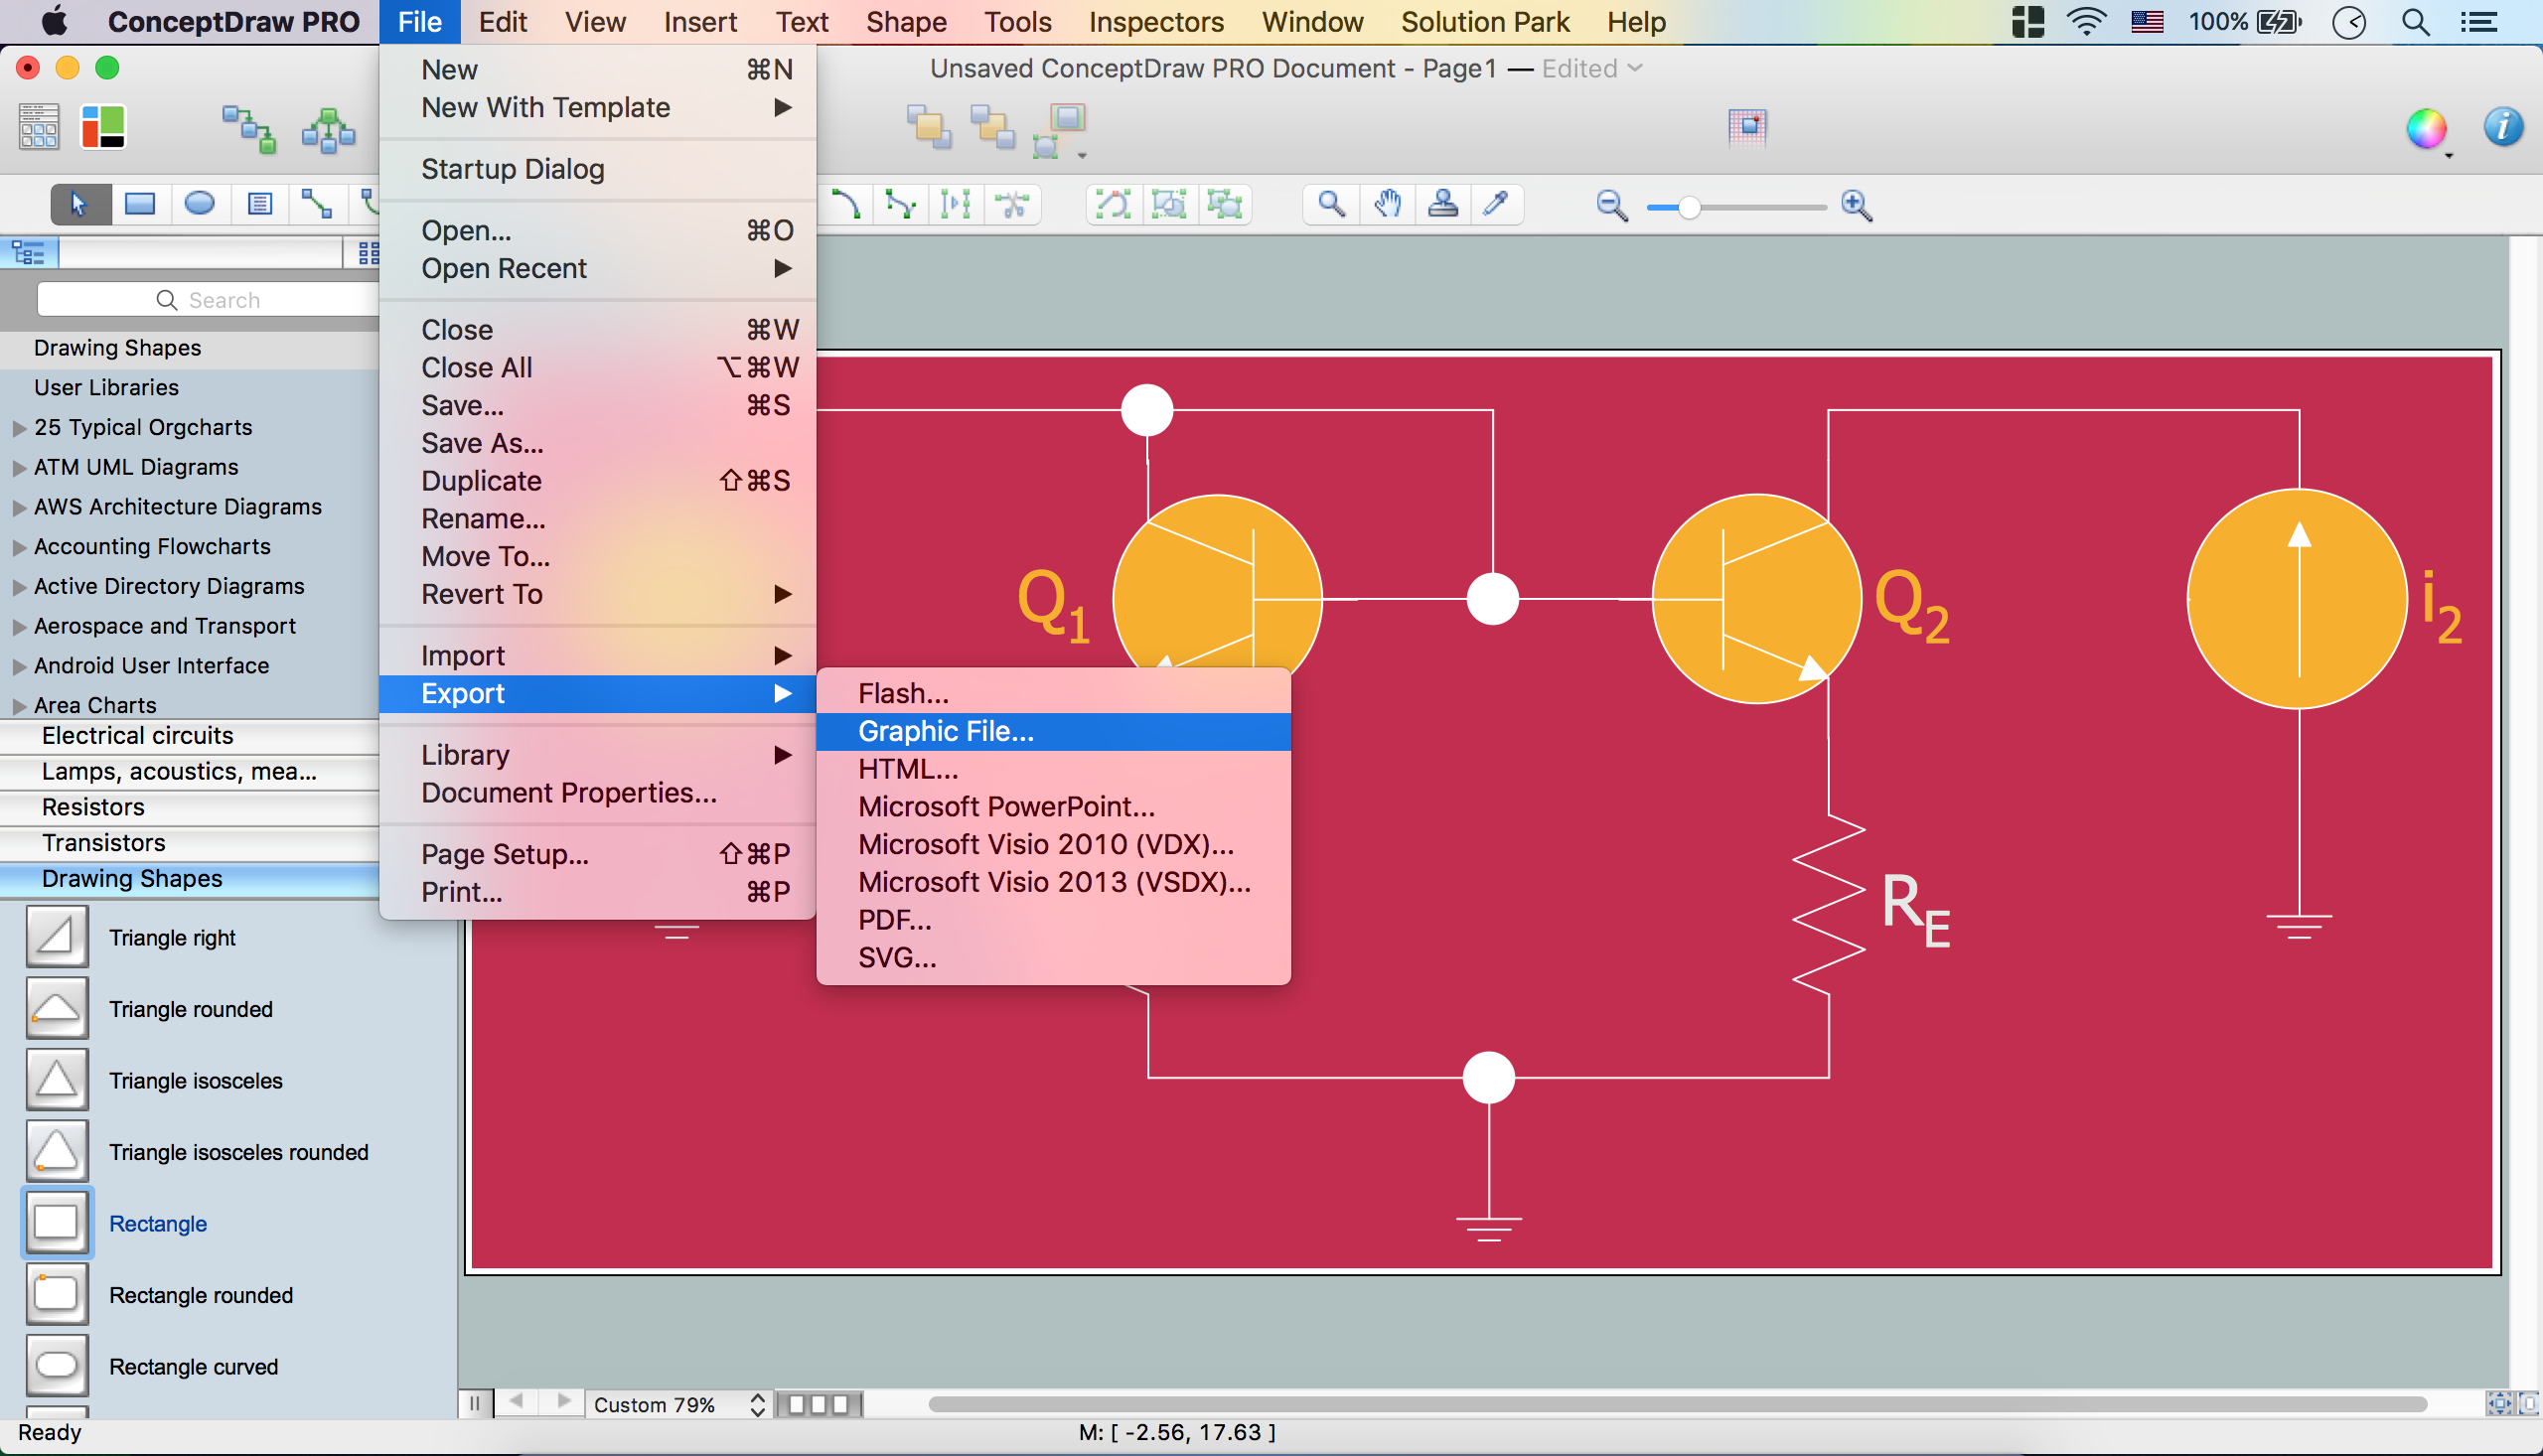
Beginning from the 19th century, people tried to tame electricity. Nowadays, electrical engineering covers a wide range of applications starting from providing illumination in our homes to developing space technologies. Considering the fact that every project needs documentation, engineers use electrical diagram software to develop these projects. Standard electrical symbols of electrical components are recognizable all around the world.
This illustration represents the 26 libraries that are supplied by the ConceptDraw Electrical Engineering solution. The Electric Engineering libraries contains about a thousand objects enabling you to draw various charts depicting electrical connections and circuits, along with schemes of different equipment and devices. The electric engineering libraries delivered with ConceptDraw solution meet the standards adopted in the image to electrical circuits. So they can be used by professionals along with amateurs in electrical engineering.