Cisco LAN.
Cisco icons, shapes, stencils and symbols
The ConceptDraw vector stencils library "Cisco LAN" contains 23 symbols for drawing the computer local area network diagrams using the ConceptDraw DIAGRAM diagramming and vector drawing software:
- SUN workstation
- Workstation
- PC
- Macintosh
- Terminal
- Mini or VAX/VSM with DECnet
- Printer
- Laptop
- File / application server
- Monitor
- Web cluster
- ATM Fast Gigabit Etherswitch
- HP Mini
- Supercomputer
- LAN2LAN
- LAN to LAN
- Web server
- Web browser
- Repeater
- PDA
- Intelligence Engine 2100 Series
- PC, blue
- Mini or VAX/VSM with DECnet, Blue
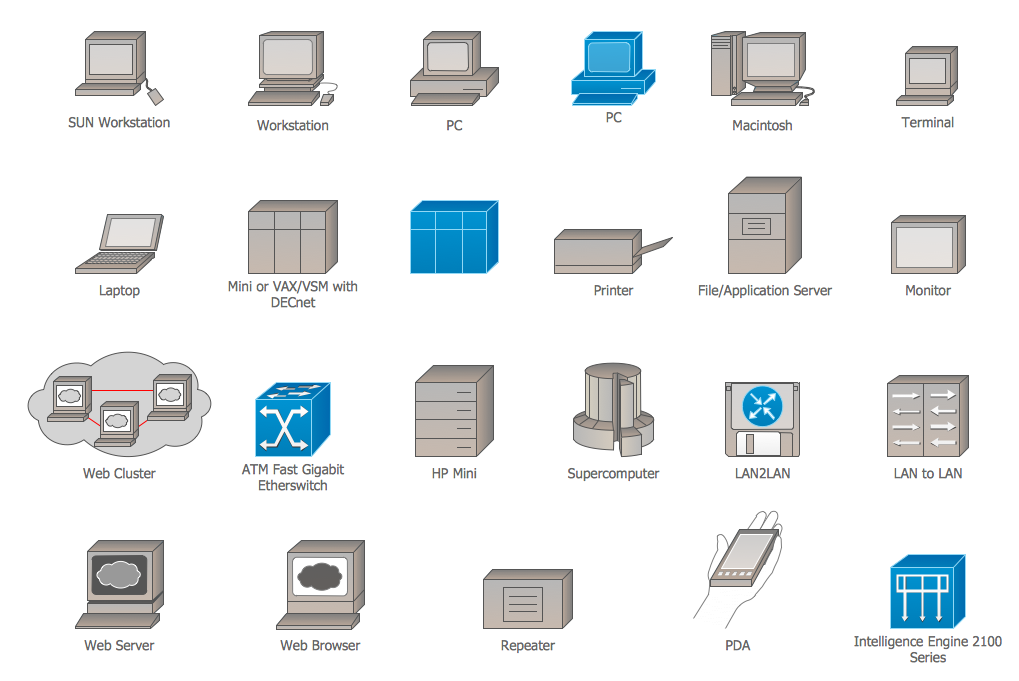


Sample 1. Design Elements — Cisco LAN (macintosh, windows)
for Network Diagrams.
The example "Design elements - Cisco LAN" is included in the Cisco Network Diagrams solution from the Computer and Networks area of ConceptDraw Solution Park.

Example 2. Cisco Solution
Icons, shapes, stencils, symbols and design elements for Cisco Network Diagrams:
TEN RELATED HOW TO's:
A network diagram is used to depict the topology of a computer network or, talking more broadly, any telecommunications network in general. In order for a computer network diagram to be understandable, clearly identifiable icons must be used for each network appliance. Cisco network templates, also called Network Topology Icons, is a brand of symbols developed and used by Cisco. Since Cisco Systems is the largest networking company in the world, it's list of networking symbols is widely recognized and exhaustive.
The diagram of the ISG network topology diagram illustrates the Cisco Intelligent Services Gateway. Since Cicso company offers service providers a possibility to provide control of state and resources in a broadband network, network architects and engineers need some facilities to create ISG topology diagrams.This Cisco ISG network diagram was created in ConceptDraw DIAGRAM using its solution for Cisco network diagrams. The vector library of this solution comprises over 500 icons of Cisco hardware and accessories. They can be used to design LAN, WAN, ISG and other Cisco equipped network diagrams.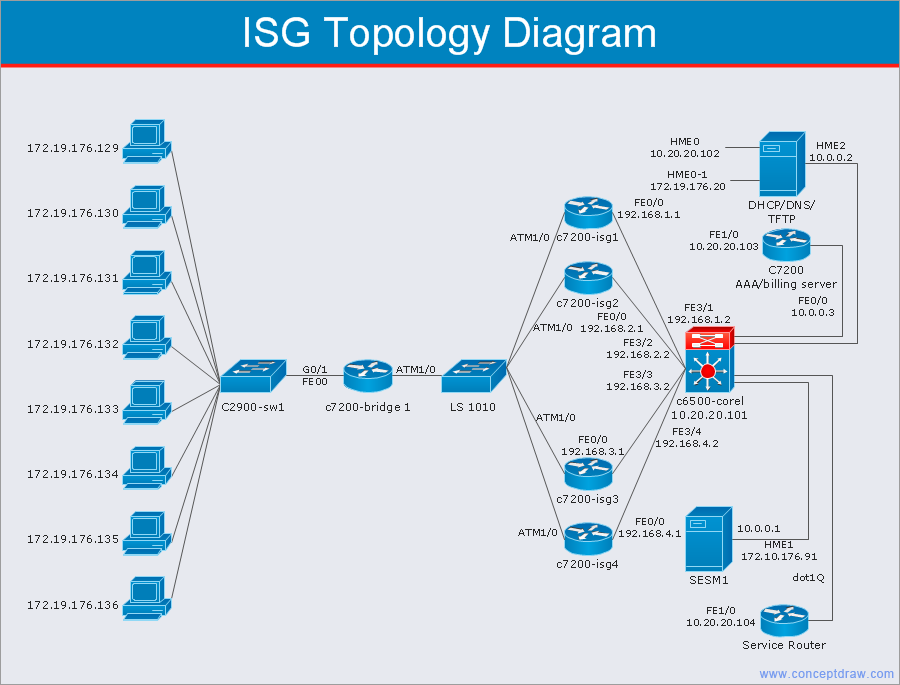
Picture: Cisco Network Templates
Related Solution:
If you are an advanced diagramming software user, you might use it daily. Traversing the Internet in searching of alternative to MS Visio for MAC and PC, you can fulfill all your requirements with ConceptDraw DIAGRAM. Don’t hesitate to transfer your documents to another operating system.
When looking for a smart and simple tool for business diagrams as alternative to MS Visio for Apple OS X platform, ConceptDraw DIAGRAM certainly is the best choice. Making many kinds of business charts, numerous technical drawings is what ConcepDraw DIAGRAM is the best. One can easy create any diagram and complete it perfectly and quickly. The big collection of vector object libraries, templates and samples, make it the best Microsoft Visio alternative: ConceptDraw DIAGRAM is simpler to use, less expensive, and supports project management and mind mapping methods.
Picture:
In Searching of Alternative to MS Visio for Mac and PC
with ConceptDraw DIAGRAM
Network infrastructure planning is a very important process in the network construction, and the share of time allocated to this within the scope of the entire project may reach 60-80%. A competent and thorough approach to planning contributes to the quick investment return, and also increases the reliability and flexibility of the final system, reducing the probability of additional costs related to the incorrect implementation.
Any planning begins with an analysis of the business requirements to the final system. Basic network parameters, which should be assessed are the scalability, accessibility, cost, speed and safety.
Speed and cost are often mistaken for the most important parameters, and the rest of the parameters aren't even remembered. This is not entirely correct. Initially, it is necessary to assess the business plans for the future, because sometimes it is more profitable to invest more money in the beginning. If the business is to develop, then, consequently, demands on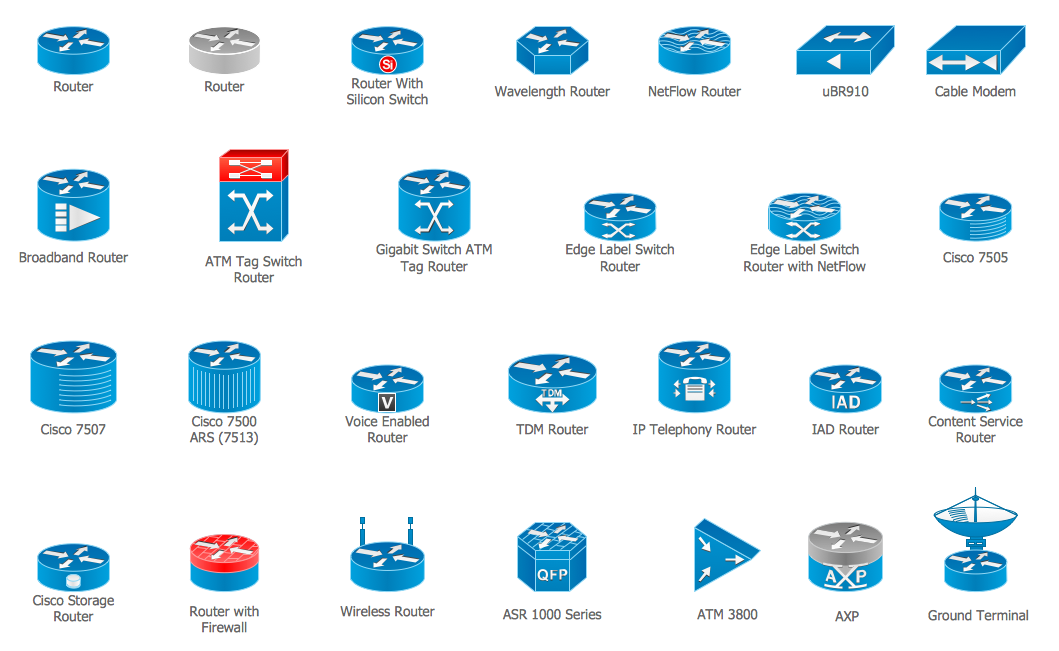
Picture: Cisco Routers. Cisco icons, shapes, stencils and symbols
Related Solution:
Cisco icons are globally recognized and generally accepted as standard for network icon topologies.
ConceptDraw DIAGRAM diagramming and vector drawing software offers the Cisco Network Diagrams Solution from the Computer and Networks Area which contains the extensive drawing tools, templates and samples, and large number of libraries with variety of predesigned vector cisco icons.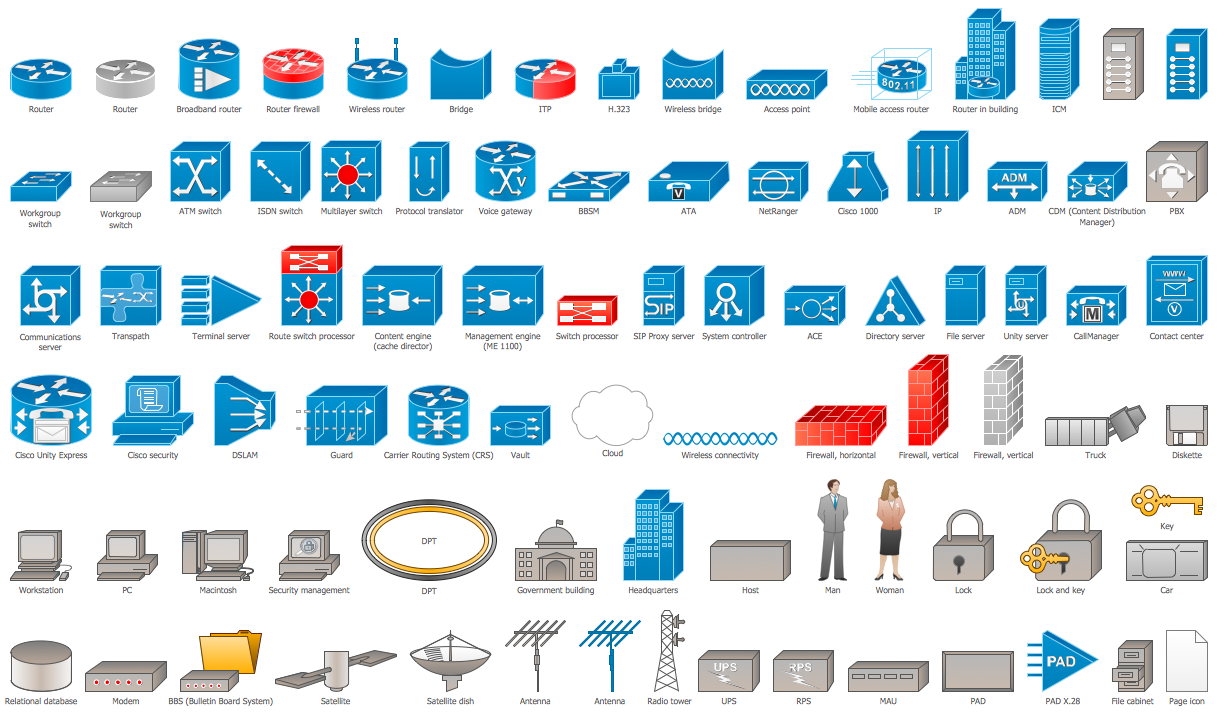
Picture: Cisco Icons
Related Solution:
3D Network Diagrams are very popular diagrams in the field of network technologies. They have more visual, clear, attractive and understandable look than 2D. ConceptDraw DIAGRAM gives the opportunity to draw the professional looking 3D Network Diagrams easy, quick and effective.
This example shows the 3D Network Diagram. It was created in ConceptDraw DIAGRAM using the 3D network elements from the Computer and Networks solution from the Computer and Networks area of ConceptDraw Solution Park.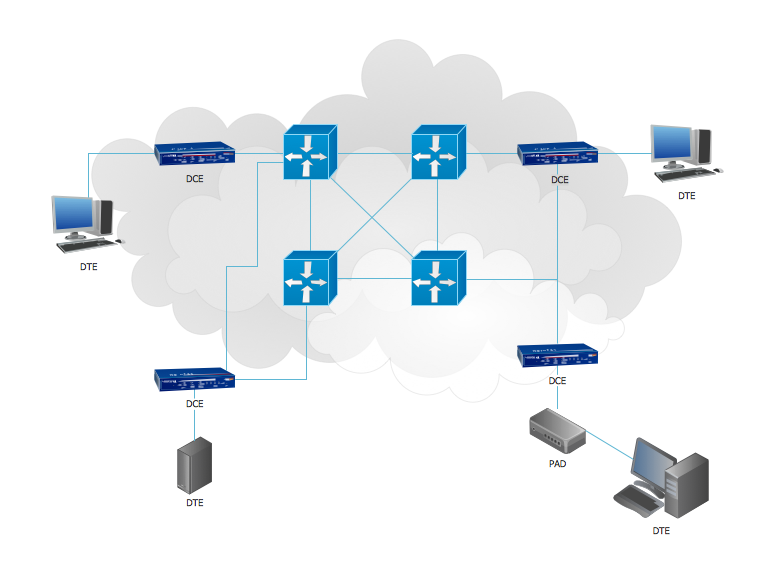
Picture: 3D Network Diagrams. Computer and Network Examples
Related Solution:
Drawing ISG Network Diagram using ConceptDraw DIAGRAM stencils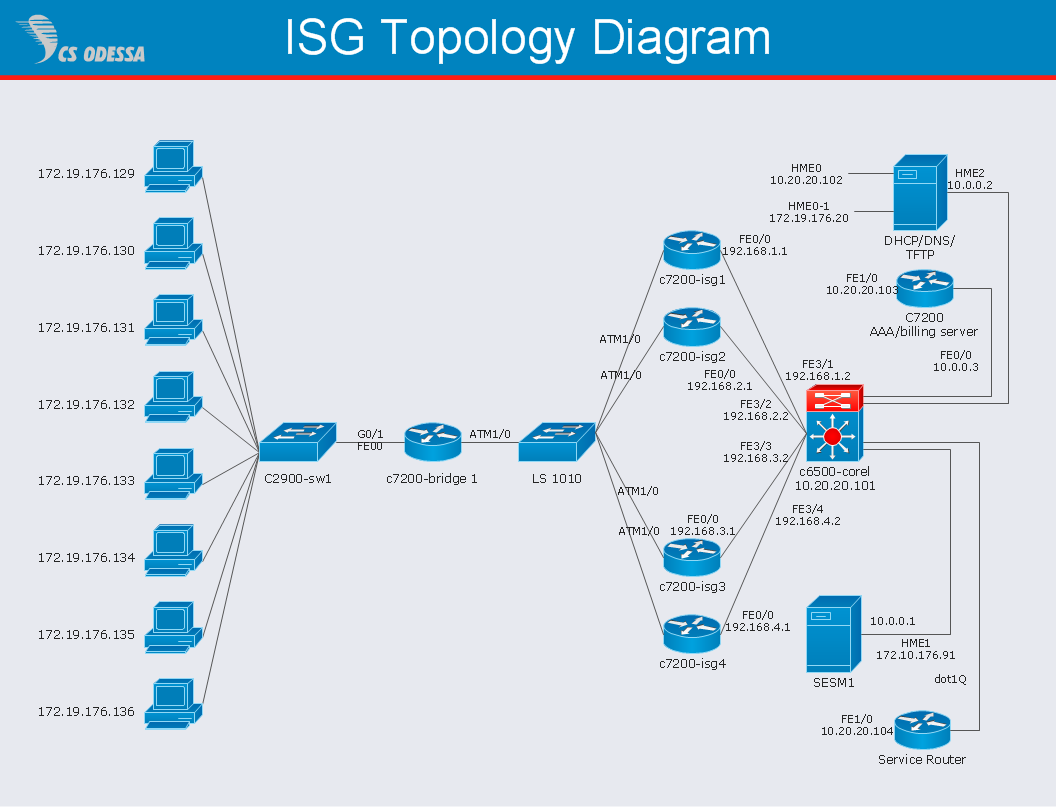
Picture: Network Diagram SoftwareISG Network Diagram
Draw Cisco Network Topology and Cisco Computer Network Diagrams, Designs, Schematics, and Network Maps using ConceptDraw in no Time!
Cisco Network Diagrams solution also provides 15 libraries of 508 Cisco symbols for network components and points, LAN and WAN, schematic and wiring drawings.
Picture: Cisco Network Topology
Related Solution:
If you need to describe some process, diagramming is a perfect tool for almost any imaginable purpose. The set of the most commonly used flow charts symbols is quite wide and includes symbols for operations, processes, data inputs and outputs. You can see the full list of all the symbols used for flowcharting in Flowcharts solution from Diagrams area in ConceptDraw Solution Park.
A flow chart is often used for visual representation of a sequential process flow. The flowchart approach to any process is to divide it into some sequential actions. What makes a flow chart so popular and clear to make out is the set of standard flowchart symbols that has the same reading independently from processes described with their applying. The current drawing represents the vector library containing the pack of standard flowchart symbols. This library is supplied with ConceptDraw Flowcharts solution.
Picture: Flow Chart Symbols
Related Solution:
ConceptDraw DIAGRAM diagramming and vector drawing software extended with Computer Network Diagrams Solution from the Computer and Networks Area offers a set of useful tools, collection of templates, samples, and libraries of various computer symbols, computer devices icons, computer network icon for fast and easy drawing network computer diagrams and illustrations.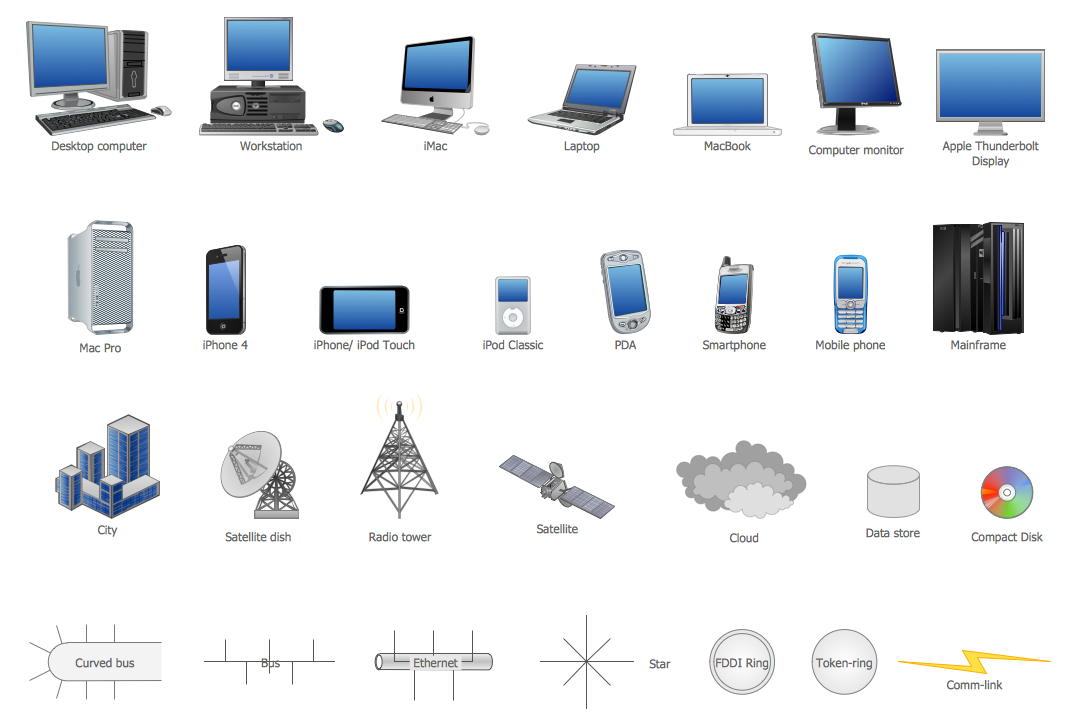
Picture: Network Icon
Related Solution:
ConceptDraw DIAGRAM diagramming and vector drawing software enhanced with Network Security Diagrams Solution from the Computer and Networks Area of ConceptDraw Solution Park is the best for effective design professional, colorful and attractive Network Security Diagram of any complexity and degree of detailing.
Picture: Network Security Diagram
Related Solution:
ConceptDraw
DIAGRAM 18