
Example 1. Hybrid Network Topology
Network topology is the topological structure of the computer network. There are many types of the network topologies: bus, star, ring, mesh topology, but the most popular is the hybrid topology.
Hybrid network topology is a combination of two or more different basic network topologies. For example, it can be star-ring, star-bus topologies, etc. It must be certainly different topologies, because for example two star topologies form the star topology. The resulting hybrid topology has the features and limitations of its components.
Hybrid network topology has many advantages. Hybrid topologies are flexible, reliable, have increased fault tolerance. The new nodes can be easily added to the hybrid network, the network faults can be easily diagnosed and corrected without affecting the work of the rest of network. But at the same time hybrid topologies are expensive and difficult for managing.
Using the predesigned objects, templates and samples of the Computer and Networks Solution for ConceptDraw DIAGRAM you can create your own professional Computer Network Diagrams quick and easy.
The Computer Network Diagrams produced with ConceptDraw DIAGRAM are vector graphic documents and are available for reviewing, modifying, and converting to a variety of formats (image, HTML, PDF file, MS PowerPoint Presentation, Adobe Flash or MS Visio).
See also Samples:
TEN RELATED HOW TO's:
This sample was created in ConceptDraw DIAGRAM diagramming and vector drawing software using the Computer and Networks solution from Computer and Networks area of ConceptDraw Solution Park.
This sample shows the Hierarchical network topology.
A Hierarchical network topology interconnects multiple groups that are located on the separate layers to form a larger network. Each layer concentrates on the specified functions, this allows to choose the right equipment for the layer.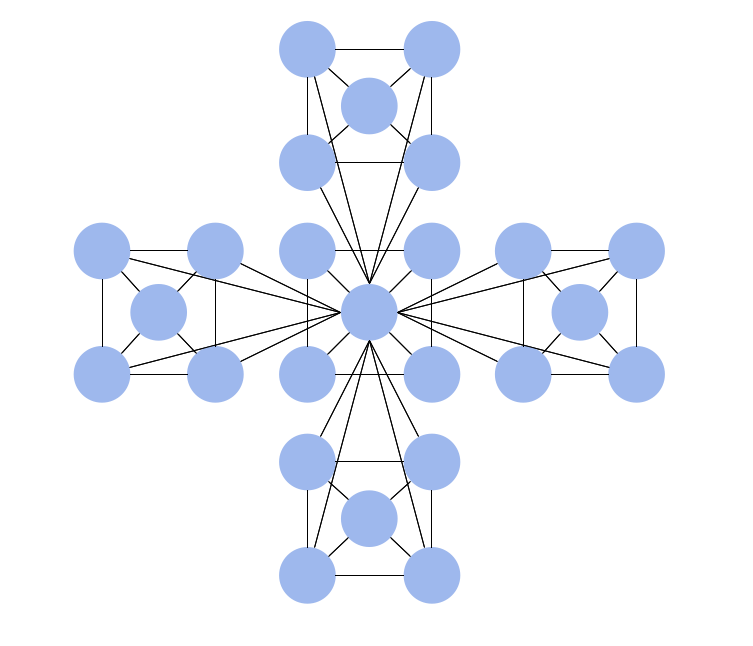
Picture: Hierarchical Network Topology
Related Solution:
An abstract representation is usually the first thing you will need while developing a database. To understand the ways that databases are structured, you should look through entity-relationship diagram examples and see the notations features and attributes. With an entity-relationship model you can describe a database of any complexity.
This Entity-relationship diagram is a tool for software developers. It enables every element of database to be managed, communicated and tested before release. This ERD was created using symbols advocated by Chen's notation. Because of a linguistic origin of the Chen’s notation, the boxes representing entities could be interpreted as nouns, and the relationships between them are in verb form, shown on a diagram as a diamond.
Picture: Entity Relationship Diagram Examples
Related Solution:
Using the predesigned objects, templates and samples of the Computer and Networks Solution for ConceptDraw DIAGRAM you can create your own professional Computer Network Diagrams quick and easy.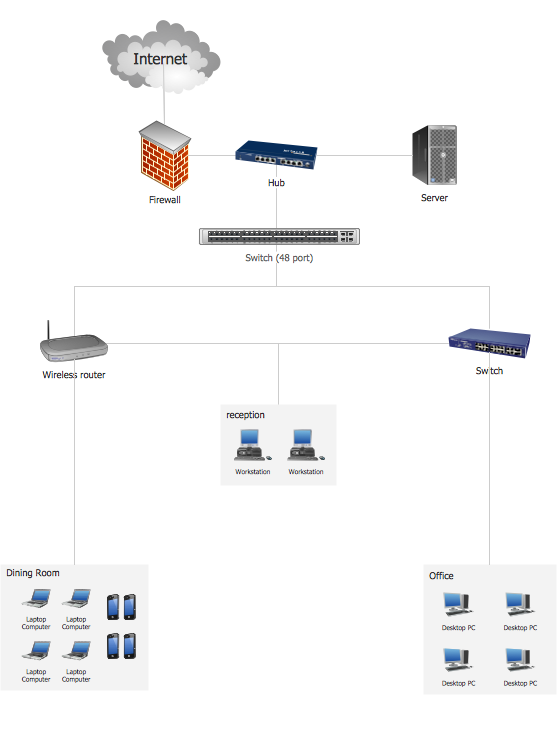
Picture: Hotel Network Topology
Related Solution:
The ConceptDraw vector stencils library Cisco People contains symbols for drawing the computer network diagrams.
Vector stencils library Cisco People contains 17 pictogram symbols and clipart for drawing the computer network diagrams using the ConceptDraw DIAGRAM diagramming and vector drawing software.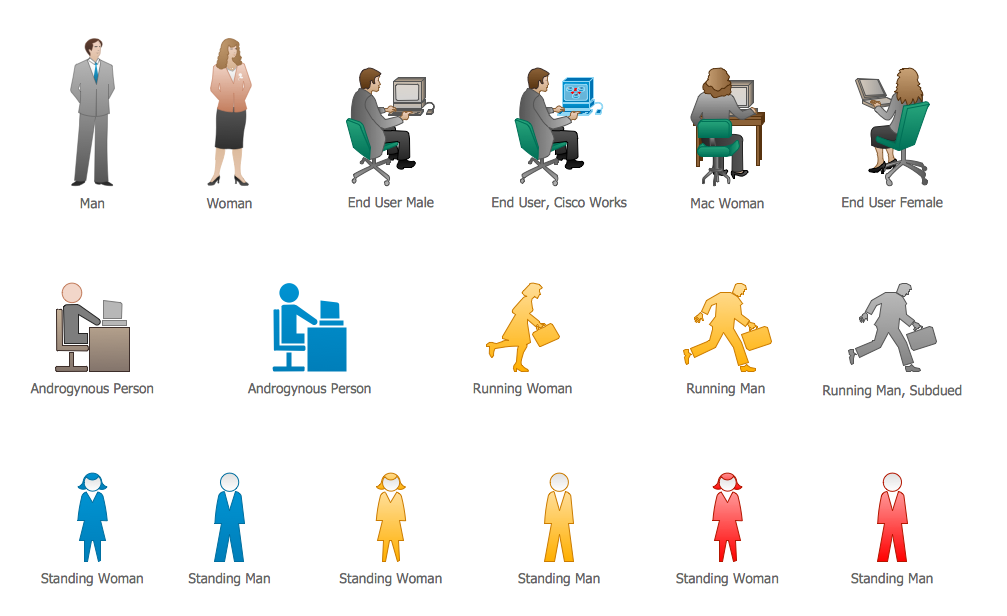
Picture: Cisco People. Cisco icons, shapes, stencils and symbols
Related Solution:
Planning a computer network can be a challenge for a junior specialist. However, knowing how to draw a computer network diagrams isn’t a rocket science anymore. There are a lot of special software for creating such diagrams with predesigned templates and examples.
The core for Network Fault Tolerance System presented here, is the equipment of Cisco. You can see here the certified Cisco equipment icons. Generally, ConceptDraw DIAGRAM libraries contain more than half of a thousand objects representing the standardized images of Cisco equipment. ConceptDraw solution for network diagramming is a great network diagramming tool for any level skills - from students to network guru.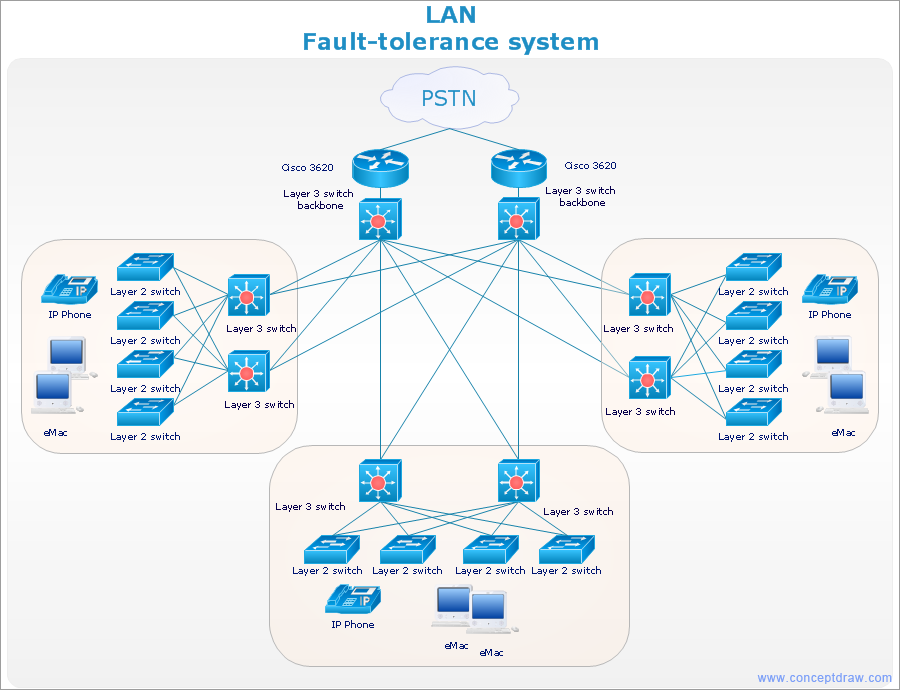
Picture: How to Draw a Computer Network Diagrams
Related Solution:
Architectural drawing allows to show the location of a building or ensemble of buildings on the ground, indicating the cardinal points. For centuries, people had been studying architecture in universities to learn how to draw building plans and now everyone can do it easily just using appropriate software. While developing the building plan, its graphic part, you can display the part of the floor or the entire floor of a building with an indication of the exact location of the drawn premise.
Small-sized apartments does not restrict the advanced interior design opportunities. Here is a detailed and precise floor plan of a pretty small apartment. A furniture objects are added to show possible interior of this home. This plan can be used to help somebody with a floor layout and furniture arrangement. Having this floor plan in a pocket while shopping would be useful to check if there is enough rooms for a new furniture.
Picture: How To Draw Building Plans
Related Solution:
Two types of diagrams are used in UML: Structure Diagrams and Behavior Diagrams. Behavior Diagrams represent the processes proceeding in a modeled environment. Structure Diagrams represent the elements that compose the system.
Picture: UML Diagram Types List
Related Solution:
A Home Area Networks (HAN) is a type of local area network that is used in an individual home. The home computers can be connected together by twisted pair or by a wireless network. HAN facilitates the communication and interoperability among digital devices at the home, allows to easier access to the entertainments and increase the productivity, organize the home security.
This example was created in ConceptDraw DIAGRAM using the Computer and Networks Area of ConceptDraw Solution Park and shows the home network diagram.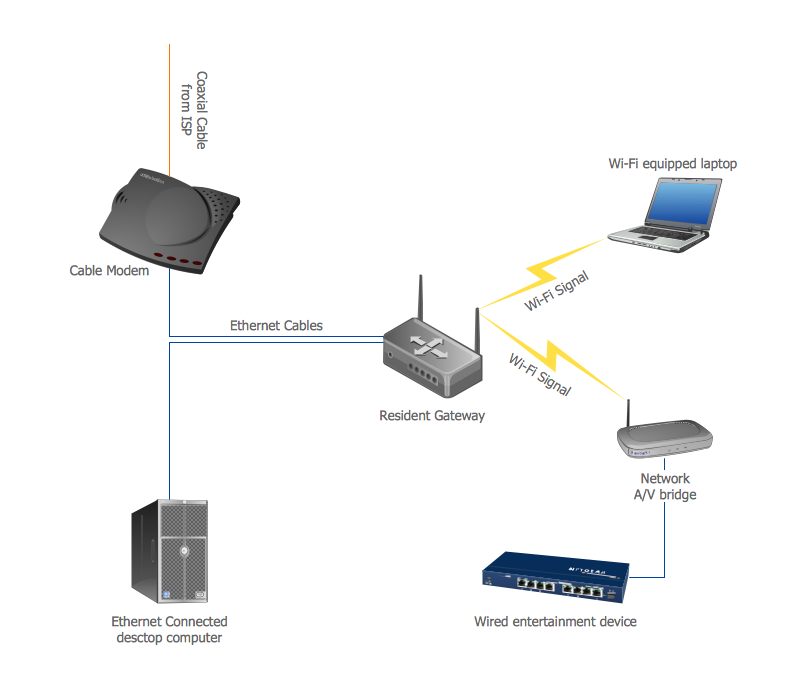
Picture: Home area networks (HAN). Computer and Network Examples
Related Solution:
Computer networks nowadays are spread all across the world. The large number of parameters, such as geographic scale or communication protocols, can divide networks. One of the most common types of networks is called local area network (LAN). It convenient to represent network examples by means of diagrams.
This local area network (LAN) diagram provides an easy way to see the way the devices in a local network are interacted. The diagram uses a library containing specific symbols to represent network equipment , media and the end-user devices such as computers (PC, mac, laptop) , network printer, hubs, server and finally a modem. There are two types of network topologies: physical and logical. The current diagram represents precisely a physical type of LAN topology because it refers to the physical layout of a local network equipment.
Picture:
What is a Local Area Network?
Examples of LAN Diagrams
Related Solution:
An Enterprise private network (EPN) is a computer network built by an enterprise to interconnect the sites of the company (such as head and remote offices, shops, production sites, etc.) on purpose to share the computer resources.
This example was created in ConceptDraw DIAGRAM using the Computer and Networks solution from the Computer and Networks area of ConceptDraw Solution Park. It shows the Enterprise Private Network (EPN) using the frame-relay and dial-up.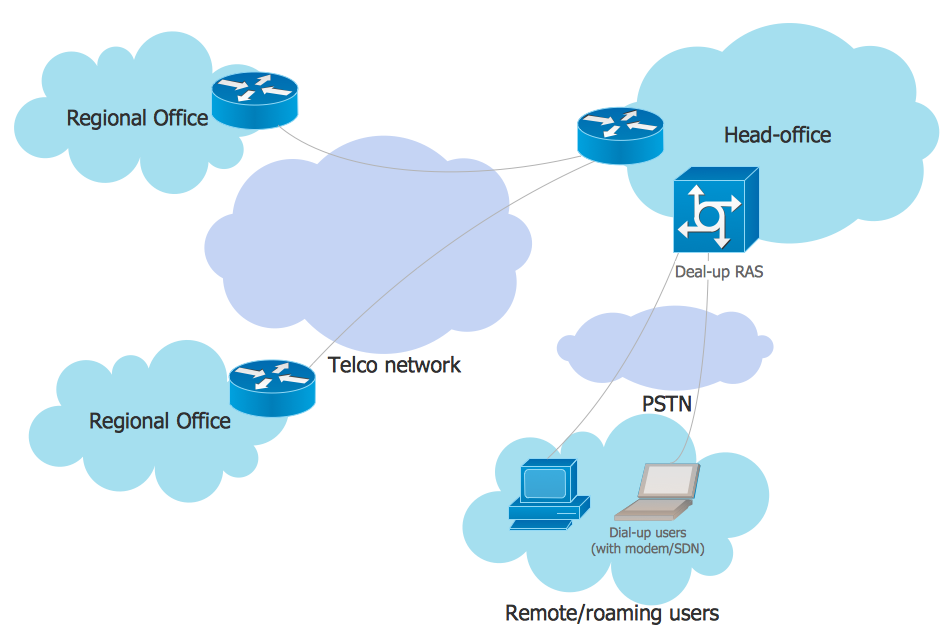
Picture: EPN Frame-Relay and Dial-up Network. Computer and Network Examples
Related Solution: