Made with
ConceptDraw
MINDMAP 16

Risk Diagram (Process Decision Program Chart)

Business Productivity

In Business Productivity Solutions we support managers and knowledge workers in making their jobs easier, saving them time and achieving better results. The solutions in the ConceptDraw Solution Park extend our ConceptDraw products beyond the scope of what ships with the product and add value to all of our products going forward. If in your job you need to make presentations, conduct meetings, prepare documents, brainstorm and build new strategies; as well as save yourself time then ConceptDraw Solution Park will provide you with the tools you need to be successful.

You will find that our solutions are well designed to save you valuable time when you only have a minute or two to prepare. By leveraging content that has already been authored and then rapidly repurposing it to meet your requirements you have ratcheted up your ability to respond to any eventuality. Even a critical presentation that you only have a moment to prepare can be professionally generated and presented. No other tool anywhere gives you the flexibility and the immediacy that you will find in ConceptDraw Office and ConceptDraw Solution Park.

When you do professional work and need more integrated approach for your data processing using many various software tools – then you need check Solution Park for separate support your professional Activity. It delivers comprehensive support for professional activities as separate Solution Park’s Activity collection of integrated software tools and the number of supported activities is growing.

To achieve the professional results you desire, while being able to respond faster than you have ever been able to before require an integrated approach that leverages the data and documentation that currently exists. ConceptDraw Office in combination with the extensibility provided by ConceptDraw Solution Park supports your business activities. ConceptDraw Solution Park is an ever growing collection of point solutions that adds value to your investment.

7 Management & Planning Tools

Benefits

The "7 Management and Planning Tools" solution implements well-known methodologies for problem analysis and solving. Different products from the ConceptDraw Office suite can be used as a complete solution for any of the methodologies in this solution. ConceptDraw Office provides visual communication during every stage of work.

Objective

Provide comprehensive tool for problem analysis that supports any of the methodologies.

Solution Purpose

Assists in the solving of common business problems by using a step-by-step methodology for problem identification, analysis, planning of solving actions and countermeasures to address risks.

Intended For

This comprehensive solution set is intended for managers in medium to large companies, who are looking for tools to address issue management. The 7 MP solution is intended for business consultants, trainers and coaches to visualize the problem solving by using 7 MP Tools methodology.

Products and Methods

ConceptDraw MINDMAP is used for structuring, analyzing information. ConceptDraw DIAGRAM is used to generate ready-for-presentation documents and diagrams. ConceptDraw PROJECT is a powerful, professional tool for project planning and PERT chart generation.

Risk Diagram (Process Decision Program Chart)

Analyze each identified action separately in the tree of all actions and then develop a preventive action in response to potential obstacles or circumstances have been identified as a risk. The PDPC determines the risks when corrective action is not performed correctly. Also, it helps develop descriptions for preventive actions at the level of execution.

Risk Diagram (Process Decision Program Chart) *

Example 1. Risk Diagram (Process Decision Program Chart)


How to create Process Decision Program Chart

  • The Process Decision Program Chart (located in Input tab) opens with a new action planning template
  • Use the template to identify the "Project Plan" and the related information (phase, task, risk, counter measure)
  • From Output tab, under "7 Management & Planning Tools", select Process Decision Program Chart
  • Results will be automatically drawn in ConceptDraw DIAGRAM

The Benefits for ConceptDraw MINDMAP Brainstorming Software

  • ConceptDraw MINDMAP is effective for brainstorming, designing mind maps, idea generating, creative and lateral thinking, creativity and problem solving.
  • ConceptDraw MINDMAP is ideal for team and personal work in Business, Marketing and Project Management.
  • The libraries with large quantity of vector objects help to illustrate your mind maps and to make them bright, visual and comprehensible.
  • Use of View Navigator tool lets create presentations from a mind map: you can simply select the map parts you want to present, sequence your slides, and preview the presentation.
  • ConceptDraw MINDMAP provides wide capabilities of importing and exporting in various formats: Microsoft PowerPoint, Microsoft Word, MS Excel, Mindjet MindManager, image, HTML, PDF file.
TEN RELATED HOW TO's:
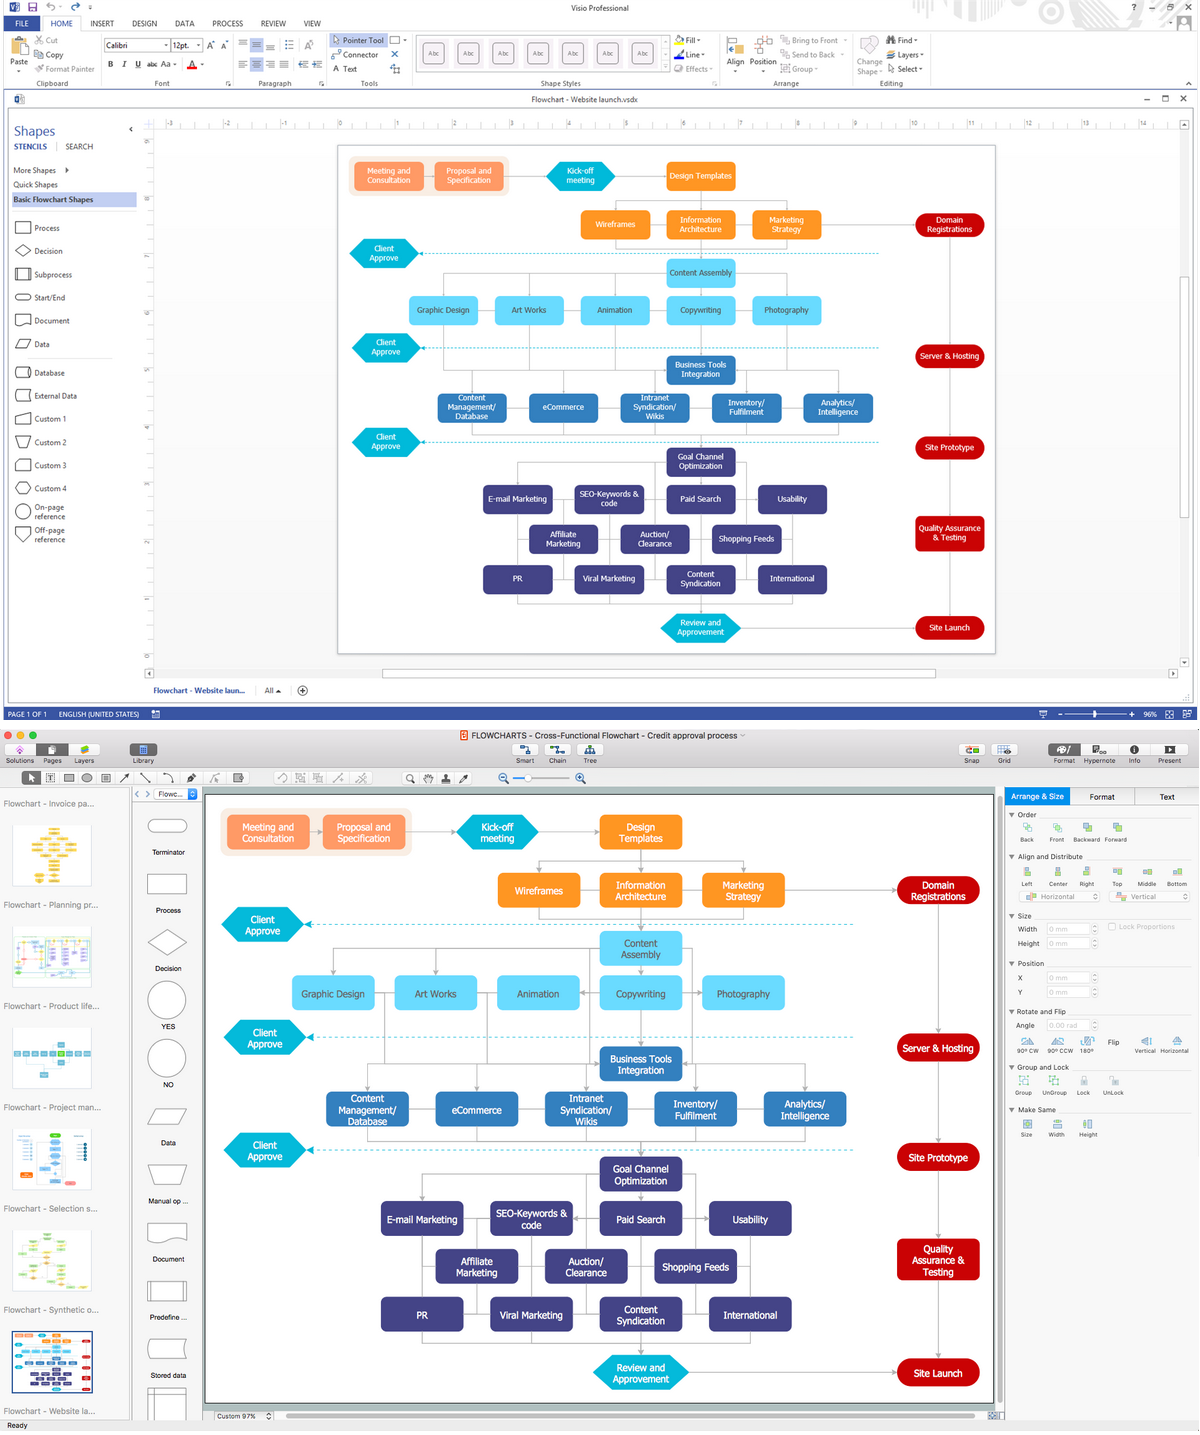
If you are an advanced diagramming software user, you might use it daily. Traversing the Internet in searching of alternative to MS Visio for MAC and PC, you can fulfill all your requirements with ConceptDraw DIAGRAM. Don’t hesitate to transfer your documents to another operating system. When looking for a smart and simple tool for business diagrams as alternative to MS Visio for Apple OS X platform, ConceptDraw DIAGRAM certainly is the best choice. Making many kinds of business charts, numerous technical drawings is what ConcepDraw DIAGRAM is the best. One can easy create any diagram and complete it perfectly and quickly. The big collection of vector object libraries, templates and samples, make it the best Microsoft Visio alternative: ConceptDraw DIAGRAM is simpler to use, less expensive, and supports project management and mind mapping methods.Alternative to MS Visio for MAC and PC
Picture:
In Searching of Alternative to MS Visio for Mac and PC
with ConceptDraw DIAGRAM
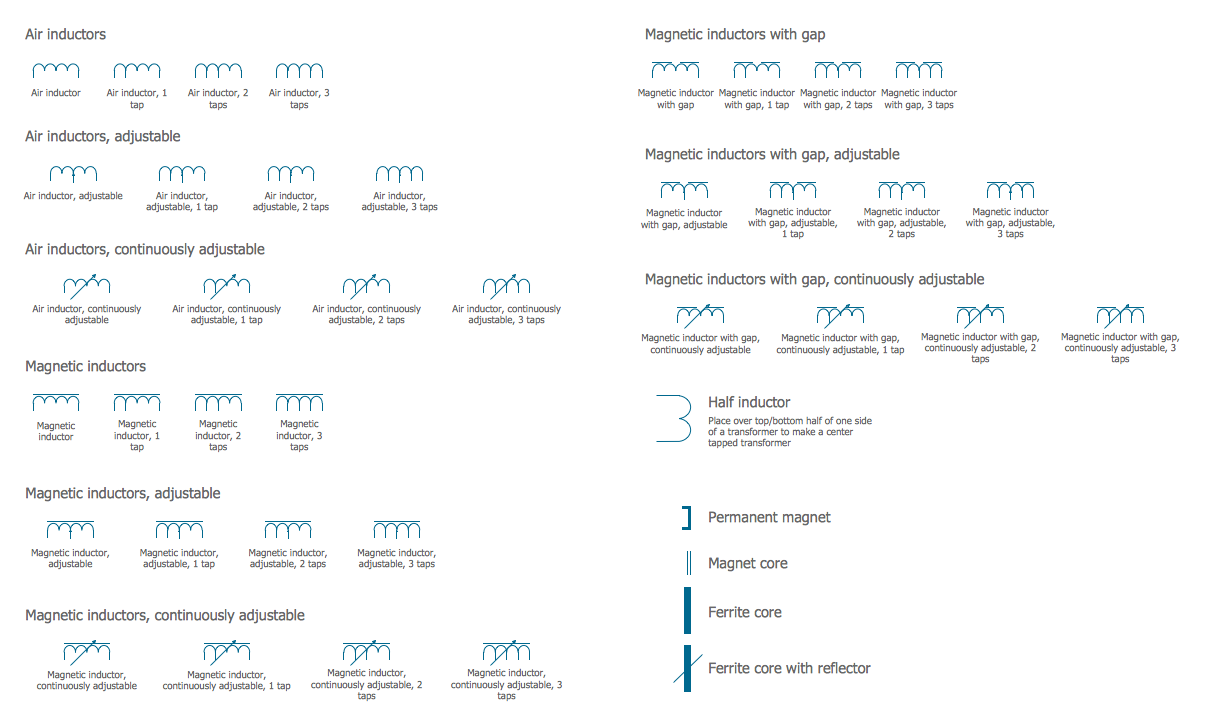
An inductor, also called a coil or reactor, is a passive two-terminal electrical component which resists changes in electric current passing through it. It consists of a conductor such as a wire, usually wound into a coil. Energy is stored in a magnetic field in the coil as long as current flows. When the current flowing through an inductor changes, the time-varying magnetic field induces a voltage in the conductor, according to Faraday’s law of electromagnetic induction. 26 libraries of the Electrical Engineering Solution of ConceptDraw DIAGRAM make your electrical diagramming simple, efficient, and effective. You can simply and quickly drop the ready-to-use objects from libraries into your document to create the electrical diagram.Electrical Symbols — Inductors *
Picture: Electrical Symbols — Inductors
Related Solution:
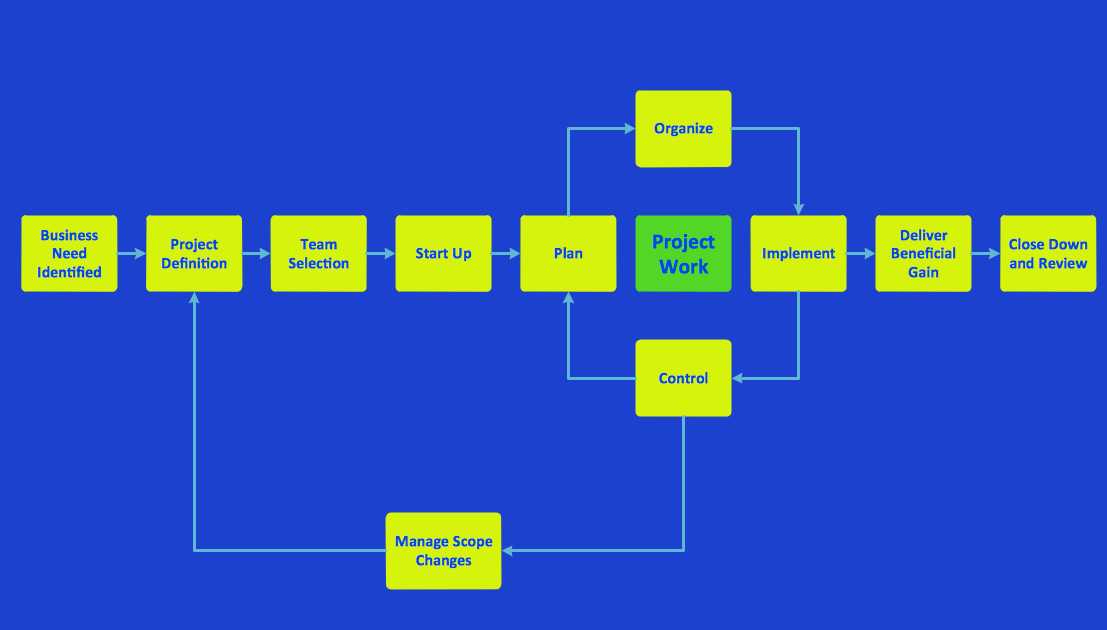
Use ConceptDraw DIAGRAM diagramming and business graphics software for drawing your own PM life cycle flow charts.Program to Make Flow Chart *
Picture: Program to Make Flow Chart
Related Solution:
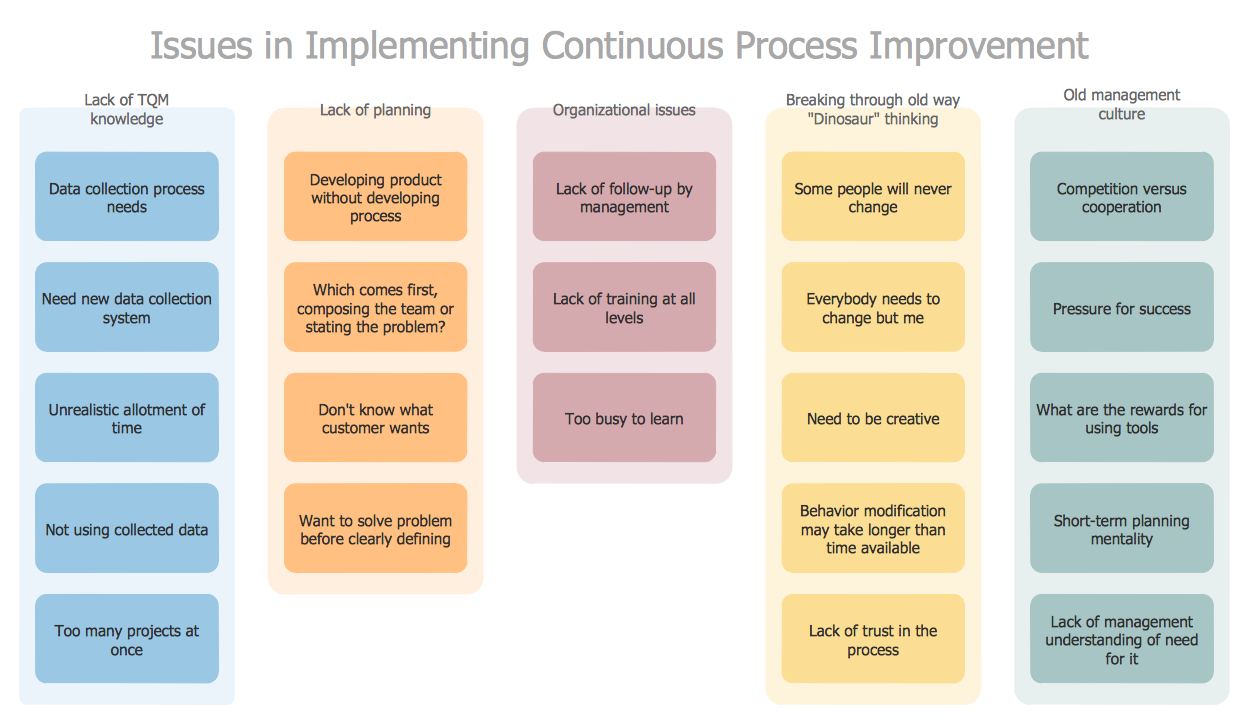
Identify and Structure Factors. Use the Affinity Diagram to collect and structure factors that impact on a problem. ConceptDraw OFFICE suite is a software for identify and structure factors with affinity diagram. This is a grouping and structuring of factors that impact on a problem.PROBLEM ANALYSIS. <br>Identify and Structure Factors *
Picture: PROBLEM ANALYSIS. Identify and Structure Factors
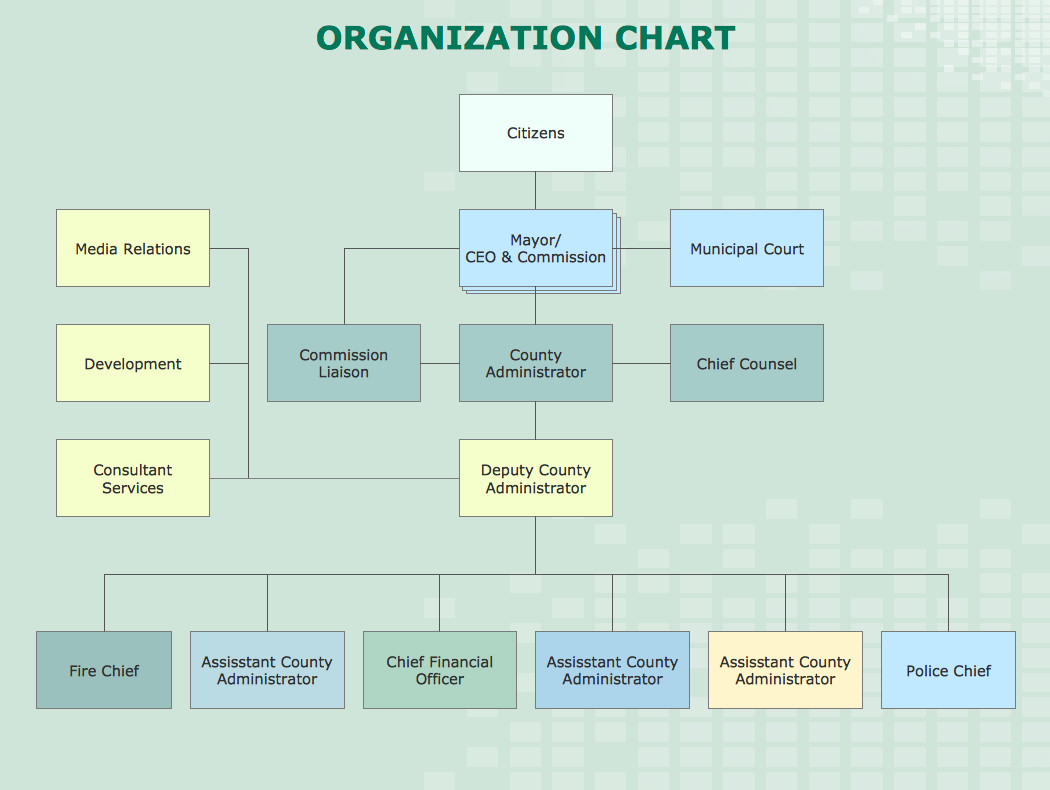
If your company is in chaos in clutter and no one understands their rights and responsibilities, maybe it's time to change that. One of the ways to put the company in order is to draw an organization chart that would reflect the structure and show the relationships among departments and positions. This is a very useful and easy to understand scheme. This is example of the one of the most typical kind of organizational chart. It depicts an organizational structure of the hierarchical type. Its construction is similarv to pyramid. The single main position on the top - in this case, the mayor's position followed by sub-levels of authority in his command. Each position in the pyramid reports only to his supervisor, and takes only a report of direct subordinates. Such scheme limits the number of communications. This organizational structure is effectively used in public organizations. Also it is suitable for any organization with the need for multiple levels of middle managers. The ability to create organizational charts of different types is supplied with ConceptDraw Ogrcharts solutions.How to Draw an Organization Chart *
Picture: How to Draw an Organizational Chart
Related Solution:
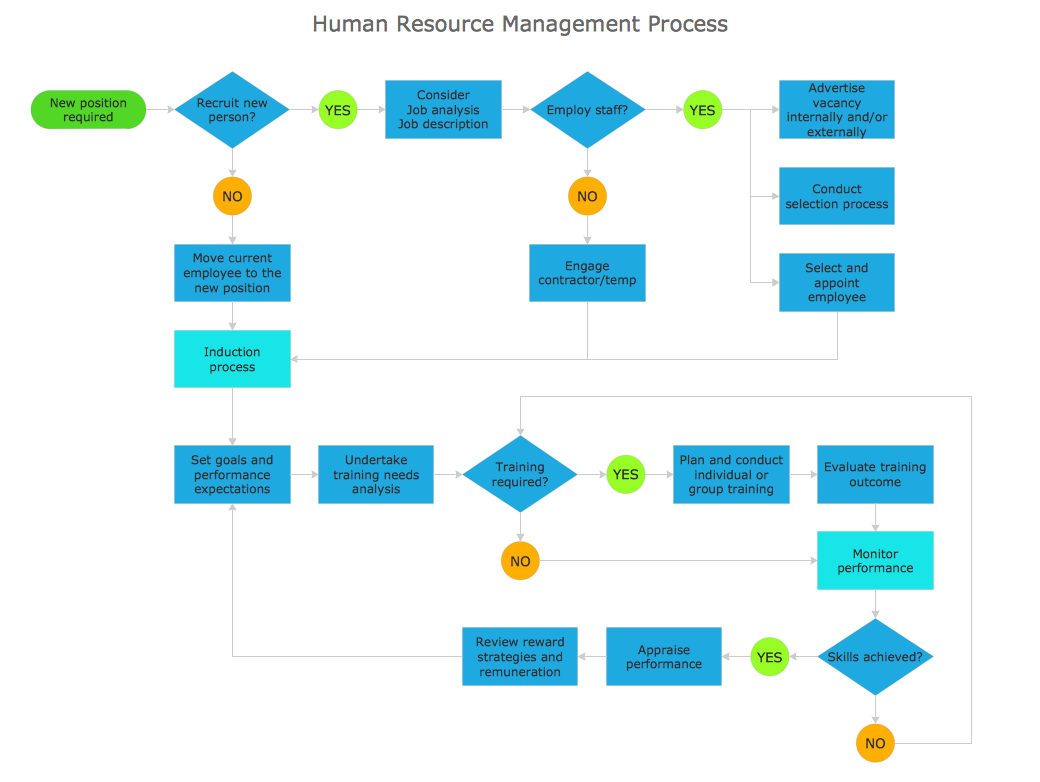
ConceptDraw DIAGRAM is a Mac OS X and Windows software. Numerous vector stencils, samples and templates created by designers are included in the basic package. This is classic flowchart maker which exactly follows the industry standards using flowchart symbols geathered during a ten years into solution park.Flowchart Software *
Picture: Flowchart Software
Related Solution:
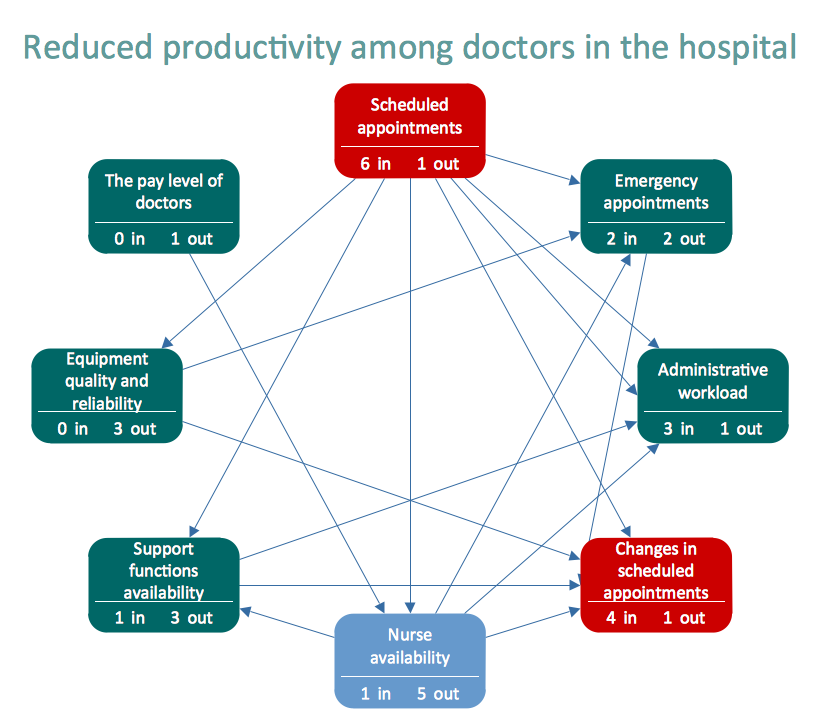
Relationships Analysis. Relations Diagram - factors analysis, factors relations. Create Relations Diagram with ConceptDraw DIAGRAM. The Seven Management and Planning Tools is a tool for Interaction diagram drawing. This diagram identifies causal relationships. Determine what factors are causes and which factors are effects. Interaction diagram helps establish KPIs to monitor changes and the effectiveness of corrective actions in resolving the problem.Relationships Analysis *
Picture: Relationships Analysis
Decision Making - ConceptDraw OFFICE suite provides visual tools that are given support on the stage of the decision making. The Seven Management and Planning Tools is a set for such diagrams: Affinity Diagram, Relations Diagram, Prioritization Matrix, Root Cause Tree Diagram, Involvement Matrix, PERT Chart, Risk Diagram (PDPC).Decision Making *
Picture: Decision Making
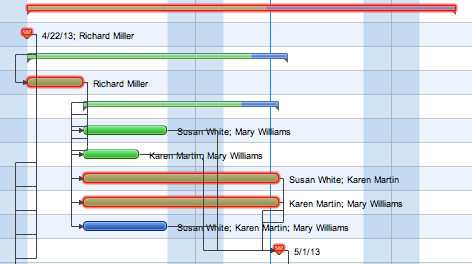
ConceptDraw PROJECT is the Gantt chart software that implements critical path method to provide the user with a wide set of project management tools.How to Discover Critical Path on a Gantt Chart *
Picture: How to Discover Critical Path on a Gantt Chart
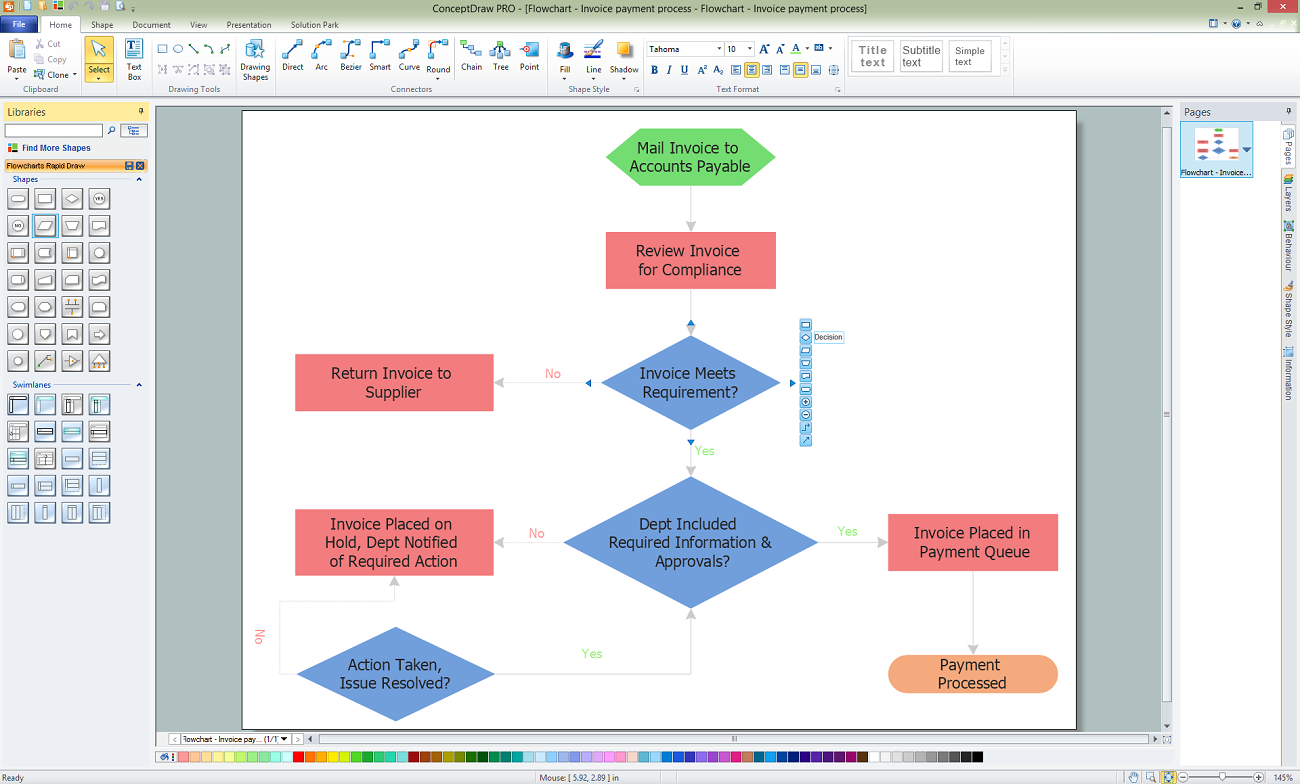
A flowchart is a powerful tool for examining processes. It helps improving processes a lot, as it becomes much easier to communicate between involved people, to identify potential problems and to optimize workflow. There are flowcharts of different shapes, sizes and types of flowchart vary from quite basic process flowcharts to complex program flowcharts. Nevertheless, all these diagrams use the same set of special symbols like arrows to connect blocks, parallelogram to show data receiving or rectangles for showing process steps. Basic flowcharts are used to represent a simple process algorithm. A basic flowchart notation consists of rectangles (business processes), arrows (the flow of information, documents, etc.). The same notation is used in items such as the "decision", which allow you to do the branching. To indicate the start of the entire business process and its termination can be used the "Terminator" element. The advantages of Basic Flowchart are simplicity and clarity. With it you can quickly describe the business process steps. Creating of Basic Flowchart does not require any special knowledge, as easily understand by employees with different levels of education and IQ.Types of Flowchart — Overview
Picture: Types of Flowchart: Comprehensive Overview
Related Solution:
ConceptDraw
MINDMAP 16