Relationships Analysis
Management and Planning tools
ConceptDraw OFFICE suite is a software for decision making. The Seven Management and Planning Tools is a tool for Interaction diagram drawing. This diagram identifies causal relationships. Determine what factors are causes and which factors are effects. Interaction diagram helps establish KPIs to monitor changes and the effectiveness of corrective actions in resolving the problem.

Pic.1 Relationships Analysis. Relations diagram — Health Care
Relation Diagram helps identify what factors are causes and which factors are effects. Factors help establish KPI (Key Performance Indicators) to monitor changes and the effectiveness of corrective actions in resolving a problem.
See also:
TEN RELATED HOW TO's:
Chemical and Process Engineering solution contains variety predesigned process flow diagram elements relating to instrumentation, containers, piping and distribution necessary for chemical engineering, and can be used to map out chemical processes or easy creating various Chemical and Process Flow Diagrams in ConceptDraw DIAGRAM.
Picture: Process Flow Diagram Symbols
Related Solution:
Data modeling is actively applied in analysis and uses wide set of methods for description the data requirements in a system. One of the most popular and well-known is the ERD method of database modeling.
The best ERD tool for the Mac and Windows is ConceptDraw DIAGRAM software extended with the Entity-Relationship Diagram (ERD) solution from the Software Development Area for ConceptDraw Solution Park, which is sharpened for professional ERD drawing and data modeling with Entity Relationship Diagram.
Picture: Data Modeling with Entity Relationship Diagram
Related Solution:
Affinity Diagram Software - ConceptDraw DIAGRAM is a powerful diagramming and vector drawing software that allows quick, easy and effective create the Affinity Diagrams.
Seven Management and Planning Tools solution from the Business Productivity area of ConceptDraw Solution Park provides templates, samples and ready-to-use vector stencils that will help you design the professional looking Affinity Diagrams in a few moments.
Picture: Affinity Diagram Software
Related Solution:
Describing a workflow or approval process can take hours and be too complicated, especially since there are options to do it quickly and vividly. Diagrams called flowcharts replace long paragraphs of boring text and represent information in a graphic way. You can draw one on paper or you can use flowchart software to do it quickly and scalable. This kind of software is easy to use and you don’t need any special skills to start using it. In addition, there are a lot examples and predesigned templates on the Internet.
Flowcharts are a best tool for staking out a huge and complex process into some small readable parts. Surely, flowcharts can be drawn manually but the use of standard symbols that make it clear for a wide audience makes a software tool preferred for this task. The core for a successful flowchart is its simplicity. That is why often before beginning making flowchart through software, people draw the sketch on a piece of paper. Designing an effective flowchart means the combination of the data needed to be shown and the simplicity with which you depict it.
Picture: Flowchart Software: A Comprehensive Guide
Related Solution:
The Total Quality Management Diagram solution helps you and your organization visualize business and industrial processes. Create Total Quality Management diagrams for business process with ConceptDraw software.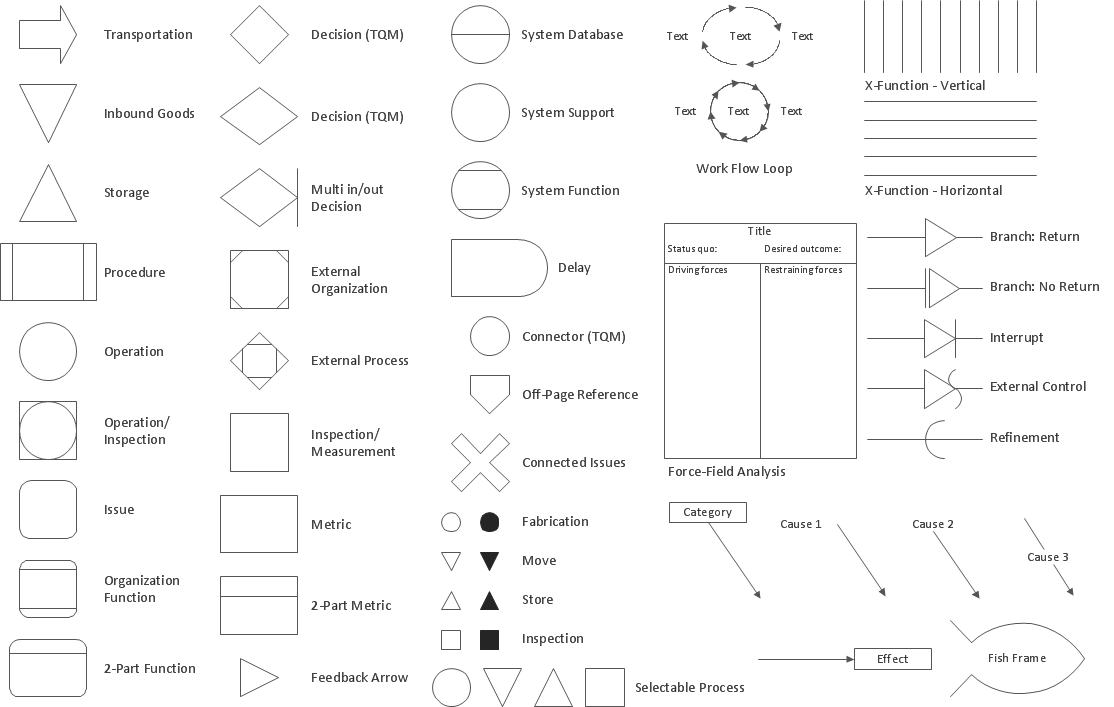
Picture: Total Quality Management Density
Related Solution:
When deciding to start your own business, you have to take into account a bunch of different aspects. One of the ways to get inspired is to look through various restaurant floor plans samples or interior photos of already known establishments. This will help you, but keep in mind that a really unforgettable establishment must be unique.
This restaurant floor plan diagram was designed using ConceptDraw Cafe and Restaurant Floor Plan solution. It can be used as a sample while considering a custom restaurant design. With the help of this example you can estimate the amount of furniture best for a dining room or kitchen of the restaurant. In addition, this plan would be useful as a check list when you will consider a list of the furniture and equipment needed for all areas of the future restaurant.
Picture: Restaurant Floor Plans Samples
Related Solution:
The UML diagram is a powerful tool which lets visually represent all system's components, the interactions between them and relationships with external user interface.
The Rapid UML solution for ConceptDraw DIAGRAM software offers diversity of UML flowchart symbols for drawing all types of UML diagrams.
Picture: UML Flowchart Symbols
Related Solution:
Analyze the root causes of factors that influence the problem. A diagram is constructed separately for each high priority factor. Identify the root causes for a factor and then propose possible corrective actions. The diagram displays the structure of causes for a factor and possible corrective actions. The Root Cause Analysis Tree Diagram is used for further formulation of actions.
Picture: Root Cause Tree Diagram
Related Solution:
The Seven Management and Planning Tools is a tool for Root Cause Analysis Tree Diagram drawing. This diagram is for Root Cause Analysis.
Analyze the root causes for factors that influenced the problem. This diagram is constructed separately for each highly prioritized factor. The goal of this is to find the root causes for the factor and list possible corrective action.
Picture: Root Cause Analysis
Database structures are usually described by ER-diagrams which represents entities as boxes with lines-connections between them. You can create any entity-relationship diagram (ERD) by means of ConceptDraw DIAGRAM using ready-to-use templates and special libraries containing all the needed symbols and shapes. Creating a model for your database from now on can take just a few minutes.
ERD (entity relationship diagram) designed to show the logical structure of databases. It intended to depict the relationships between data components (entities). ERDs are a popular tool for software engineers and architects. Using ERD they can manage the every aspect of database design. Also ERD can be used as guidelines for testing and communications before software release. This diagram represents the file reference system of the WordPress web platform. Because entity relationship diagrams have such a broad application area through the prevalence of database technology, it can be applied for a wide range of users.
Picture: Entity-Relationship Diagram (ERD) with ConceptDraw DIAGRAM
Related Solution:
ConceptDraw
DIAGRAM 18