The Affinity Diagram shows the structure of complex factors that have an influence on a problem, and then divides them up into a smaller and simpler structure. This diagram is designed to prepare the data for further analysis of the cause-effect relationships.
TEN RELATED HOW TO's:
SWOT analysis is an effective method of business planning, the question is how to do it. The most obvious way is to make a SWOT analysis in a Word document, which is not very convenient. Luckily, you can use software like ConceptDraw DIAGRAM that has features and templates made especially for SWOT analyzing.
A SWOT Analysis is a manager's means of the strategic planning. It is used to define and classify considerable internal moments (strengths and weaknesses) and external forces (opportunities and threats) a business faces. You can use ConceptDraw MINDMAP to determine and organize factors utilized for SWOT analysis, and represent them in the SWOT matrix using ConceptDraw DIAGRAM. Using mind maps empowers you to explore and rank a lot of data engaged for SWOT analysis as well as recognize the relations between various pieces of information.
Picture: How to Make SWOT Analysis in a Word Document
Related Solution:
Collaborating with co-workers is very important, not only in order to get things done effectively, but also to keep in touch with the outside world. Great way for business collaboration is Skype.
Picture: Online Collaboration via Skype
Related Solution:
Purchasing Workflow Chart as a methods for documenting accounting information systems. Symbols and Methods for designing Accounting System.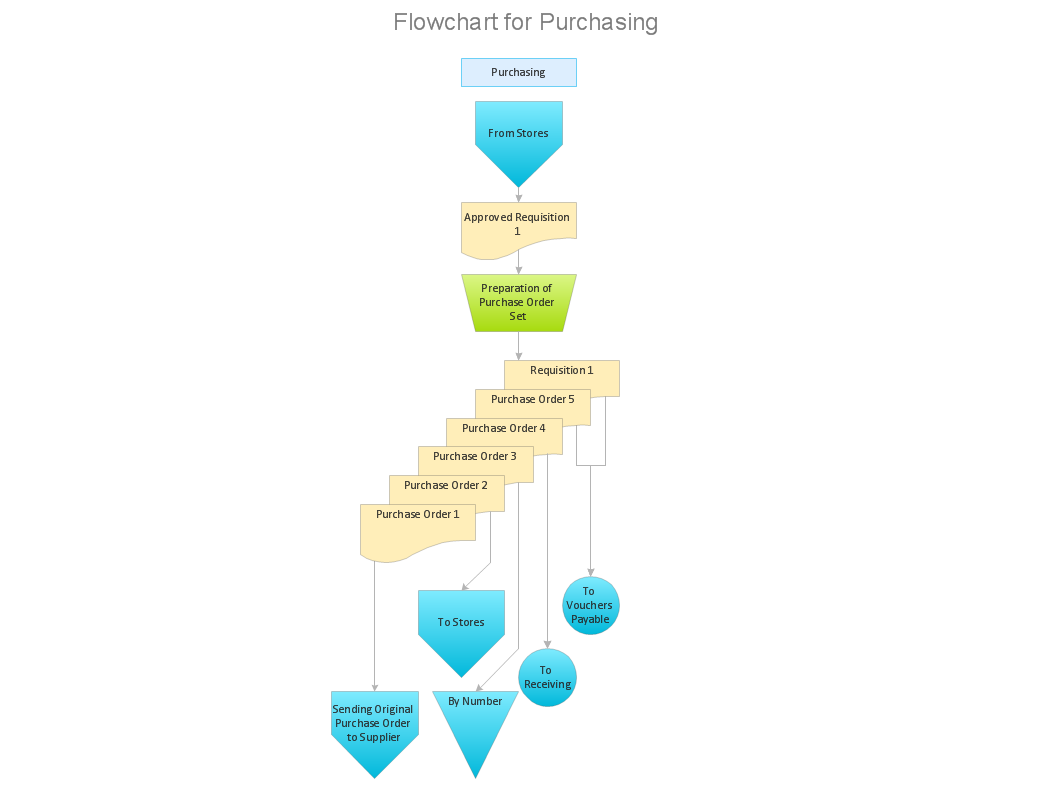
Picture: Workflow to Make a Purchase.Accounting Flowchart Example
Related Solution:
Sales process engineering is a complex and labour-intensive process which requires a lot of time, efforts, and powerful software. We recommend to use the ConceptDraw DIAGRAM software enhanced with Sales Flowcharts solution from the Marketing area of ConceptDraw Solution Park. It gives the possibility to easy illustrate all sales process steps and their results.
Picture: Sales Process Steps
Related Solution:
How to draw pictorial chart quick, easy and effective? ConceptDraw DIAGRAM offers the unique Pictorial Infographics Solution that will help you!
Pictorial Infographics solution contains large number of libraries with variety of predesigned vector pictograms that allows you design infographics in minutes. There are available 10 libraries with 197 vector pictograms.
Picture: How to Draw Pictorial Chart. How to Use Infograms
Related Solution:
Identify how factors influence each other. Factors mostly influencing called “Drivers” Primarily affected factors called “Indicators”. Problem solving further focuses on changing driver factors by corrective actions. Indicator factors help establish KPI (Key Performance Indicators) to monitor changes and the effectiveness of corrective actions in resolving a problem.
Picture: Relations Diagram
Related Solution:
Total quality management is the one known to be consisting of some organization-wide efforts put in order to install and to make some climate in which this organization can continuously improve its ability to deliver the high-quality products and services to its customers permanently.
Picture: Total Quality Management Definition
Related Solution:
Identify and Structure Factors. Use the Affinity Diagram to collect and structure factors that impact on a problem.
ConceptDraw OFFICE suite is a software for identify and structure factors with affinity diagram. This is a grouping and structuring of factors that impact on a problem.
Picture: PROBLEM ANALYSIS. Identify and Structure Factors
Root Cause Analysis Tree Diagram. Use the Root Cause Diagram to perform visual root cause analysis. Root Cause Analysis Tree Diagram is constructed separately for each highly prioritized factor. The goal of this is to find the root causes for the factor and list possible corrective action.
ConceptDraw Office suite is a software for problem analysis.
Picture: PROBLEM ANALYSIS. Root Cause Analysis Tree Diagram
The Total Quality Management Diagram solution helps you and your organization visualize business and industrial processes. Create Total Quality Management diagrams for business process with ConceptDraw software.
Picture: TQM Diagram Example
Related Solution: