Affinity Diagram
ConceptDraw DIAGRAM diagramming and drawing software can be used in very many different fields of the business activity, including the Management and Planning one, for making the needed diagrams, such as the affinity ones.
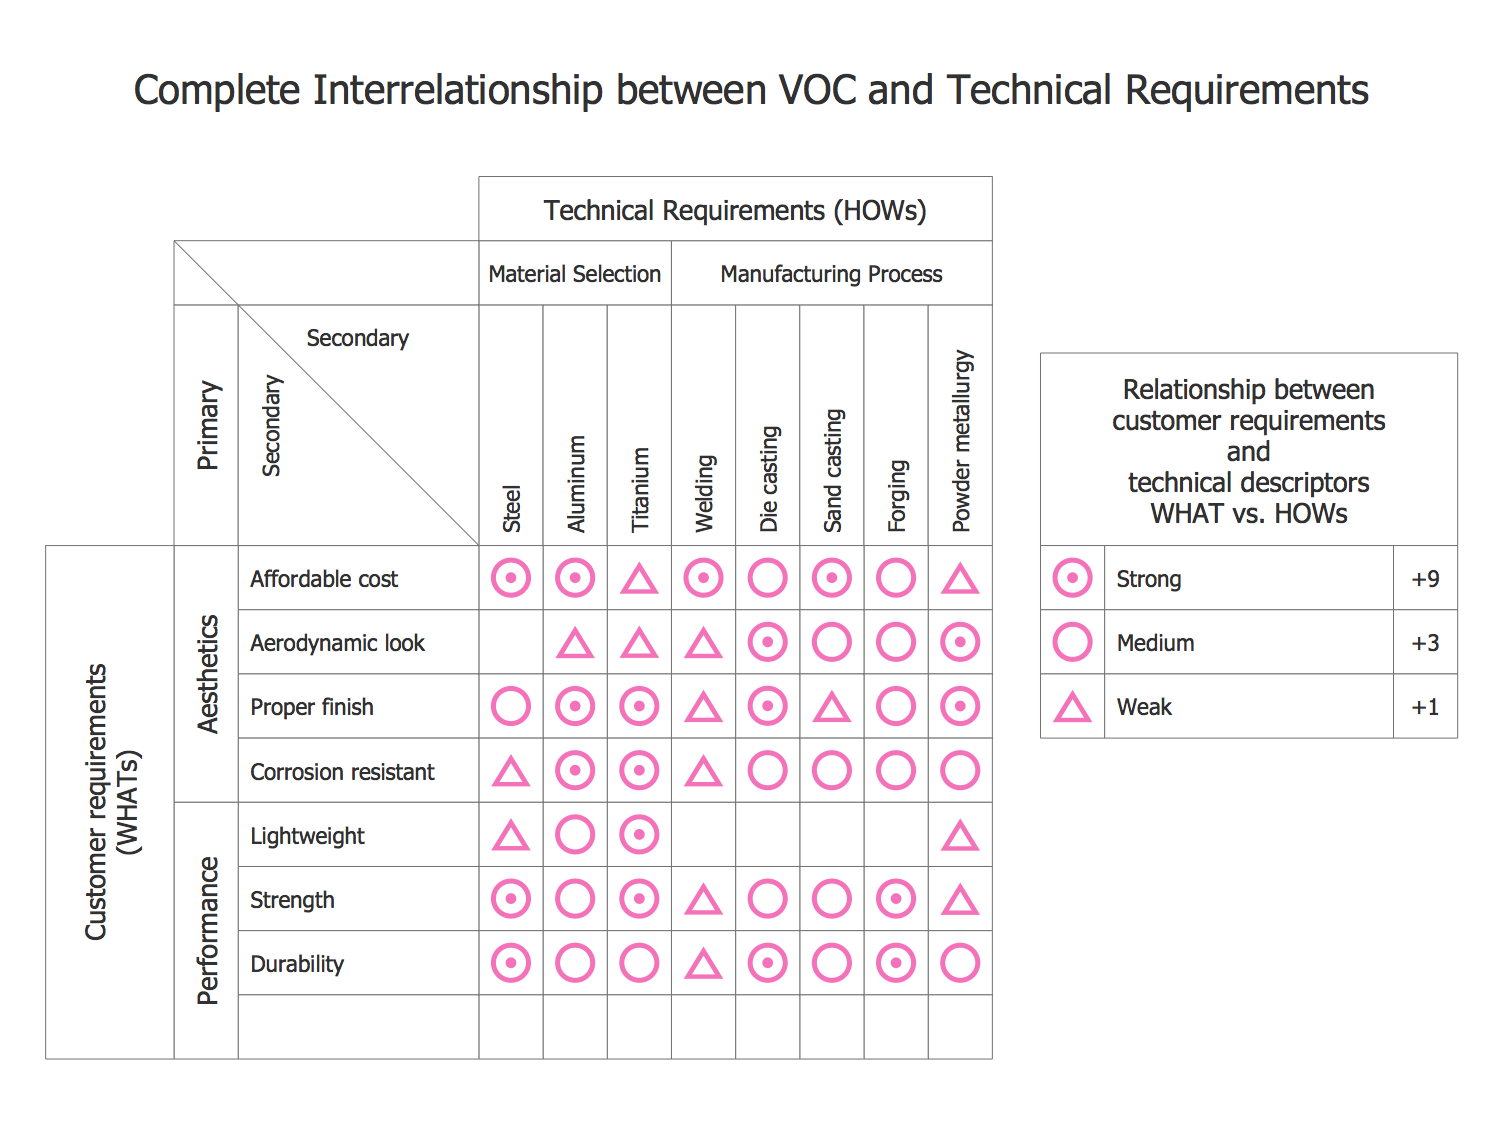
There are known to be all seven different diagrams used within the Management and Planning field of the business activity, called the “Seven Management and Planning Tools”. The mentioned tools have their roots in the Operations Research work done after World War II as we as the Japanese total quality control, known as “TQC”, research. These diagrams are: interrelationship, tree, activity network, matrix one (also known as the quality table), Process Decision Program Chart and Prioritization Matrix.
Affinity diagram is a very special kind, being a “brainstorming tool” for organizing the large amounts of badly organized or disorganized data as well as information into the groupings based on the natural relationships. Created by the Japanese anthropologist Jiro Kawakita in the 1960s, such diagrams were also known to be called as “KJ diagrams”. This kind of diagrams is used when there’s a situation when you are confronted with many different ideas or facts in an apparent chaos, or when the issues seem to be too large and too complex to be grasped.
As it was already mentioned before, the affinity diagram is one of the business tools used to organize ideas as well as data, being one of the Seven Management and Planning Tools. To make it simpler to understand a particular large amount of data, people have been grouping it into different groups, which are usually based on the natural relationships. The term affinity diagram can be associated with the right way to group the needed data as it is very popular for a reason of structuring what needs to be structured for simplifying the understanding the large amount of information. Devised in the 1960s by Jiro Kawakita, the term “affinity diagram” can sometimes be referred to as the so called “KJ Method”, being widely and commonly used by many different specialists working in the very different fields of their business activity, such as planning as well as managing things or people.
The mentioned tool is also commonly used within the project management allowing the large numbers of very different stemming from brainstorming ideas to be sorted into groups, which are based on their so called “natural relationships”. Used for review as well as conducting the analysis of any given data, the affinity diagrams are one of the best tools used for analysing what takes place and what should be done to the situation any company is in right now, simplifying he understanding of the situation and so making it possible to find the way out of the unwanted situation.
The affinity diagrams are also often used in the contextual inquiry for organizing the notes as well as the insights from the field interviews and for organizing other freeform comments, such as support call logs, different survey responses or other qualitative data. The way the affinity diagram work organizing the ideas may look as the following plan, consisting of such steps as recording each of the given ideas on notes or cards, looking for ideas what seems to be related to what in order to group the given data and so sorting the existing cards into different groups until all of them are used.
Once the mentioned cards are sorted into different groups depending on the data and so the tactics itself, the team of specialists working within any particular company in any of the fields of the existing business activities, may sort the large clusters into the sub-groups for simplifying their management as well as the conducting of their analysis. Once completed, any affinity diagram can become a “cause and effect” one by being edited. Although, it may be a challenge to create a needed affinity diagram having lots of data thinking about how to group it, you can still do it within a very short period of time by making it possible to create your own diagram based on the existing ones, previously created by the specialists of CS Odessa, who are those making the ConceptDraw DIAGRAM diagramming and drawing software better and better each day by improving the basic tools as well as developing the new solutions which all can be used by the ConceptDraw DIAGRAM users any time they need them by simply downloading the needed ones from the new product of CS Odessa — ConceptDraw STORE.

Example 1. Seven Management and Planning Tools Solution
Having the mentioned applications guarantees all the ConceptDraw DIAGRAM users can make any needed diagram as well as they have the solutions related to the field of the business activity our clients work in. Thus, to make a great looking as well as smart and very professionally looking affinity diagram, you can simply download the ConceptDraw DIAGRAM software, unless you do not have it yet, from this site as well as the ConceptDraw STORE application, where you can find the needed solution, and so to use the pre-made samples available from each of them like those affinity diagrams from the Seven Management and Planning Tools Solution.
To make the needed affinity diagram, you simply download the Seven Management and Planning Tools Solution from ConceptDraw STORE and start using the existing templates as the drafts for your own great looking diagram, making sure you do the right thing as using the diagrams which were created by the professionals is always the best way to make a sophisticated drawing, especially if you never had a chance to make any similar diagrams before.
Having a choice of the seven libraries within the mentioned solution you can be sure that you can make any of the seven types diagrams, being the Seven Management and Planning Tools drawing such diagrams within only a couple of hours, if you deal with such drawing for the first time, but usually it takes up to an hour to create the needed drawing having all the necessary tools for your use both in the ConceptDraw DIAGRAM software as well as in the ConceptDraw STORE application.

Example 2. Affinity Diagram - Personal Activity
Seven Management and Planning Tools Solution provides 7 libraries for easy applying the Seven Management and Planning Tools and drawing 7 types of diagrams: Affinity Diagram, Relations Diagram, Prioritization Matrix, Root Cause Analysis Tree Diagram, Involvement Matrix, PERT Chart, Risk Diagram (PDPC).

Example 3. Affinity Diagrams Objects Library Design Elements
For quickly creating the Affinity Diagram, use the predesigned vector shapes from the Affinity Diagrams Objects library. Simply drag the desired from them, arrange at your document, type the text, and change color style if needed.

Example 4. Affinity Diagram Template
Another way of drawing is to use as the base the ready template or sample from the offered at the Seven Management and Planning Tools section in ConceptDraw STORE.

Example 5. Affinity Diagram - Business Expansion
The Affinity Diagrams you see on this page were created in ConceptDraw DIAGRAM software using the Seven Management and Planning Tools Solution. These samples successfully demonstrate solution's capabilities and professional results you can achieve. An experienced user spent 15 minutes creating every of these diagrams.
Use the Seven Management and Planning Tools Solution for ConceptDraw DIAGRAM software to create your own Affinity Diagram of any complexity quick, easy and effective, and then successfully use it in your work activity.
All source documents are vector graphic documents. They are available for reviewing, modifying, or converting to a variety of formats (PDF file, MS PowerPoint, MS Visio, and many other graphic formats) from the ConceptDraw STORE. The Seven Management and Planning Tools Solution is available for all ConceptDraw DIAGRAM or later users.