
Example 1. ConceptDraw DIAGRAM - Onion Diagram Maker
Stakeholder Onion Diagrams Solution provides 3 libraries containing 91 ready-to-use vector objects which will help design Stakeholder Onion Diagrams, visualize stakeholder analysis and develop stakeholder management system with ConceptDraw DIAGRAM Onion Diagram Maker in a few minutes.
All these objects are vector, so you can resize them without loss of quality, change their color to make your diagrams more interesting, bright and attractive.

Example 2. Stakeholder Onion Diagrams Solution in ConceptDraw STORE
Stakeholder Onion Diagrams solution is also rich for professionally designed samples and ready for filling templates. All they are available from ConceptDraw STORE which is the best for easy navigation through a ConceptDraw Solution Park. ConceptDraw STORE gives you the quick access to all libraries, templates and samples directly from it.

Example 3. Stakeholder Onion Diagram - AHSNs Structure
The following features make ConceptDraw DIAGRAM the best Onion Diagram Maker:
- You don't need to be an artist to draw professional looking diagrams in a few minutes.
- Large quantity of ready-to-use vector objects makes your drawing diagrams quick and easy.
- Great number of predesigned templates and samples give you the good start for your own diagrams.
- ConceptDraw DIAGRAM provides you the possibility to use the grid, rules and guides. You can easily rotate, group, align, arrange the objects, use different fonts and colors to make your diagram exceptionally looking.
- All ConceptDraw DIAGRAM documents are vector graphic files and are available for reviewing, modifying, and converting to a variety of formats: image, HTML, PDF file, MS PowerPoint Presentation, Adobe Flash, MS Visio.
- Using ConceptDraw STORE you can navigate through ConceptDraw Solution Park, managing downloads and updates. You can access libraries, templates and samples directly from the ConceptDraw STORE.
- If you have any questions, our free of charge support is always ready to come to your aid.
TEN RELATED HOW TO's:
Timeline is a type of diagram which illustrates the series of events in a chronological order on a linear timescale. How to make a timeline? It is convenient to use a modern powerful software. ConceptDraw DIAGRAM diagramming and vector drawing software extended with Timeline Diagrams solution from the Management area is exactly what you need.
Picture: How to Make a Timeline
Related Solution:
Connecting objects manually in ConceptDraw DIAGRAM is a snap:
- points;
- Connecting groups of objects;
- Auto-routing;
- Connectors text;
- Snap to Guides ;
- Quick.
Picture: ConceptDraw Arrows10 Technology
The diagrams and schemes are effective way to visualize the Cloud computing, the differences in their types and how Cloud computing works. Thanks to the ConceptDraw DIAGRAM diagramming and vector drawing software extended with Cloud Computing Diagrams solution from the Computers and Network area of ConceptDraw Solution Park, you can design diagrams as easy and quickly as you need.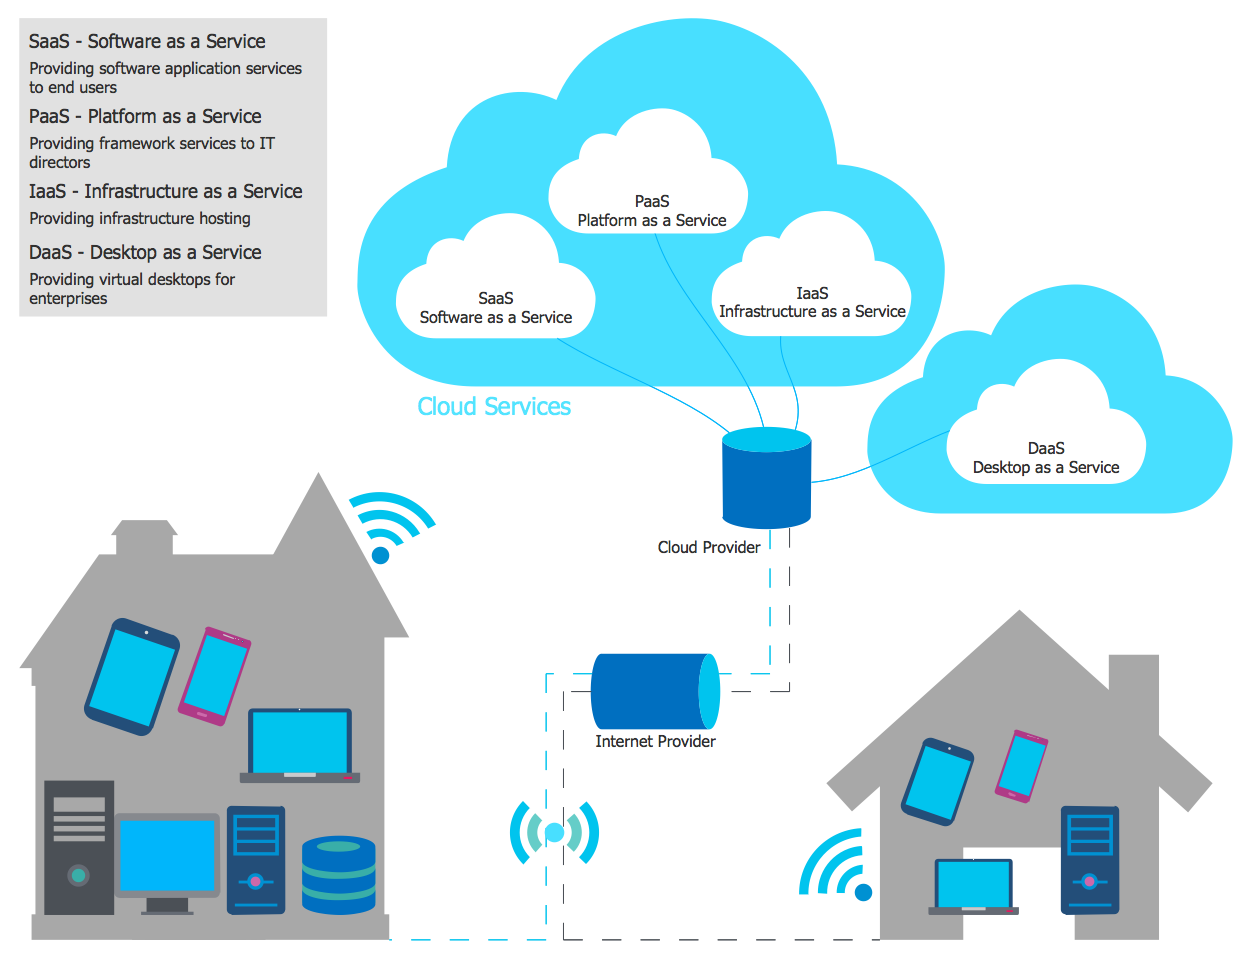
Picture: How Cloud Computing Works
Related Solution:
You need design the Classroom Layout for the school, high-school, university? Now it's incredibly easy to do this in ConceptDraw DIAGRAM software which was supplied with School and Training Plans Solution from the Building Plans Area.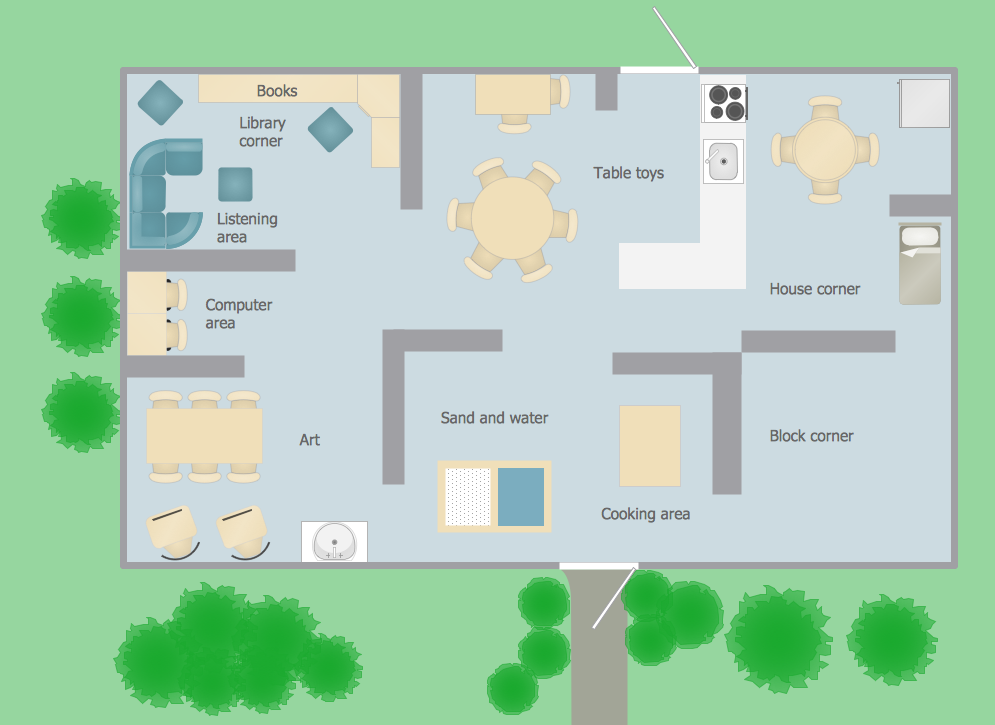
Picture: Classroom Layout
Related Solution:
Interactive tool helps you find the appropriate response to social media mentions quickly.
Picture: How to Use the ″Online Store PR Campaign″ Sample
Related Solution:
It is important to have an electrical circuits scheme, when you plan a renovation or move to a new apartment. You have to arrange interior according to that plan, and it’s trouble-free to create wiring diagrams with ConceptDraw DIAGRAM , furthermore, this software has all the features needed to create an interior plan as well. So, get inspired by tons of examples included to ConceptDraw DIAGRAM solutions, and start your diagramming experience!
A wiring diagrams, that are represented on this drawing was created to depict the components of the electrical circuit schemes. These diagrams are created to depict the information about circuit arrangements and connections. Wiring diagrams, in contrast to physical drawings, use standard symbol's notation to depict different circuit devices and connections. That is why, wiring diagrams are applied to discover and repair electrical and electronic circuits. The vector graphic objects provided by ConceptDraw Electrical Engineering solution can help any specialist in electric engineering to design electrical schemes, circuit and wiring plans, power systems charts, and Maintenance and Repair diagrams.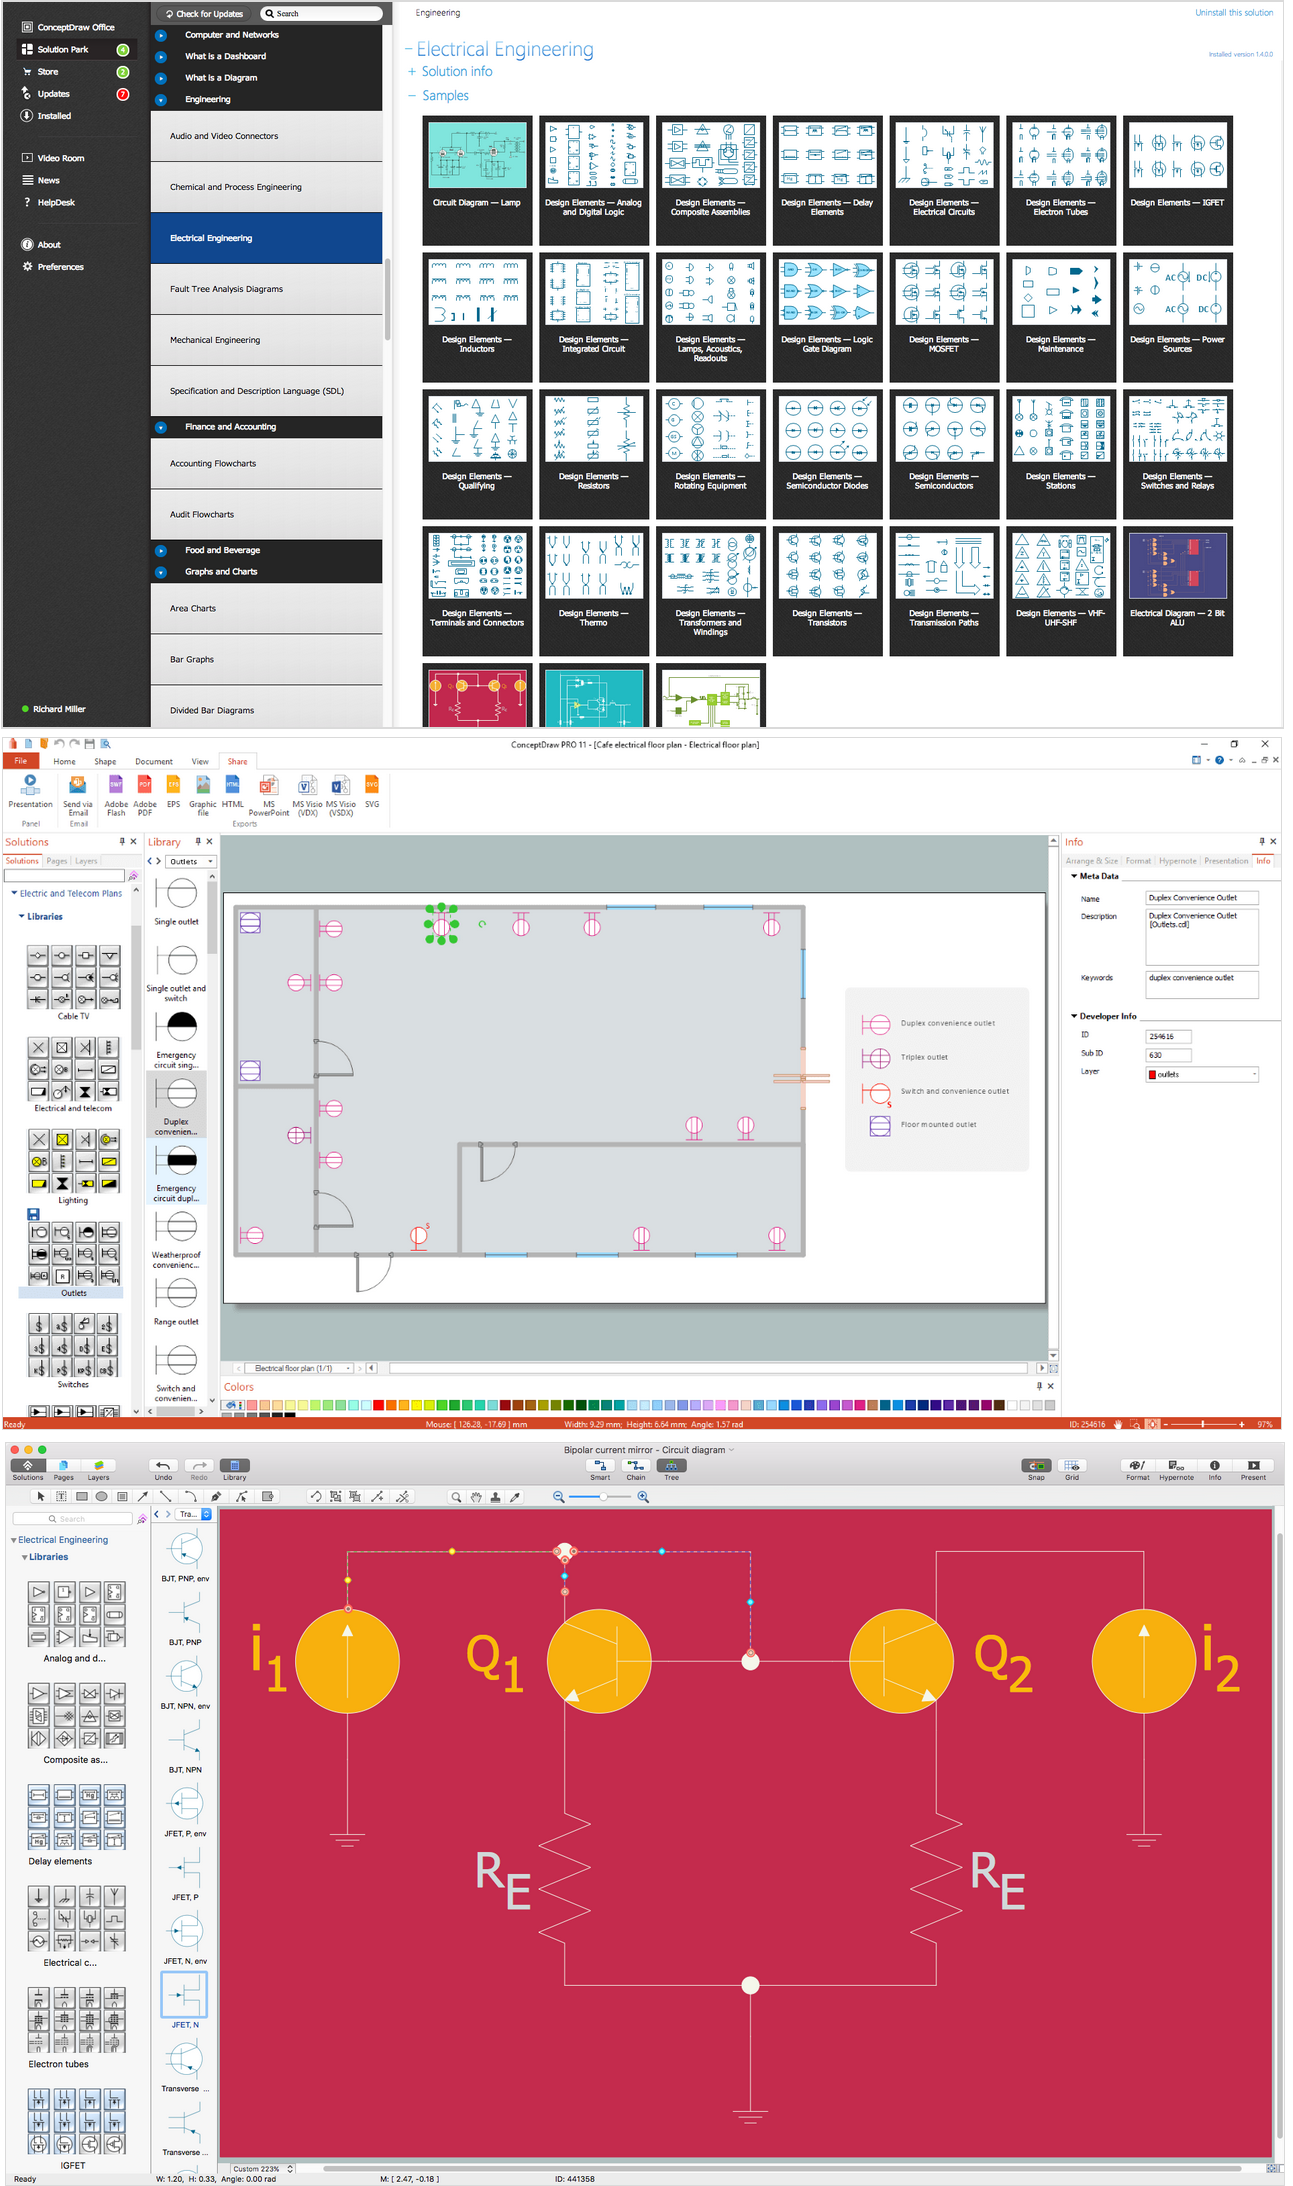
Picture: Wiring Diagrams with ConceptDraw DIAGRAM
Related Solution:
Use ConceptDraw DIAGRAM diagramming and business graphics software for drawing your own PM life cycle flow charts.
Picture: Program to Make Flow Chart
Related Solution:
A Home Area Networks (HAN) is a type of local area network that is used in an individual home. The home computers can be connected together by twisted pair or by a wireless network. HAN facilitates the communication and interoperability among digital devices at the home, allows to easier access to the entertainments and increase the productivity, organize the home security.
This example was created in ConceptDraw DIAGRAM using the Computer and Networks Area of ConceptDraw Solution Park and shows the home network diagram.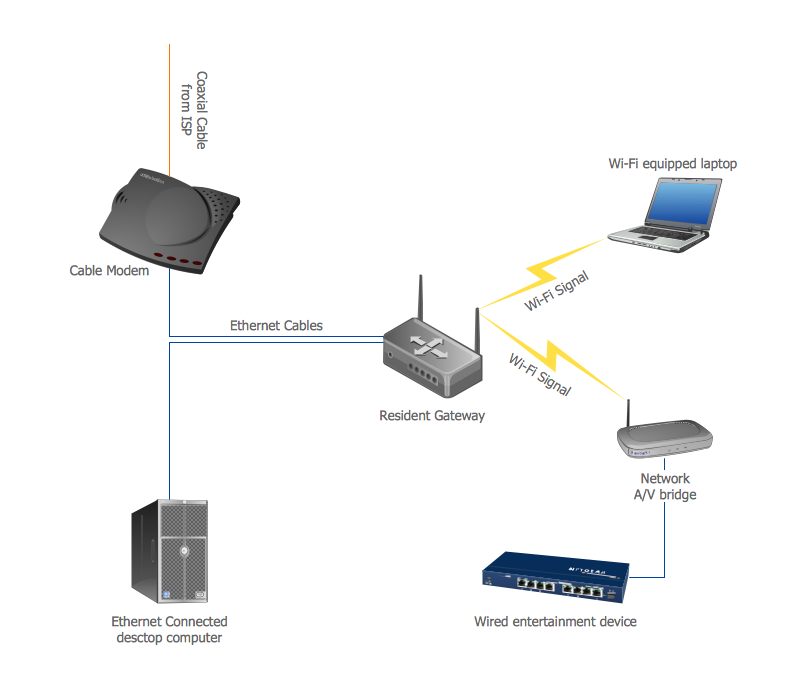
Picture: Home area networks (HAN). Computer and Network Examples
Related Solution:
ConceptDraw PROJECT is simple project management software for planning projects, it include tools for planning project objectives. This type of project planning software intended for professional who use project terms daily. CoonceptDraw PROJECT can be used as customer project management software to keep on track on-site operations. It often used for planning marketing activity as marketing project management software, also it used as simple project management software for software development projects.
Picture: ConceptDraw PROJECT Project Management Software Tool
Matrix organizational structure is one of the main forms of structures which is actively used by organizations to carry forth the functions of a company visually and effectively.
Now we have ConceptDraw DIAGRAM diagramming and vector drawing software extended with 25 Typical Orgcharts solution from the Management area of ConceptDraw Solution Park which will help easy represent matrix organizational structure of any degree of complexity.
Picture: Matrix Organization Structure
Related Solution:


