Competitor Analysis
Competitor analysis is a first and obligatory step in elaboration the proper corporate marketing strategy and creating sustainable competitive advantage. It is actively used for:
- development a marketing strategy,
- elaboration the assortment, price and product policy,
- forecasting of the sales plan,
- development the product promotion strategy,
- detection of opportunities and threats.
Competitor analysis includes detailed research of environment in which organization is operating and activities of the main players in given field, their strategies, intentions and opportunities, also includes the Porter’s five forces analysis, Value chain analysis and ends by detailed SWOT analysis of competitors. The main goal of competitor analysis in any field is obtaining sufficient information and assessment of the strengths and weaknesses of current and potential competitors, that's why is important to make systematically the competitor analysis.
The competitor analysis contains obligatory the steps for:
- detailed research your industry,
- definition of competitors,
- determining target market and customers,
- definition key success factors for your industry.
During this entire study and analyze process are created illustrative diagrams, charts, matrices to visually represent analyze and research results with a goal of easy strategic decision making and to develop the unique correct marketing strategy, effective branding strategy and positioning strategy. It is incredibly convenient to make them using the powerful opportunities of numerous solutions from ConceptDraw Solution Park.
Use for effective competitor analysis:
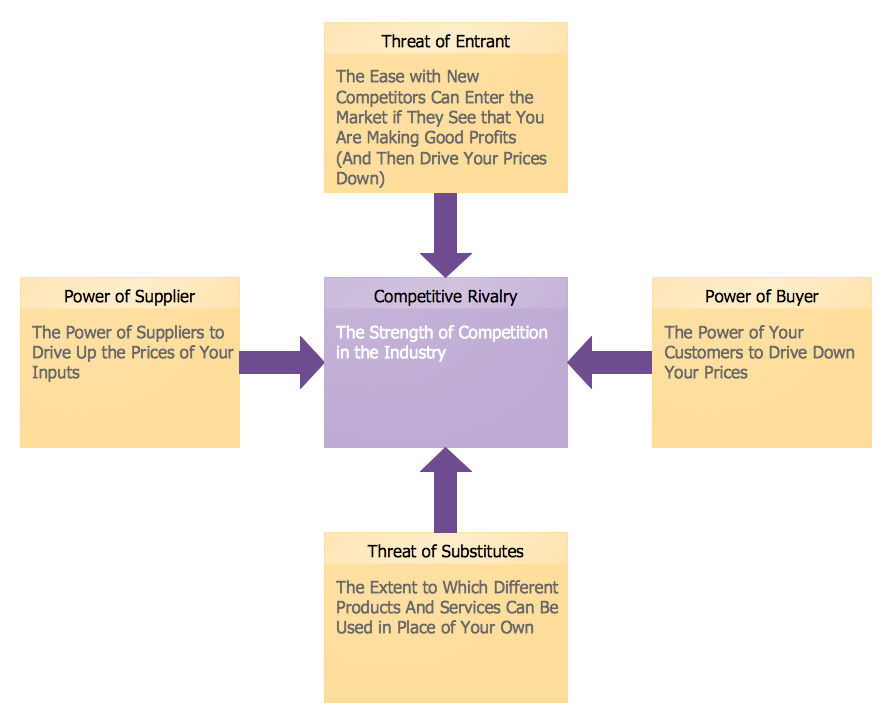
Marketing area, Marketing Diagrams solution: Five Forces Model,
Porter's five forces analysis is a framework developed in 1979 by Michael E. Porter which is based on the paradigm structure–conduct–performance and describes 5 structure units inherent for each industry. Porter's five forces analysis is used for understanding the industry's structure, for assessing and analysis the competitiveness, for developing business strategy, for building the competitive advantage and long-term profitability of the product.
Porter’s five forces analysis is actively used to identify the market attractiveness and potential profitability of new products and services, for determining competitive intensity and areas of strength, and helps companies to improve weaknesses and become more profitable.
Six Markets Model.
Referral markets, supplier markets, internal markets, recruitment markets, influence markets, and customer markets are six main markets for marketing. This Six Markets Model illustrates them all. It is important for organization to actively interact with internal and external environment, the Six Market Model helps the organization to study and analyze the key market domains and the stakeholders.

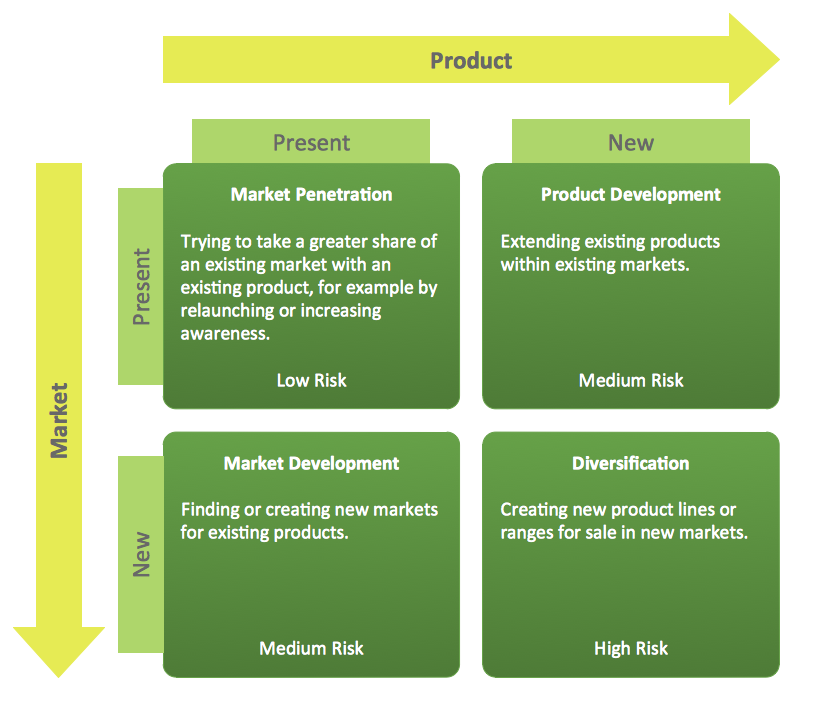
Marketing area, Matrices solution: Ansoff Matrix,
The Ansoff Matrix developed by Igor Ansoff is a strategic planning tool that devises and highlights four main growth strategies of the company. The main of them is diversification strategy which requires a company to create new products, to acquire new skills, to learn new markets and new techniques with a goal to increase the sales volumes.
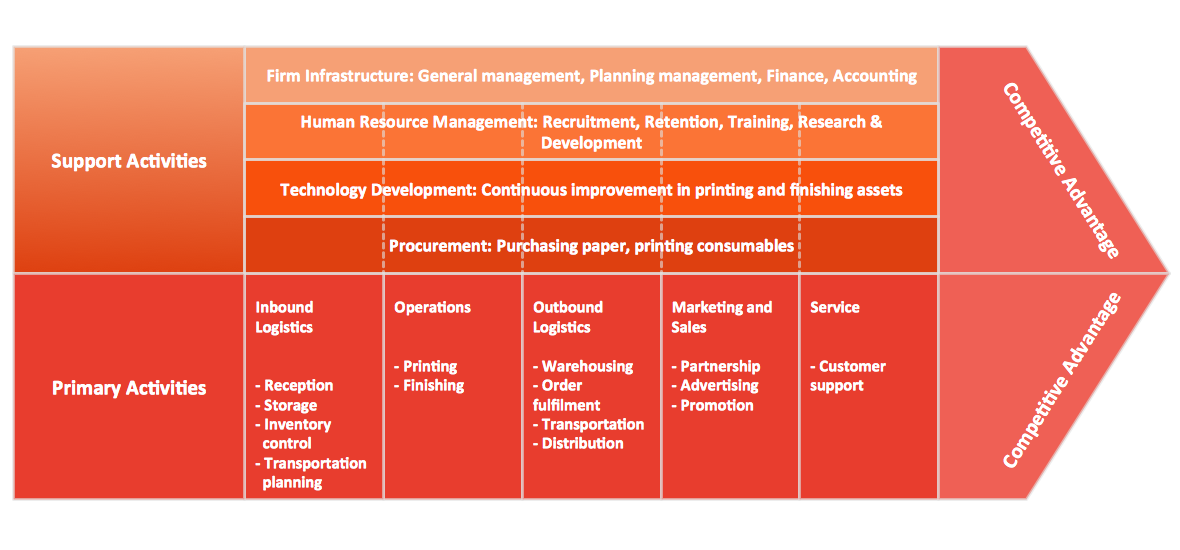
Porter's Value Chain,
Porter’s Value chain concepts includes 9 steps and helps to differentiate the company's products by analyzing the chain of events which occur within a given company - beginning from the purchase of raw materials to the delivery of goods and post sales service.
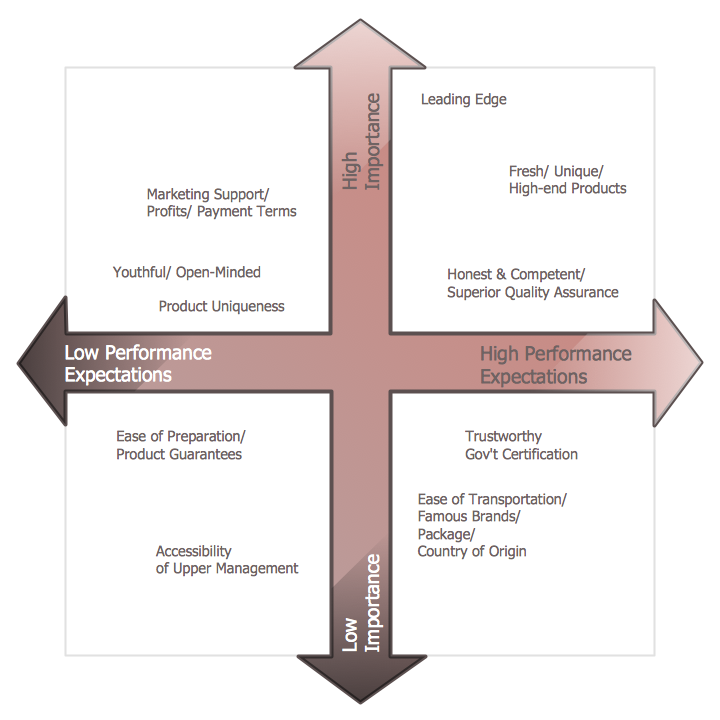
Positioning Map,
Positioning Map is used in marketing to create effective market positioning strategy for a new product, product line, brand or service, and defines quality of products / services in relation to other similar competitive products.
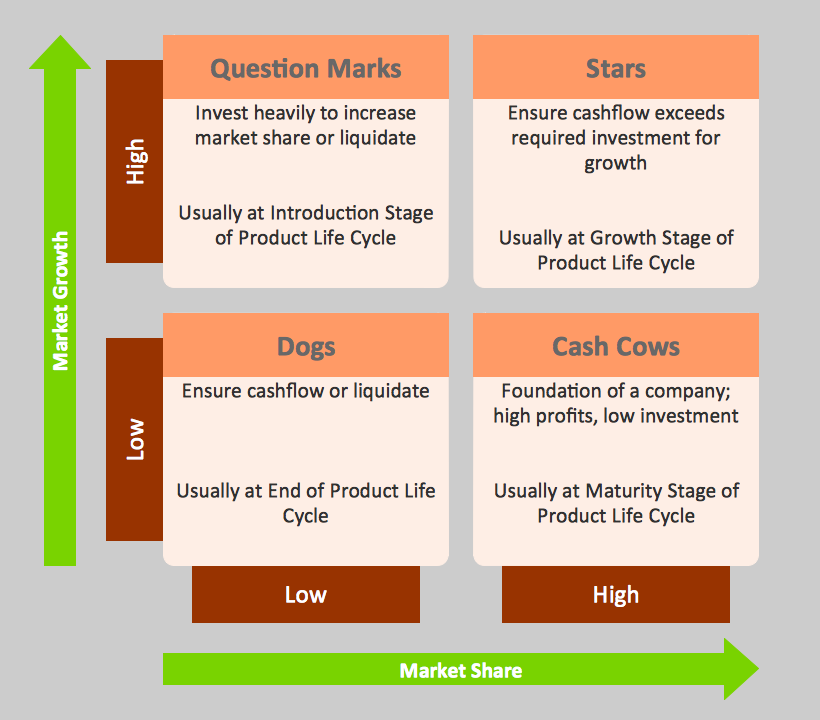
Boston Market Growth — Share Matrix (BCG),
Growth — Share Matrix developed by Bruce D. Henderson for the Boston Consulting Groups is an analytical tool which is widely used by corporations in product management, strategic management, brand marketing, portfolio analysis, and helps them analyze their product lines.
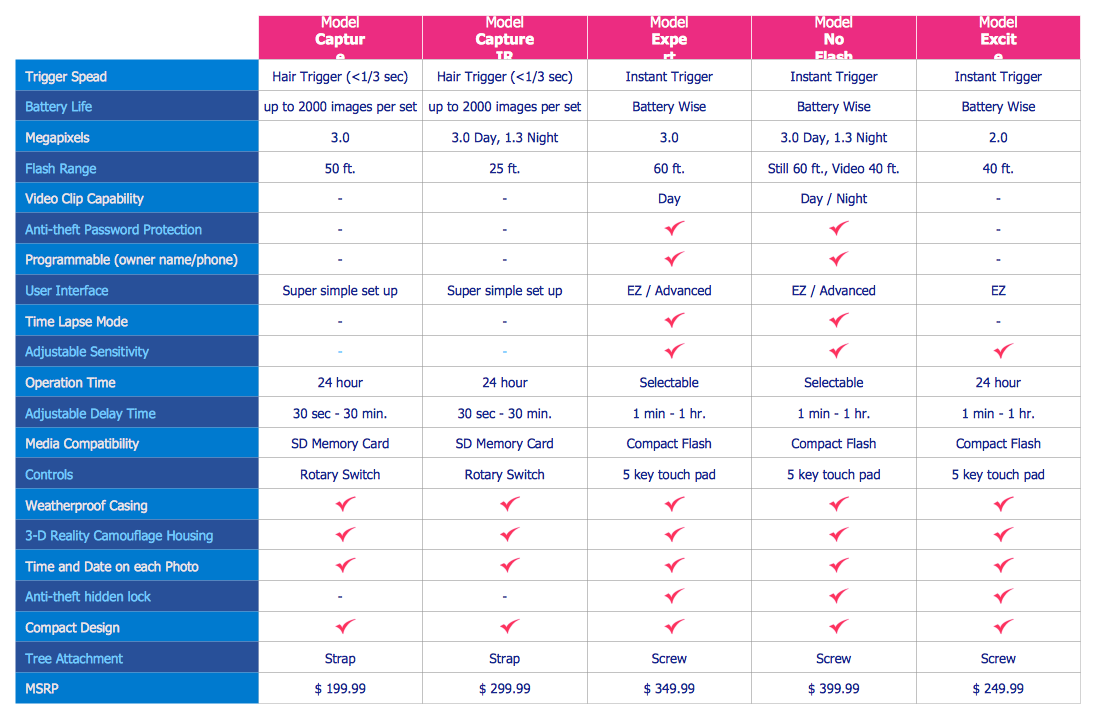
Feature Comparison Chart,
The Feature Comparison Chart is one of the basic competitor analysis tools. This Competitive Feature Comparison chart is a matrix which lets visually represent, compare and analyze the features and functionality of competitive products or services.
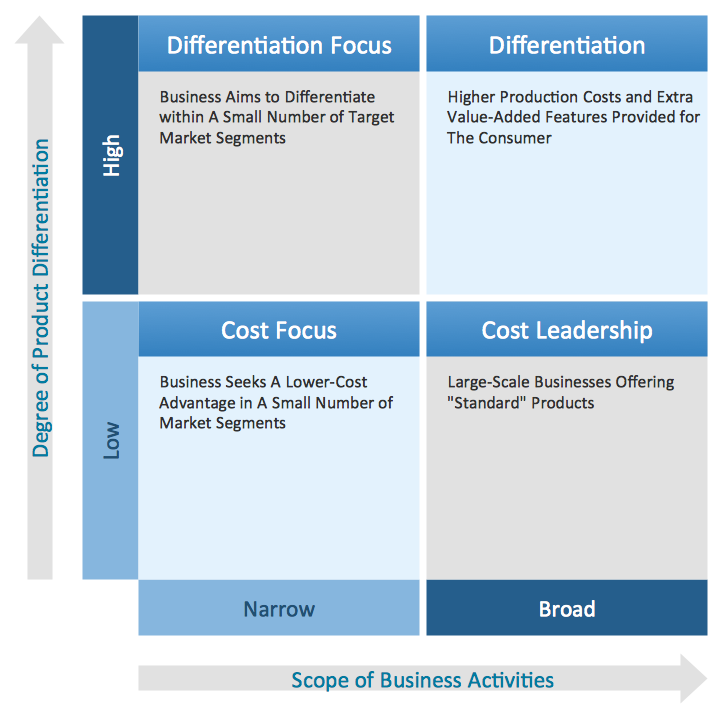
Competitive Strategy Matrix,
This Competitive strategy matrix describes the strategies and categories used by businesses to achieve the competitive advantage: cost focus, cost leadership, differentiation and differentiation focus. Cost focus and differentiation focus are narrow in scope, two other categories are relatively broad in market scope.
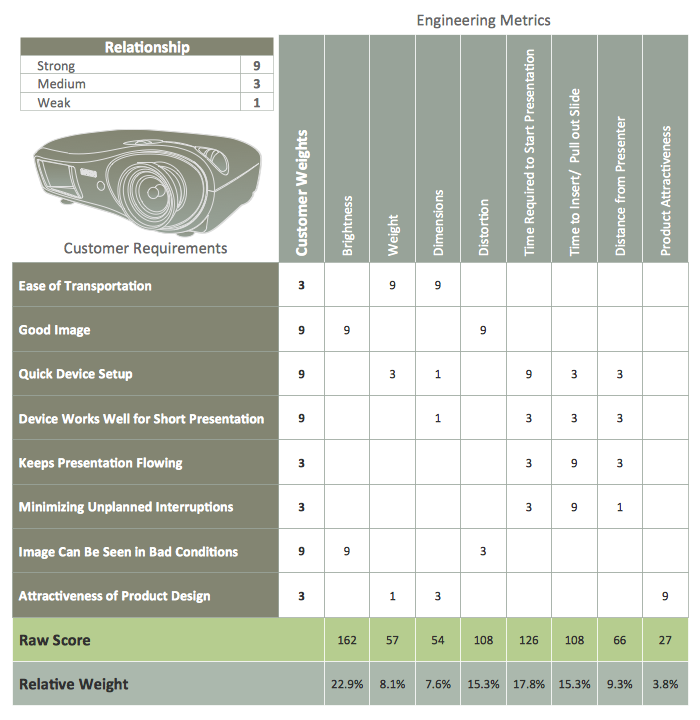
Quality Function Deployment Chart,
Quality function deployment (QFD) is a method which helps transform the customer needs into engineering characteristics of a product or service. Quality function deployment diagrams and matrices define the product requirements, characteristics, priorities and set the development targets for products.
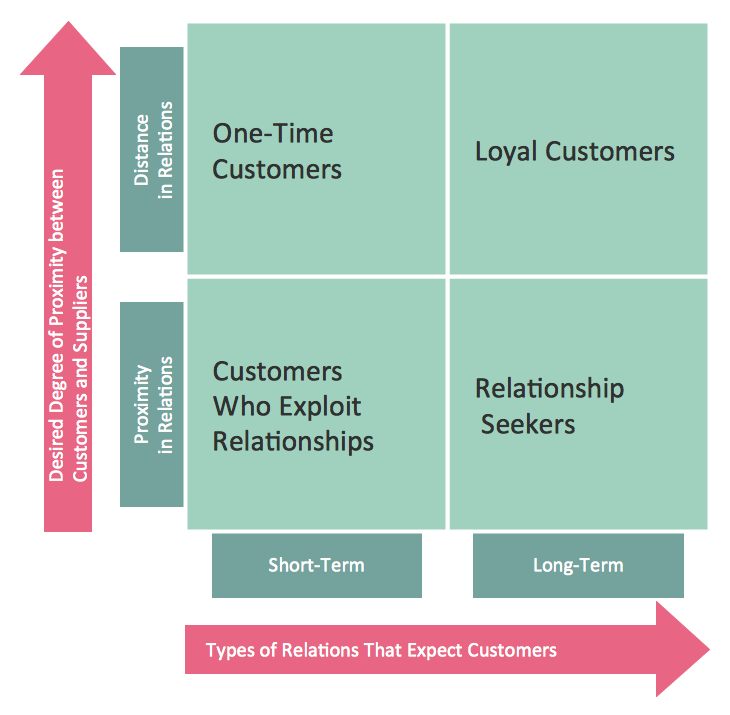
Customer Types Matrix,
This Customer types matrix distributes the customers into four categories: one-time customers and customers who exploit relationships - they have short-term relations with suppliers; loyal customers and relationship seekers which have long-term relations with suppliers. At that, one-time customers and loyal customers categories are characterized by the distance in relations with suppliers, while two other categories have a proximity in relations with them.
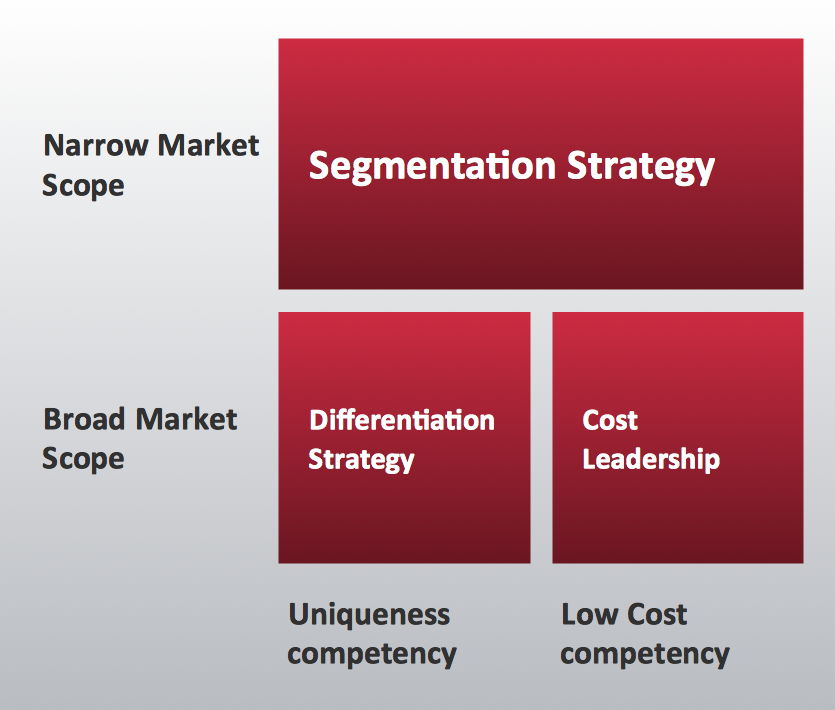
Porter's Generic Strategies Matrix.
Generic strategies developed by Porter in 1980 describe how a company achieves and maintains the competitive advantage in its market area. Three Porter's generic strategies can be applied to any business, and are defined along two dimensions: strategic scope and strategic strength. Strategic scope is a demand-side dimension and strategic strength is a supply-side dimension.
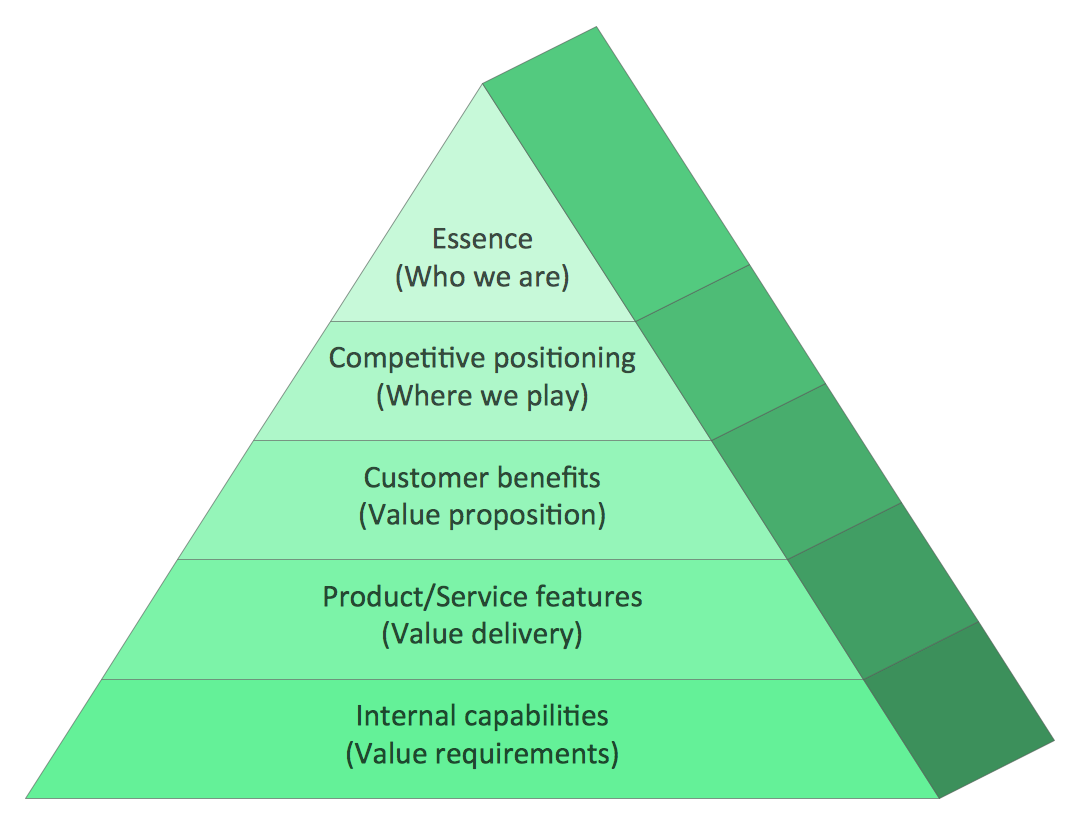
Marketing area, Pyramid Diagrams: Market Value Pyramid,
A Market value is the most probable price at which a product or service can be sold on the open market in a competitive environment. The market value pyramid is used to develop effective marketing strategy and has 5 levels: Essence, Competitive positioning, Customer benefits, Product / Service features, Internal capabilities.
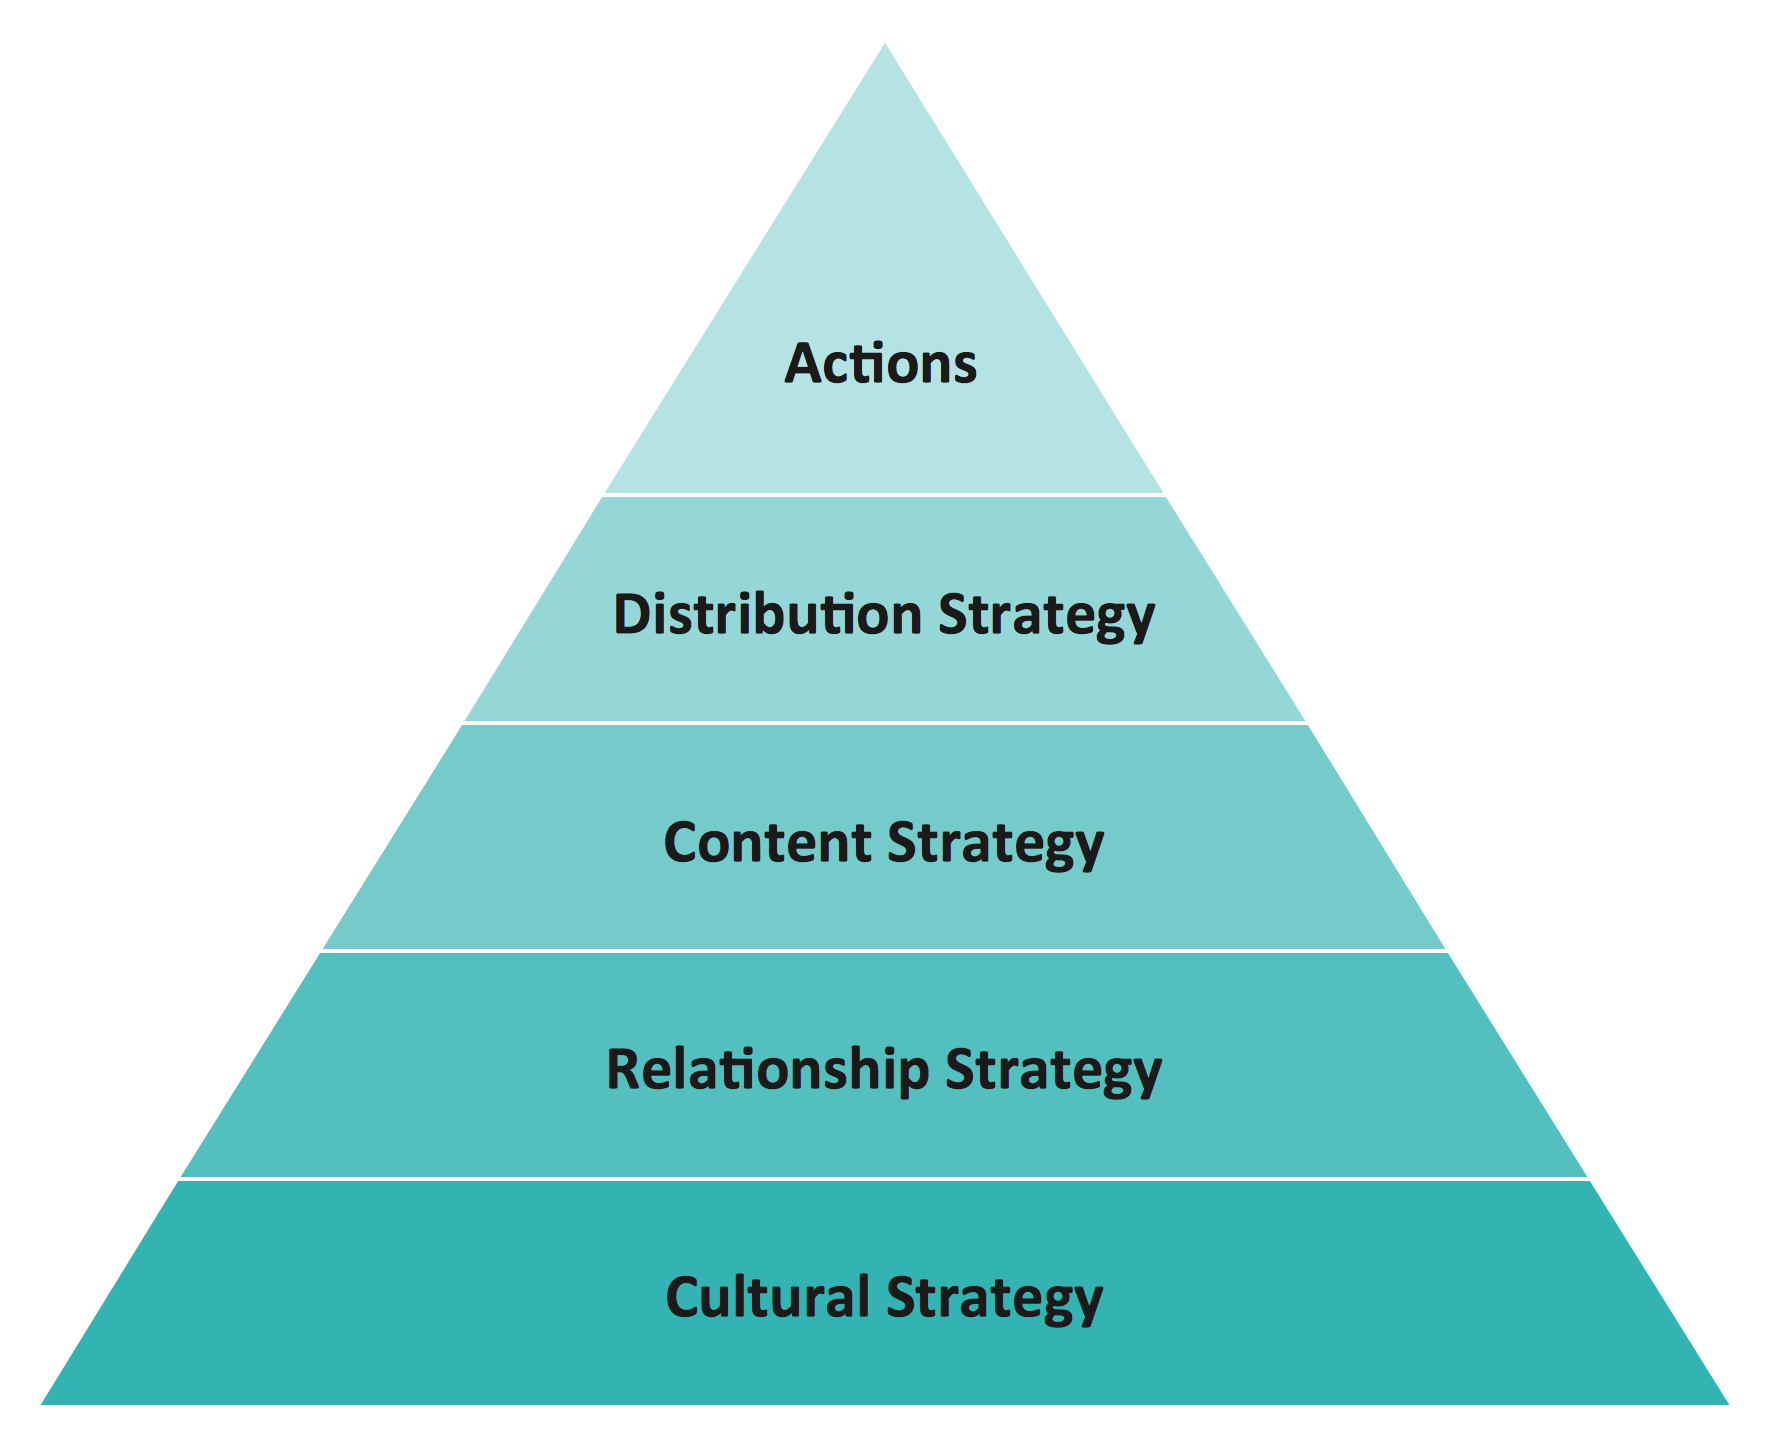
Social Strategy Pyramid,
Social marketing combines marketing concepts with other approaches, progressive researches and practices, influences behaviors and has a goal to benefit people. This social strategy pyramid diagram includes 5 levels: Cultural strategy, Relashionship strategy, Content strategy, Distribution strategy, Actions.
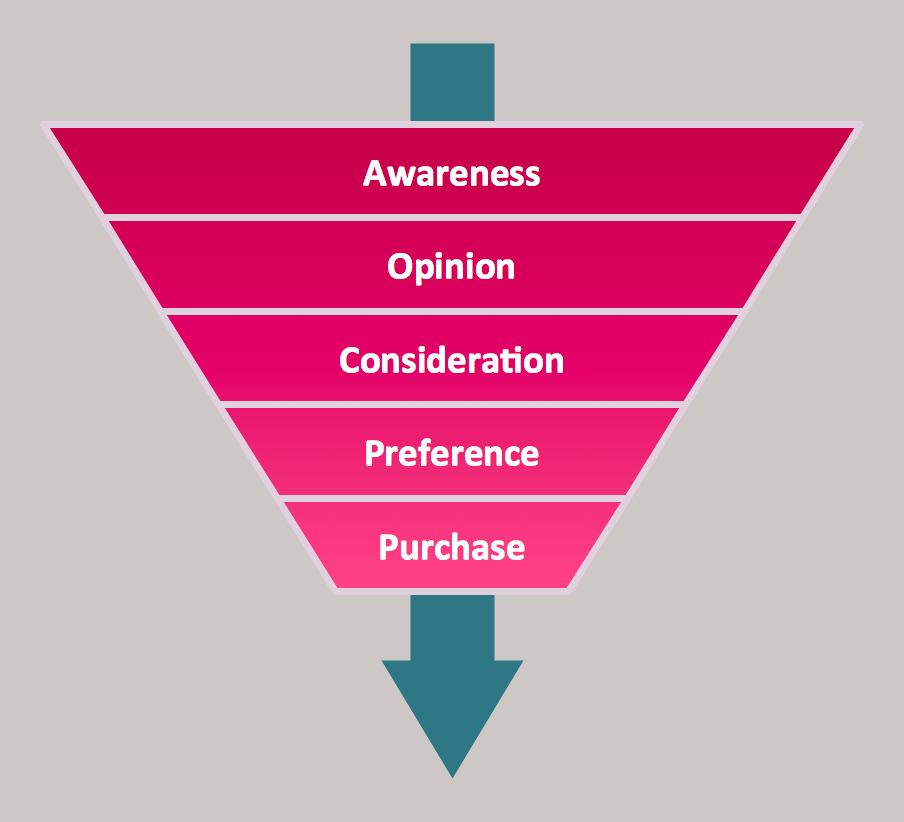
Purchase Funnel.
The purchase funnel is a marketing model oriented on consumers which depict the whole path to the purchase of a product or service, which includes five steps: awareness, opinion, consideration, preference, and purchase.
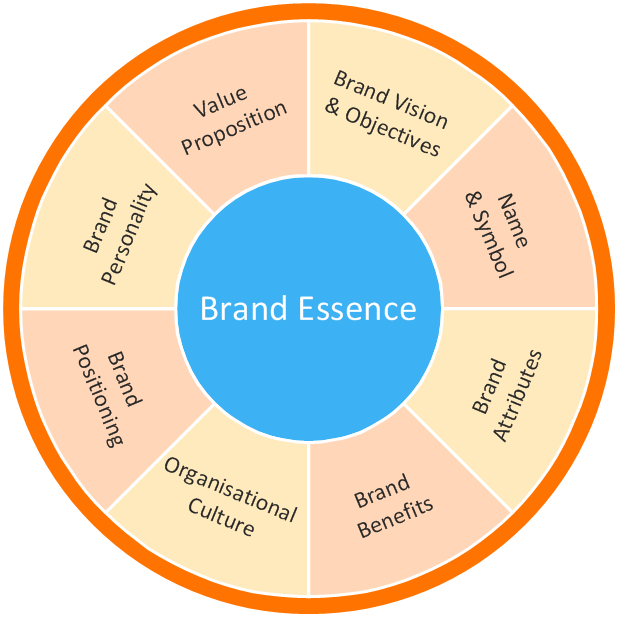
Marketing area, Target and Circular Diagrams: Brand Essence Model Diagram,
Brand Essence is the emotional essence of the brand formulated in few words. Brands are more than simply product names, they create an emotional connection with the buyer, reduce the time of goods selection at the store and of decision making about their purchase. Brand Essence Model Diagram helps to structure the information and describes the key arguments for the choice of brand - attributes, benefits, positioning, personality, and some other characteristics.
Macro-Micro Environmental Forces Diagram,
There are two types of external marketing environments: micro and macro. The factors of these environments greatly influence when creating a marketing strategy. Both micro and macro environment factors are represented on this diagram.

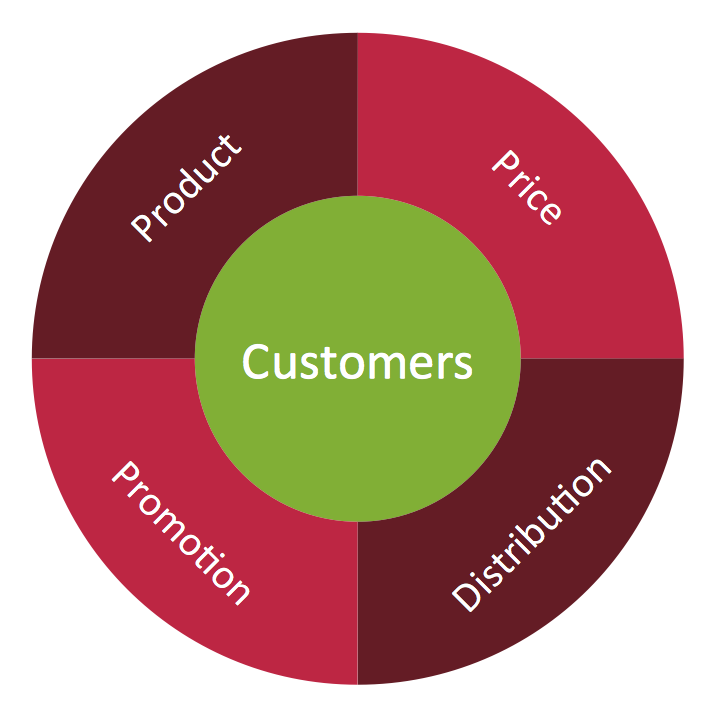
Marketing Mix Diagram,
This diagram depicts the marketing mix business tool which associates the brand or product with the main factors - price, promotion, and distribution, because it's important to place the right product with a right price, at the right time and in the right place.
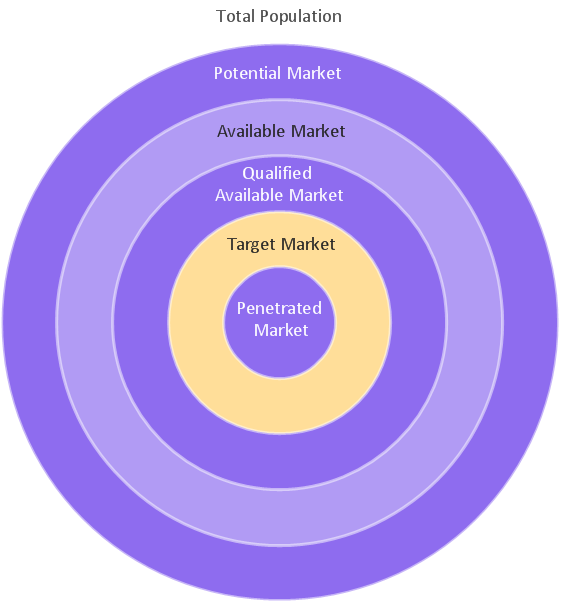
Target Market Diagram.
A target market is the most profitable group of market segments for an enterprise, on which is directed its activities. A target market for each product defines in result of research of different target markets. Correct positioning and precise definition of the target market and target audience are determining factors for the product's success.
Management area, SWOT and TOWS Matrix Diagrams solution, SWOT Matrix,
SWOT Matrix for competitive analysis allows to represent and compare the strengths, weaknesses, opportunities and threats of competitors. It is a powerful analytic tool which helps companies to summarize the risks and opportunities for any company across the value chain.

TOWS Matrix.
TOWS Matrix is an important tool used to evaluate the threats, opportunities, strengths, and weaknesses, and to formulate four types of strategies for an organization: SO (strength-opportunities), WO (weakness- opportunities), ST (strength-threats), and WT (weakness-threats).

Management area, Organizational charts solution, Organizational Chart.
Organizational chart visually represents the structure of an organization and the relationships between its parts and positions, and allows compare the efficiency of organizational structures of competitive companies.

Management area, Timeline Diagrams solution, Timeline Diagram.
Timeline Diagram depicts events and time periods on a chronological scale and allows chronologically compare the market activity of competitors.

Graphs and Charts area, Area Charts solution, Area Chart.
Area Chart allows to visualize changes in values by visually filling in with color the area formed beneath a line that connects data points. Area charts are successfully used to depict the cumulative totals over time.

Graphs and Charts area, Bar Graphs solution, Bar Chart.
Bar Chart is a chart which represents the data using the rectangular bars located vertically or horizontally and having specific heights / lengths proportional to the values that they represent.

Graphs and Charts area, Divided Bar Diagrams solution, Divided Bar Diagram.
A Divided Bar graph is a type of diagram used for visual representation of the collected information and numerical data. It is a rectangle divided into smaller rectangles along its length in proportion to the data.

Graphs and Charts area, Histograms solution, Histogram.
Histogram is one of the seven basic tools of the quality control. It illustrates the numerical data broken into intervals and gives the graphical view about the density of distribution the data.

Graphs and Charts area, Line Graphs solution, Line Graph.
Line Chart is a diagram which allows to compare two variables, depict the change of data over time as a series of data points connected by straight line segments.

Graphs and Charts area, Pie Charts solution, Pie Chart.
Pie Chart is represented as a disk divided into sectors which visualize the percentage of parts to one total and allows compare them.

Graphs and Charts area, Picture Graphs solution, Image Chart.
Image Chart is a type of a bar graph, which visually represents data in various categories using pictures.

Graphs and Charts area, Scatter Diagrams solution, Scatter Chart.
A Scatter Chart displays the data as a set of points with Cartesian coordinates determined by the values of two variables, and is used to visualize how a change of one variable affects another. It is also used for identifying potential nonlinear and linear relationships between variables.

Solutions from Dashboards area:
- Comparison Dashboard
- Composition Dashboard
- Correlation Dashboard
- Frequency Distribution Dashboard
- Meter Dashboard
- Spatial Dashboard
- Status Dashboard
- Time Series Dashboard
let design wide variety of corresponding dynamic dashboards for competitive analysis attached to outside data sources, depict the charts and visual indicators to compare and analyze different business metrics of competitors, the Spatial dashboard thematic maps allow represent the distribution of quantitative business metrics by territories.

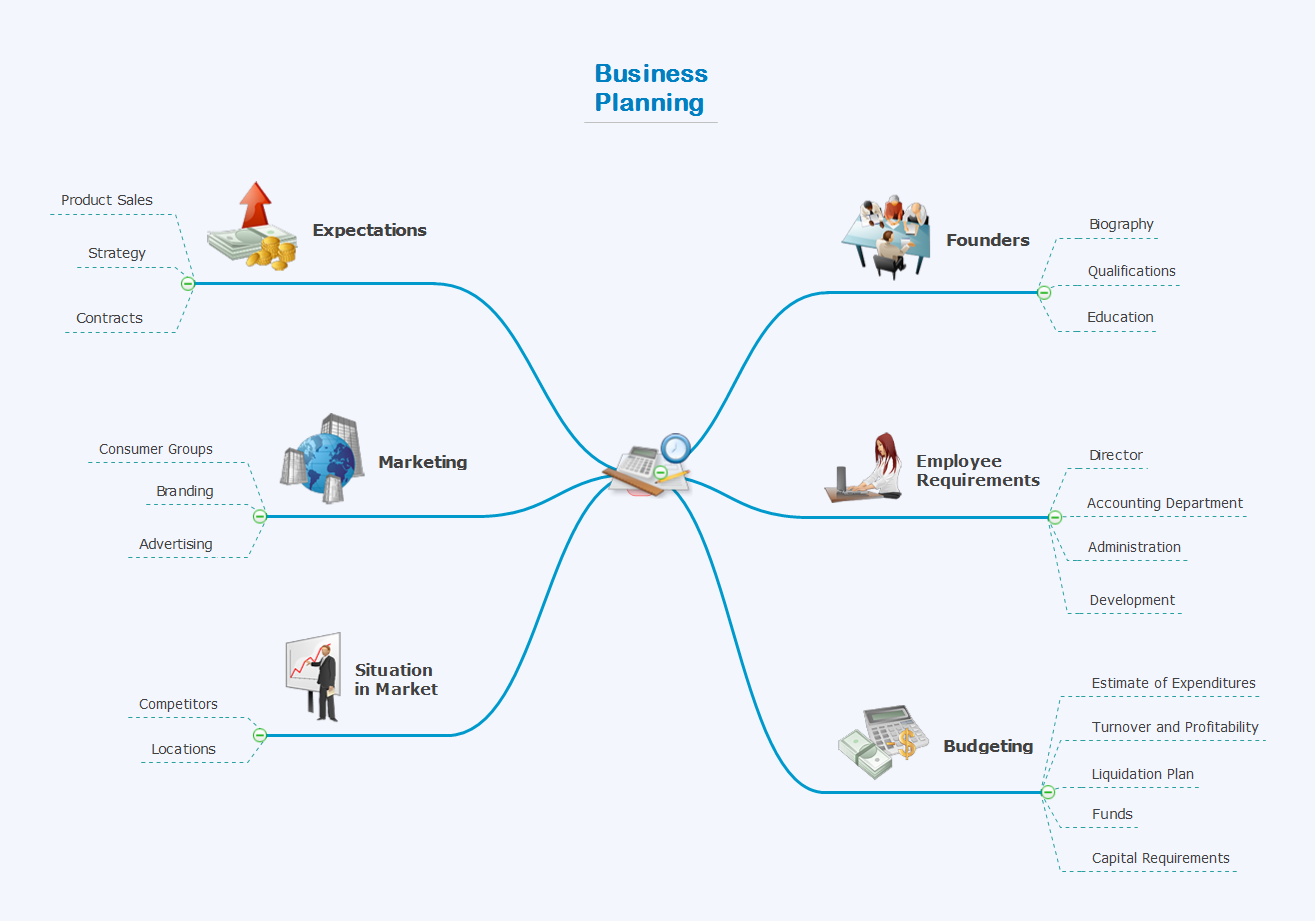
Example 1. Competitor Analysis
Strategy tools
ConceptDraw DIAGRAM is a powerful management drawing software which provides numerous helpful and effective business strategy tools. ConceptDraw DIAGRAM is a powerful management drawing software which provides numerous helpful and effective business strategy tools. Value chain analysis, Porter’s five forces analysis, SWOT analysis, Four corner’s analysis, PEST analysis, BCG matrices, and many other analytical methods are used in strategic analysis. All these strategy tools offered in quantity by multiple solutions of ConceptDraw Solution Park help the companies and businesses to develop, realize and analyze effectively their strategic plans and easy achieve a sustained competitive advantage.

Example 2. Management Drawing Software
ConceptDraw DIAGRAM is the best Management Drawing Software - no other software gives you all this:
- Design and document using a wide range of pre-drawn management shapes and smart connectors.
- Great value for the money, only US$199.
- Free technology support.
- Free examples and built-in templates to help you draw management diagrams rapidly.