
Sample 1. Perceptual map.
This sample shows the Perceptual map. It was created in ConceptDraw DIAGRAM diagramming and vector drawing software using the Matrices Solution from the Marketing area of ConceptDraw Solution Park.
Use the ready-to-use objects, templates and samples from the Matrices Solution for ConceptDraw DIAGRAM to create your own Perceptual maps of any complexity quick and easy.
The Perceptual maps created with ConceptDraw DIAGRAM are vector graphic documents and are available for reviewing, modifying, and converting to a variety of formats (image, HTML, PDF file, MS PowerPoint Presentation, Adobe Flash or MS Visio).
TEN RELATED HOW TO's:
When used in different areas, flowcharts use specific symbols to depict different elements. ConceptDraw DIAGRAM offers libraries of symbols for many areas. One of such libraries is flowchart symbols accounting, which provides symbols for accounting diagrams. Activity-based costing calculates the costs of all products and services based on activities in an organization. A type of accounting flowchart that shows how costs are assigned to products with resources and activities is called Activity-based costing (ABC) flowchart. It can be designed in a digital drawing software such as ConceptDraw DIAGRAM.
Here is an accounting flowchart template and symbols. These flowchart symbols are applied for making accounting flow charts in ConceptDraw DIAGRAM and with its Accounting Flowcharts solution. An accounting flowchart is a specific type of a flow diagram. Practically a number of flowchart-type diagrams commonly utilized to clarify many parts of an accounting department working process. Accounting flowchart assists a process of preparing accounting documentation. It shows who responsible for implementation of each step in the workflow of accounting department.
Picture:
Flowchart Symbols Accounting
Activity-based costing (ABC) flowchart
Related Solution:
Working with personnel might be difficult if you are not prepared enough. To explain your workers all the details of communication with customers, you can draw an order process flowchart which will describe every step of the process and answer all the questions that might appear. You can view a lot of business process mapping diagram examples here, in ConceptDraw Solution Park.
This business process flow chart is created to illustrate the sample work order process. Before an organization can make some work for a person, the customer work order request must be completed. It is needed for tracking and accountability objectives. We used this business process flowchart to show a certain tasks and actions assumed by an organization. This flowchart depicts the outside inputs that are needed to launch a process, and ways the organization delivers its outputs. This business process flowchart was created with a help of ConceptDraw Business Process Mapping solution.
Picture: Work Order Process Flowchart. Business Process Mapping Examples
Related Solution:
You need design pictorial food images to decorate menu of your restaurant or to create beautiful advertising materials? We recommend to use a ConceptDraw DIAGRAM diagramming and vector drawing software extended with Food Court solution from the Food and Beverage area of ConceptDraw Solution Park for easy designing colorful food images.
Picture: Food Images
Related Solution:
When you prepare professional-looking presentation, you need to use ConceptDraw MINDMAP software for the amazing result.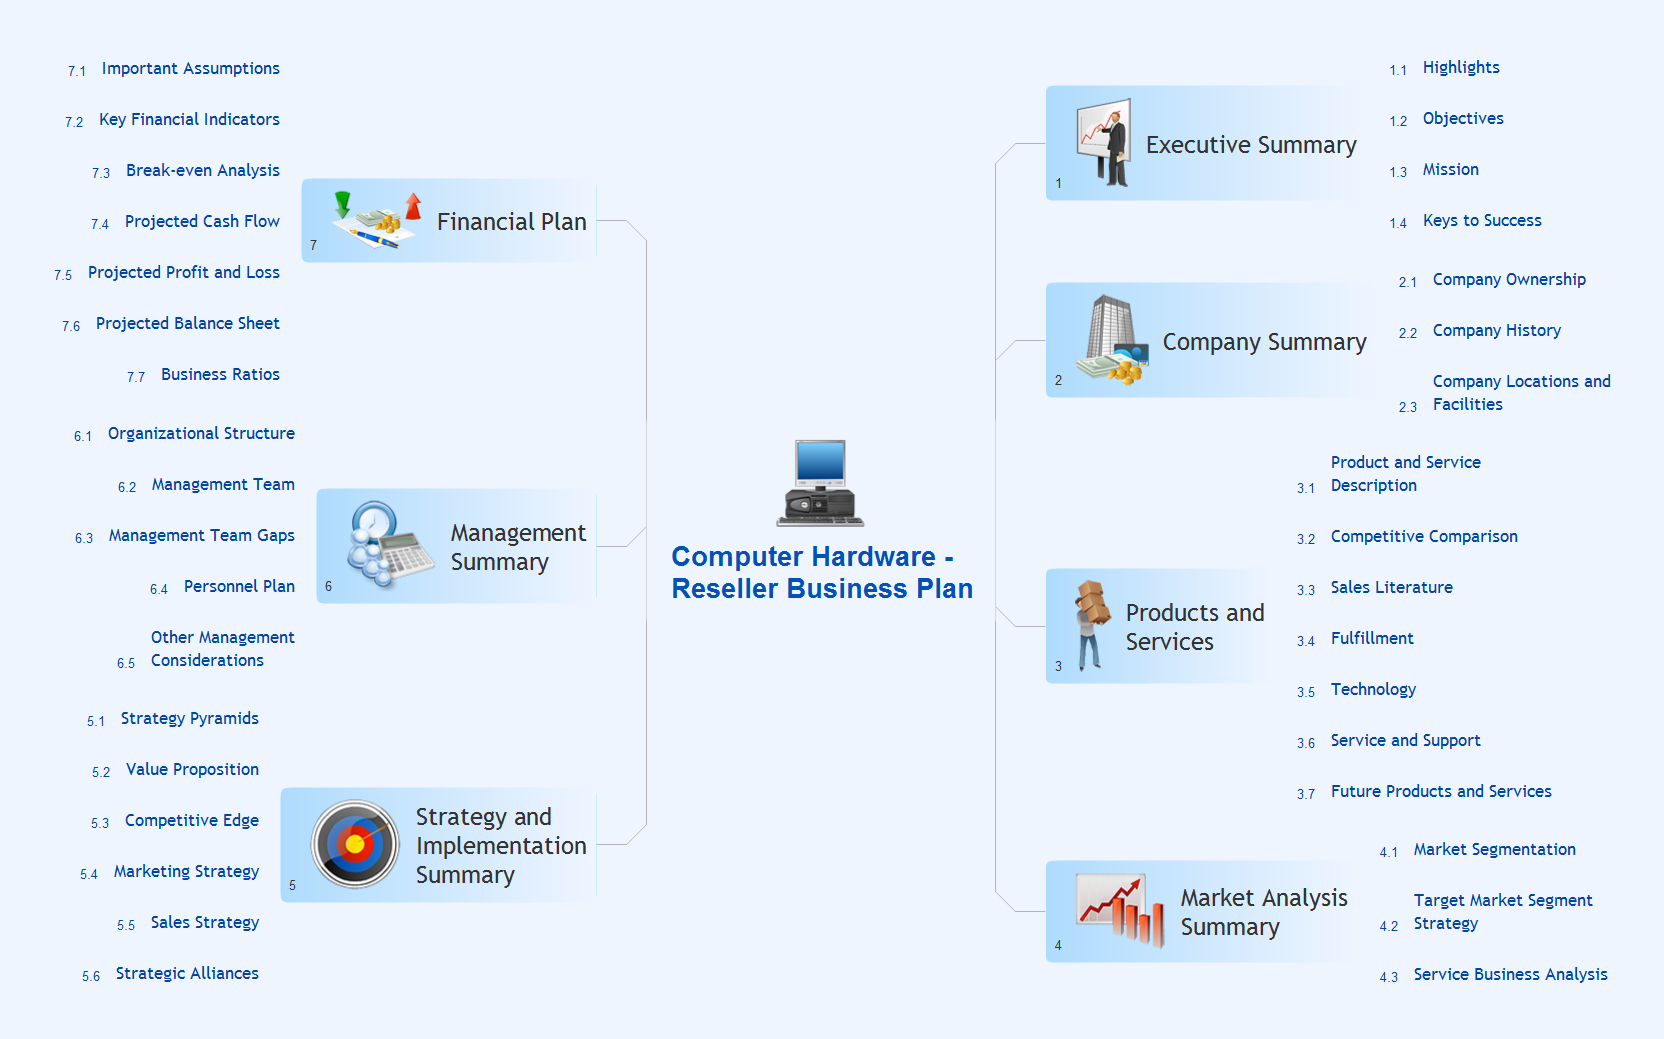
Picture: Create Captivating Presentations Easily
Related Solution:
This sample shows the Polar Graph. The Polar Graph is a graph in the polar coordinate system in which the each point on the plane is defined by two values - the polar angle and the polar radius. The certain equations have very complex graphs in the Cartesian coordinates, but the application of the polar coordinate system allows usually produce the simple Polar Graphs for these equations.
Picture: Polar Graph
pyramida
Picture: Pyramid Diagram
Related Solution:
Risk Diagram (PDPC) - ConceptDraw OFFICE suite is a software for Risks Diagram making. This diagram identifies possible risks in accomplishing corrective actions. With the Risks Diagram, one analyzes each action separately in a tree of all actions and develops a preventive action in response of each potential obstacles or circumstances which may be a risk.
Picture: CORRECTIVE ACTIONS PLANNING. Risk Diagram (PDPC)
Draw your own business process flowcharts using ConceptDraw DIAGRAM diagramming and business graphics software.
The Flowcharts Solution for ConceptDraw DIAGRAM is a comprehensive set of examples and samples in several different color themes for professionals that need to graphically represent a process.
Picture: Flow Chart Diagram Examples
Related Solution:
Need to draw a diagram, process chart, flowchart, organizational chart, graphic design? ConceptDraw can help you to make professional graphic documents quickly.
Picture: Best Diagramming
Related Solution:
Create Quality Engineering Diagrams (value stream maps) - for value stream analysis and value stream management, material and information flow mapping, using our quick start templates included with ConceptDraw.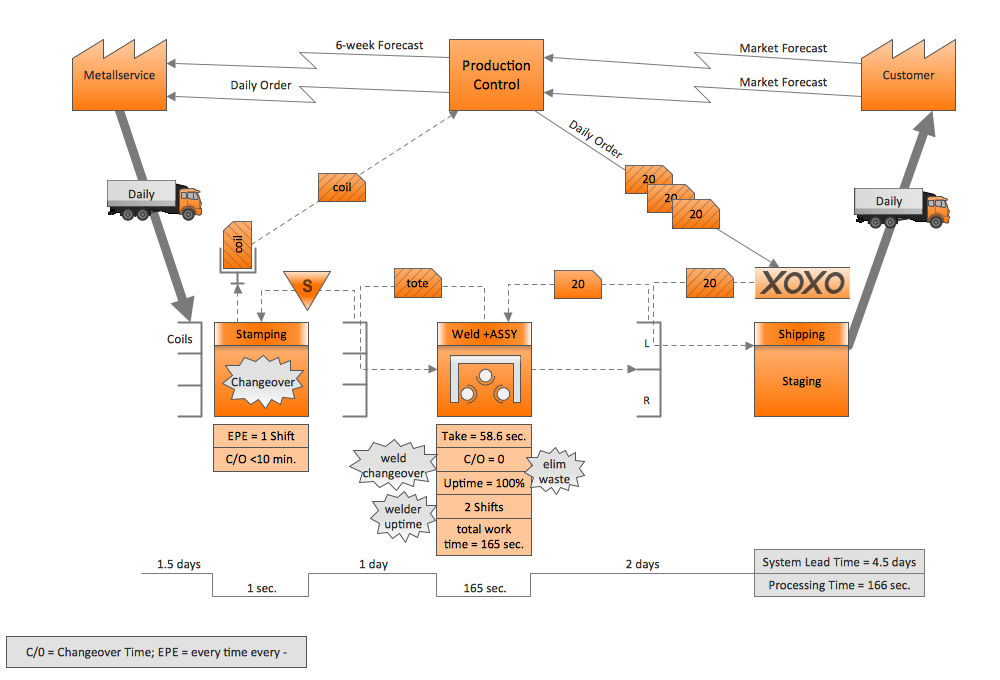
Picture: Quality Engineering Diagrams
Related Solution: