
Sample 2. Organizational chart - University leadership.
This sample was created in ConceptDraw DIAGRAM using the Organizational Charts Solution. This example is based on the organizational chart from the Ohio State University website [osu.edu]
Use the Organizational Charts Solution for ConceptDraw DIAGRAM to create your own Organizational Charts of any complexity quick, easy and effective.
The Organizational Charts designed with ConceptDraw DIAGRAM are vector graphic documents and are available for reviewing, modifying, converting to a variety of formats (image, HTML, PDF file, MS PowerPoint Presentation, Adobe Flash or MS Visio), printing and send via e-mail in one moment.
Se also Samples:
TEN RELATED HOW TO's:
This diagram represents the electrical floor plan. This is a common practice - to draw the electrical plan on the floor plan. The outlets, fixtures and other electrical equipment are depicted on the floor plan with special symbols. This drawing was created using the possibilities of ConceptDraw DIAGRAM as CAD software. Computer-aided design software is intended to replaces manual engineering drafting with an automated process. CAD software is used by engineers, architects, and others to make high-precision technical drawings and illustrations. CAD software allows technical specialists to develop, examine and manage various engineering projects.
It is almost impossible nowadays to imagine mechanical engineering without digital technologies. Finding a suitable CAD software for creating mechanic diagram and electrical diagram architectural designs can take a lot of time and effort. However, with ConceptDraw DIAGRAM you can create any diagram that you want and later convert it to the most popular graphic formats like.vsdx,.png,.pptx etc.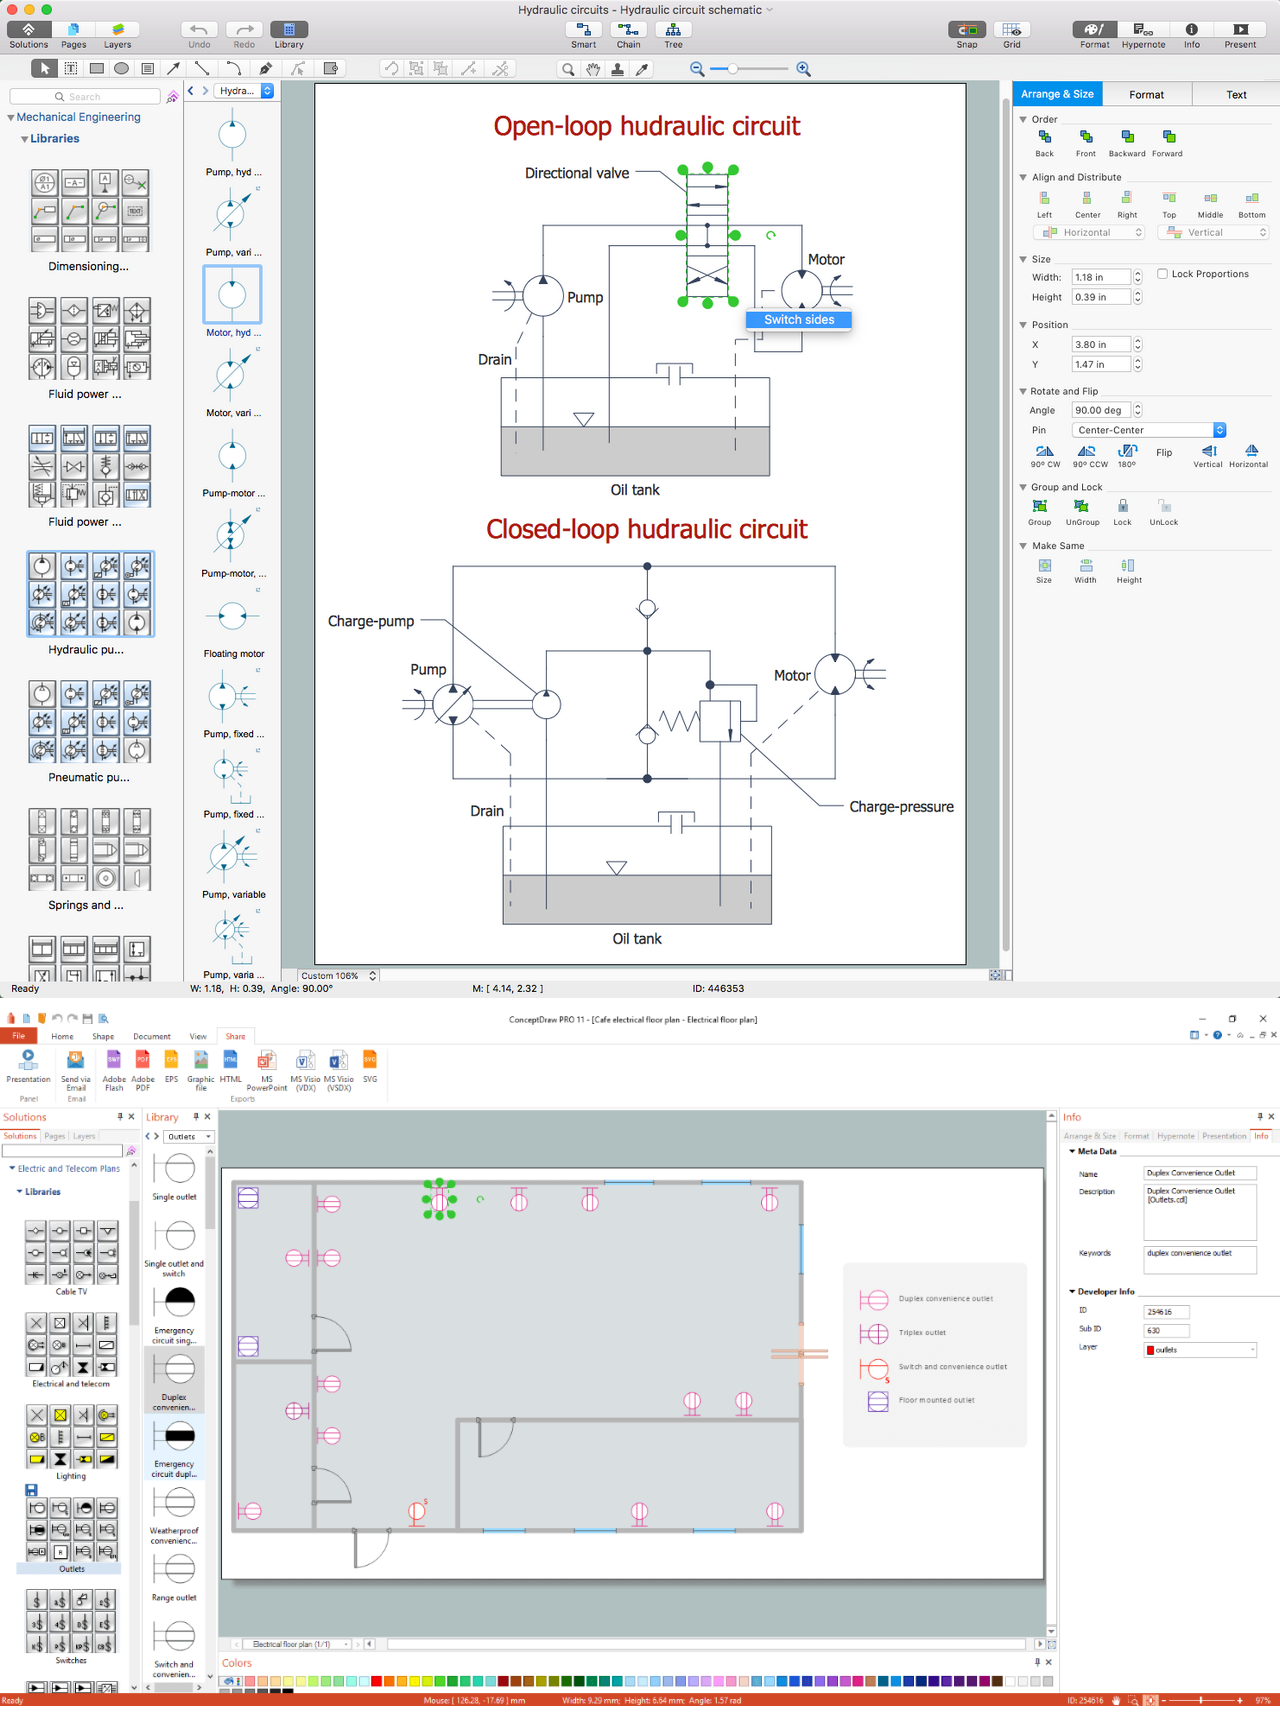
Picture: CAD Drawing Software for Making Mechanic Diagram and Electrical Diagram Architectural Designs
Related Solution:
Is it possible to draw a diagram as quickly as the ideas come to you? The innovative ConceptDraw Arrows10 Technology included in ConceptDraw DIAGRAM is a simple and powerful tool to create any type of diagram.
You mau choose to start from one of plenty diagram templates or to use your own idea.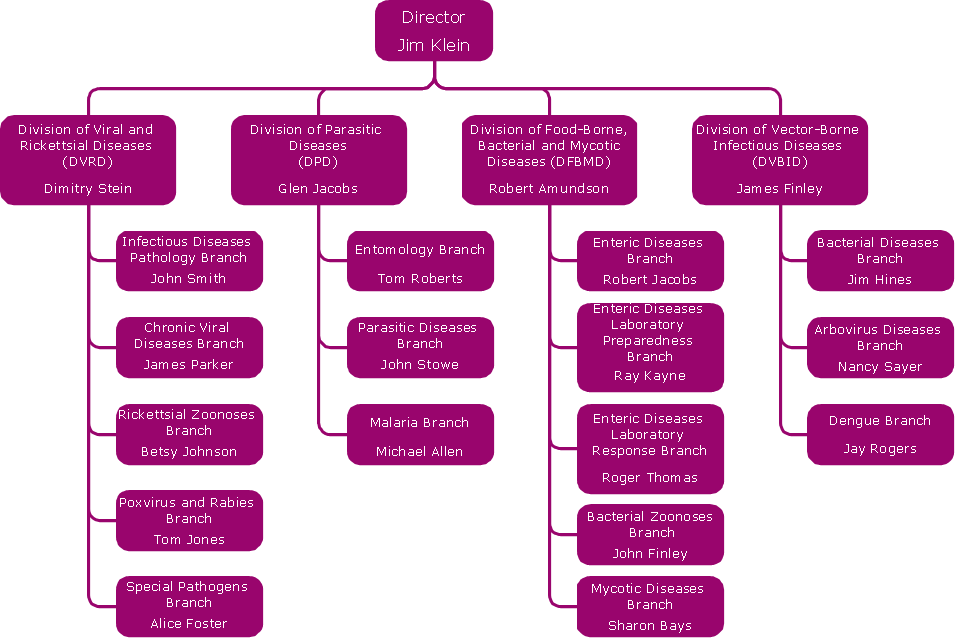
Picture: How To Draw a Diagram
Successful quality management implemented in a company of any size is a critical component of a company organization.
Picture: What is a Quality Management
Related Solution:
The ConceptDraw Flowchart component includes a set of samples and templates. This geathered as flowchart maker toolbox which focused on drawing flowcharts of any industry standards.
Picture: Flowchart Components
Related Solution:
If you want to find a way to understand complex things in minutes, you should try to visualize data. One of the most useful tool for this is creating a flowchart, which is a diagram representing stages of some process in sequential order. There are so many possible uses of flowcharts and you can find tons of flow charts examples and predesigned templates on the Internet. Warehouse flowchart is often used for describing workflow and business process mapping. Using your imagination, you can simplify your job or daily routine with flowcharts.
Warehouse flowcharts are used to document product and information flow between sources of supply and consumers. The flowchart provides the staged guidance on how to manage each aspect of warehousing and describes such aspects as receiving of supplies; control of quality; shipment and storage and corresponding document flow. Warehouse flowchart, being actual is a good source of information. It indicates the stepwise way to complete the warehouse and inventory management process flow. Also it can be very useful for an inventory and audit procedures.
Picture: Flow Chart Example: Warehouse Flowchart
Related Solution:
Enjoy the flowcharting process with the intuitive interface and powerful tools of the user-friendly ConceptDraw DIAGRAM software: ✔️ represent algorithms, ✔️ break down complex processes, ✔️ display workflows, ✔️ show procedures, ✔️ succeed in decision-making, ✔️ streamline processes, ✔️ increase productivity, ✔️ enhance efficiency
Picture: Flowcharting Software
Related Solution:
ConceptDraw MINDMAP with the ability to import presentations from Microsoft PowerPoint, as well as enhancing its existing presentation capabilities.
Picture: Best Mind Mapping Program for Making Presentations
Related Solution:
You can describe your own quality processes, brainstorm, and structure quality issues; then you can easily and quickly present it to your team.
Quality Management Mind Maps - Presentations, Meeting Agendas, Problem will be solved.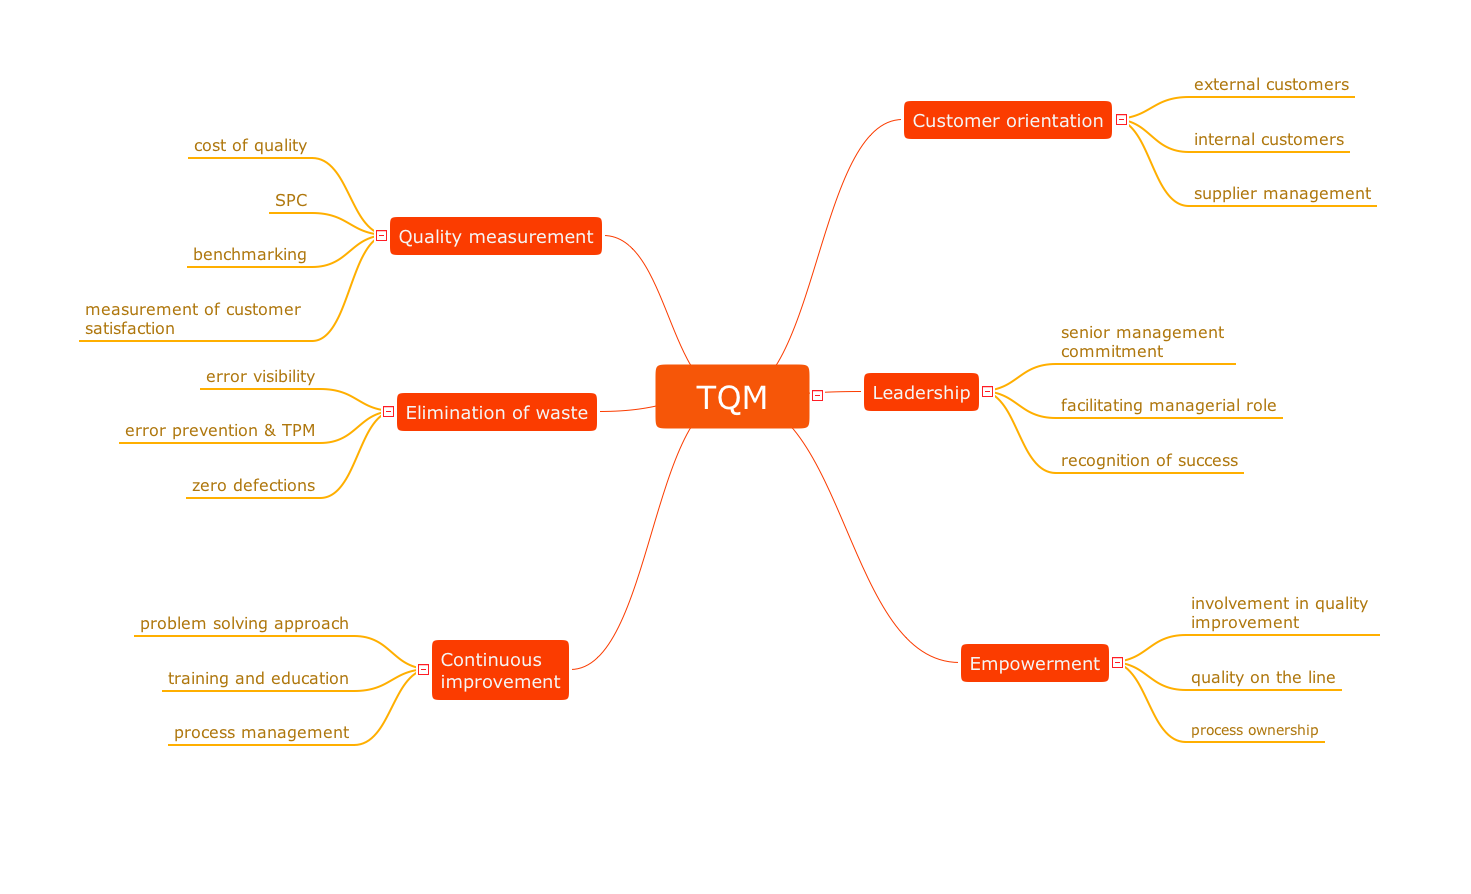
Picture: Why do you need the quality management for the organization
Related Solution:
Use the advantages of hierarchical tree structure of mind map while developing the organizational structure of your organization. Create an Organizational Chart from your map. Double click the icon to create an Organizational Chart.
The diagram is created automatically from the active page of your map by ConceptDraw DIAGRAM and will be opened in Slideshow mode.
Picture: Organizational Chart
Related Solution:
No one can imagine a geography class without such educational stuff as a geo map or a globe. As for one of the biggest countries in North America, the United States of America Map is present in every American school or college. It’s easier to remember all the states if you look on the map more often.
The following sample represents the map of USA. This precise map has names of all states of America. The different colors which are used to indicate each state add the visuality and brightness to the whole map. The ConceptDraw USA Maps solution - one of a family of ConceptDraw Maps solutions. Any country invokes a big piece of data: geographical, political, statistical, etc. A simple way of representing this data is to design maps that will show a certain item in relation to a particular area of Earth.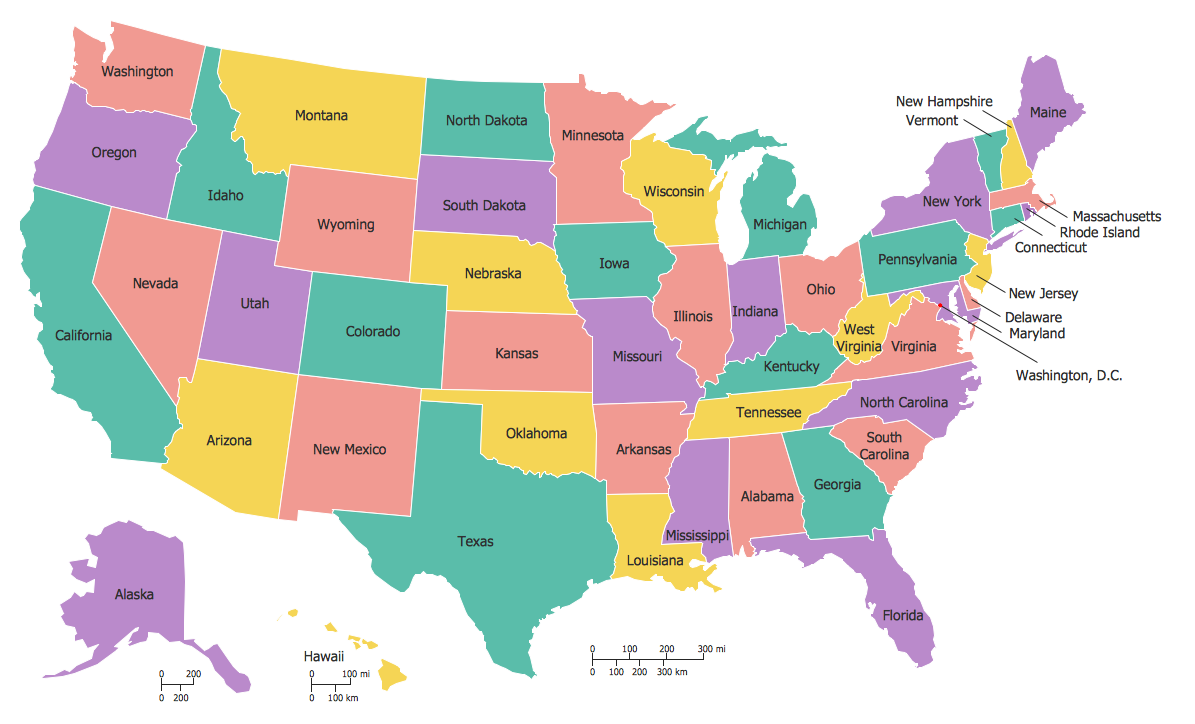
Picture:
How to Draw the US Map?
ConceptDraw Diagram Software for Easy USA Map Drawing
Related Solution:
