
Pic 1. Sales Growth. Bar Graphs Example
This diagram was redrawn from commons.wikimedia.org.
Using the ready-to-use predesigned objects from the Bar Graphs Solution for ConceptDraw DIAGRAM you can create your own professional looking Bar Charts quick and easy.
The Bar Charts produced with ConceptDraw DIAGRAM are vector graphic documents and are available for reviewing, modifying, and converting to a variety of formats (image, HTML, PDF file, MS PowerPoint Presentation, Adobe Flash or MS Visio).
Free Download Bar Chart Software and View All Templates and Examples
See Also:
TEN RELATED HOW TO's:
The Nature Solution addition to ConceptDraw Solution Park for ConceptDraw DIAGRAM includes new libraries that provide a wide range nature objects and it can be used in many areas.
Picture: Drawing Illustration
Flowcharts can be used in designing and documenting both simple and complex processes or programs and, similar to the other types of diagrams, they can help visualize what happens and so help understand some definite process, and, as a result, find flaws, bottlenecks and other features within it.
Picture: Flowchart Programming Project. Flowchart Examples
Related Solution:
PERT Chart Software - Activity Network and Project Evaluation and Review Technique, or PERT, charts are a way of documenting and analyzing the tasks in a project.
ConceptDraw DIAGRAM is a powerful diagramming and vector drawing software for designing professional looking PERT Charts quick and easy.
Picture: PERT Chart Software
Related Solution:
You need to draw the Circular Arrows Diagram, Segmented Diagram or Circular Flow Diagram? Any of these diagrams can be fast and easy designed in ConceptDraw DIAGRAM software, which offers the Business Diagrams Solution from the Management Area with extensive drawing tools, predesigned samples and circular flow diagram template. The use of ready template is the easiest way of drawing.
Picture: Circular Flow Diagram Template
Related Solution:
VSM symbols are the best for a production process designing. The entire Value Stream Mapping method uses a graphical representation of the manufacturing process, factors' pros and cons, that all stakeholders can easily understand. Value Stream Mapping is a graphical technique that provides possibilities to improve analysis of a manufacturing process, at the stage of the transferring information or materials that required to deliver a product or service to the customer.
Picture: Value Stream Mapping Symbols
Related Solution:
This sample was created in ConceptDraw DIAGRAM diagramming and vector drawing software using the UML Activity Diagram library of the Rapid UML Solution from the Software Development area of ConceptDraw Solution Park.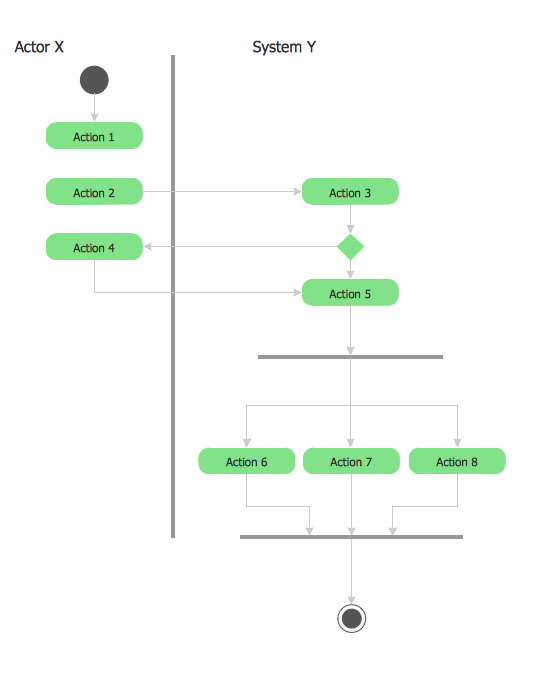
Picture: UML 2 4 Process Flow Diagram
Related Solution:
Create flowcharts, flow charts, and more with ConceptDraw flowchart software.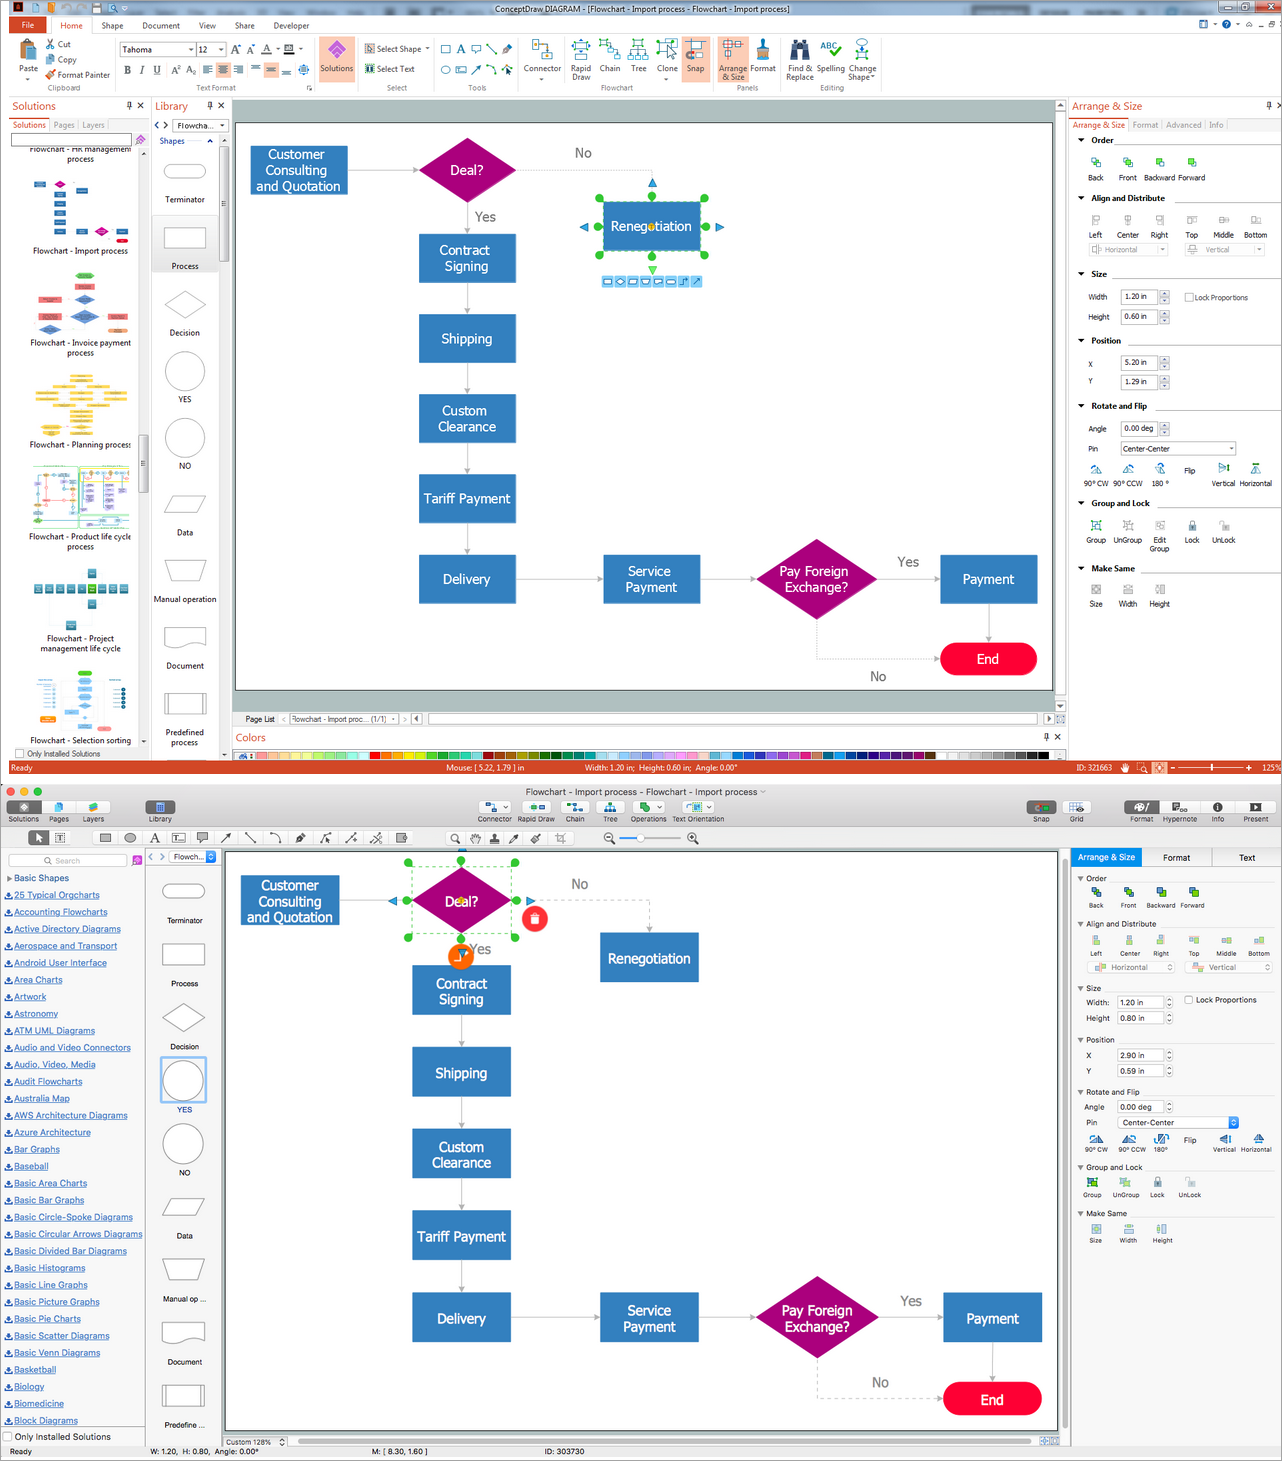
Picture: Basic Diagramming. Flowchart Software
Related Solution:
Many professionals have to solve problems every day. Designing of the process algorithm contribute to understand where the problem is in the process. A Flowchart is a graphical tool that most usable for breaking down processes.
Definition of flowchart - a diagram that shows step-by-step progression through a procedure or system especially using connecting lines and a set of conventional symbols.
All the icons, symbols and connectors needed for creating standardized notation flowcharts are contained within Software Flow Chart.
Picture: Software Flow Chart
Related Solution:
Creating of computer network diagrams is a complex process which requires a lot of time and efforts. ConceptDraw DIAGRAM diagramming and vector drawing software was extended with Computer Network Diagrams Solution from the Computer and Networks Area to make your design process easier. One of the most helpful tools of this solution is Network Diagram Template.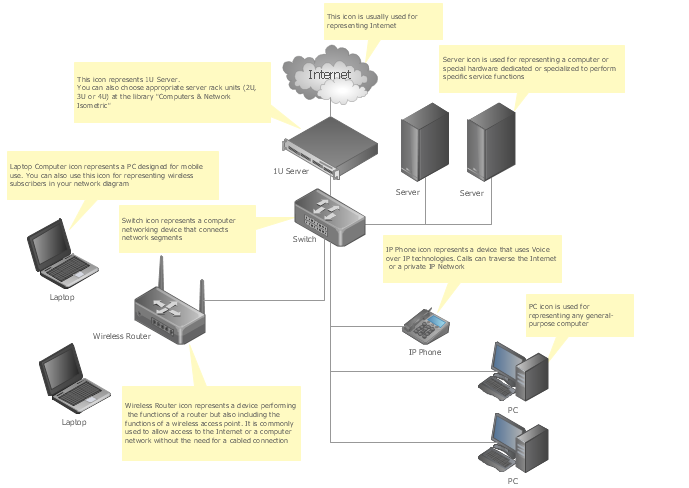
Picture: Network Diagram Template
Related Solution:
Onion diagram is a type of circular diagram that consists of the core circle representing the product/solution and concentric circles around it, which dependent on the core and look like the cross sections of onion.
ConceptDraw DIAGRAM diagramming and vector drawing software supplied with Stakeholder Onion Diagrams Solution from the Management Area of ConceptDraw Solution Park is an ideal software for effective Onion diagram process design.
Picture: Onion Diagram Process Design
Related Solution: