
Example 3. Column chart example — Number of Members in the CNT between 1911 and 1937
The Amino Acid Composition of Complete UniProt Database is another example, offered by the professionals of CS Odessa, which can always be used as a base for the good-looking drawings of ConceptDraw DIAGRAM users. After installing the software and downloading the ConceptDraw STORE application from this site you can make it possible to get the Bar Graphs solution in order to make the column chart examples. Having the mentioned one means having the professionally created coloured graph with lots of pieces of data mentioned in a way of bars with the numbers all represented on the top of each of them.
The forth example is the one called “EPIET” Fellows by Country of Origin, where the European Programme for Invention Epidemiology Training fellowship is represented conducting the training in the European Union countries, giving the practical experience in invention epidemiology for the nurses, microbiologists, medical practitioners and other health specialists. The mentioned horizontal bar chart is a good option to base your own bar or column graph on, taking into consideration the fact that it was made by those who know lots about how to make such kinds of drawings in a proper way, professionally. Thus, there’s a list of countries, such as France, Germany, Spain, Portugal, Finland, Italy, the United Kingdom, Greece, Sweden, Denmark, Japan, Malta, Latvia, Lithuania, Ireland, Luxembourg, South Africa and other mentioned which all can be replaced with your own data, such as other countries of other pieces of information.
Another example, available for all the ConceptDraw DIAGRAM users to change in order to edit it for making their own drawings, is called as a “Percentage of U.S. high school Students”, showing the percentage of U.S. high school students who attended physical education class one or more days during an average school week with the percents illustrated on top of each bar and the bars themselves are those representing the years – 1991, 1993, 1995, 1997, 1999 and 2001. In the same way it is always possible to make another column chart showing the percentage of the pupils attending their classes during some period of time, such as a year, illustrating each of the months with a separate bar.
Besides of the mentioned samples, you can always find more templates, such as those called “Bar Chart – Average Trip Length”, “3D Vertical Bar Graph — Iran Internet Users per 100 person”, “Bar Chart — Nitrate Concentration in Community Water Systems”, “Percentage with Various Levels of Family Income”, “Serious Crime in Cincinnati”, etc.
Moreover, there are other articles about the bar and column charts you can find on this site.
TEN RELATED HOW TO's:
The ConceptDraw Home Design Software extended with Floor Plans solution from the Building Plans area of ConceptDraw Solution Park offers the powerful tools which will help you in easy developing vivid and professional-looking: Building plans, Home plans, House designs, Floor plans, Home interior designs, Furniture and equipment layouts.
Picture: Home Design Software
Related Solution:
Home remodeling is something that many people face at one point or the other. The first part of any home remodeling is to create a new home plan. At first, it may seem a daunting and costly endeavor, but to take it on yourself, you just need to choose the right home remodeling software. Digital drawing software, such as ConceptDraw DIAGRAM , includes home plan examples to help you get started, as well as multiple advanced and powerful options, and an intuitive interface to go with them.
People who want to make changes in their houses planning have previously prepare a plan of rebuilding, of house, apartment or any other construction. If somebody desires to change anything in the interior design he also requires a plan, as it’s handy to see on the plan the coming result and then begin to implement it. All these tasks will be solved better with ConceptDraw DIAGRAM and its solution for Building Plans. You will design professional looking Home Plans quick and easy using the vector libraries, templates and samples, supplied with Solution.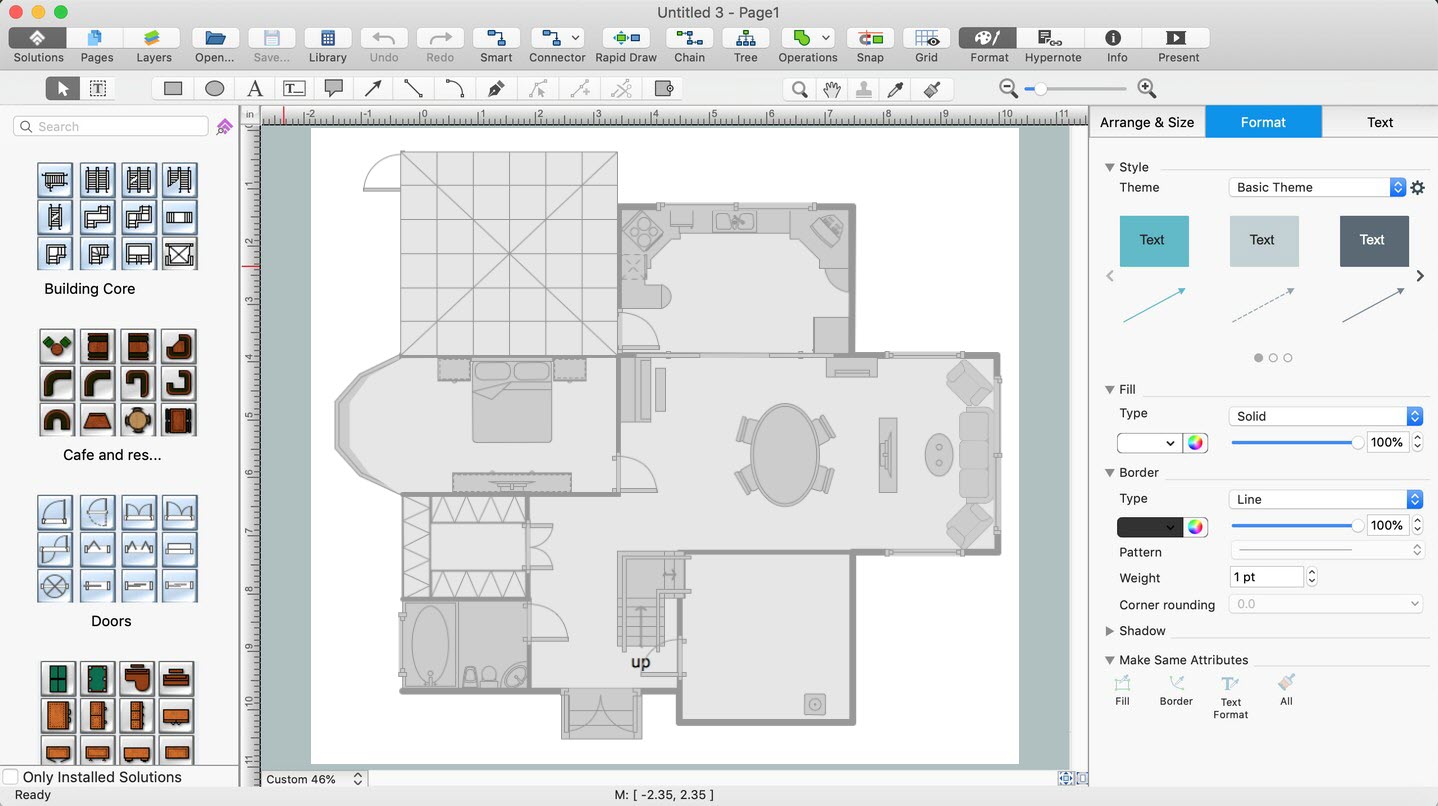
Picture: Home Remodeling Software. Home Plan Examples
Related Solution:
When trying to figure out the nature of the problems occurring within a project, there are many ways to develop such understanding. One of the most common ways to document processes for further improvement is to draw a process flowchart, which depicts the activities of the process arranged in sequential order — this is business process management. ConceptDraw DIAGRAM is business process mapping software with impressive range of productivity features for business process management and classic project management. This business process management software is helpful for many purposes from different payment processes, or manufacturing processes to chemical processes. Business process mapping flowcharts helps clarify the actual workflow of different people engaged in the same process. This samples were made with ConceptDraw DIAGRAM — business process mapping software for flowcharting and used as classic visio alternative because its briefly named "visio for mac" and for windows, this sort of software named the business process management tools.
This flowchart diagram shows a process flow of project management. The diagram that is presented here depicts the project life cycle that is basic for the most of project management methods. Breaking a project into phases allows to track it in the proper manner. Through separation on phases, the total workflow of a project is divided into some foreseeable components, thus making it easier to follow the project status. A project life cycle commonly includes: initiation, definition, design, development and implementation phases. Distinguished method to show parallel and interdependent processes, as well as project life cycle relationships. A flowchart diagram is often used as visual guide to project. For instance, it used by marketing project management software for visualizing stages of marketing activities or as project management workflow tools. Created with ConceptDraw DIAGRAM — business process mapping software which is flowcharting visio alternative or shortly its visio for mac, this sort of software platform often named the business process management tools.
Picture: Process Flowchart: A Step-by-Step Comprehensive Guide
Related Solution:
Describing a workflow or approval process can take hours and be too complicated, especially since there are options to do it quickly and vividly. Diagrams called flowcharts replace long paragraphs of boring text and represent information in a graphic way. You can draw one on paper or you can use flowchart software to do it quickly and scalable. This kind of software is easy to use and you don’t need any special skills to start using it. In addition, there are a lot examples and predesigned templates on the Internet.
Flowcharts are a best tool for staking out a huge and complex process into some small readable parts. Surely, flowcharts can be drawn manually but the use of standard symbols that make it clear for a wide audience makes a software tool preferred for this task. The core for a successful flowchart is its simplicity. That is why often before beginning making flowchart through software, people draw the sketch on a piece of paper. Designing an effective flowchart means the combination of the data needed to be shown and the simplicity with which you depict it.
Picture: Flowchart Software: A Comprehensive Guide
Related Solution:
There are numerous articles about the advantages of flowcharting, creating business graphics and developing different charts. Nevertheless, these articles are almost useless without the main component - the examples of flowcharts, org charts and without a fine example, it is difficult to get all the conveniences of creating diagrams. You can find tons of templates and vivid examples on Solution Park.
This illustration shows a variety of business diagrams that can be created using ConceptDraw DIAGRAM. It comprises a different fields of business activities: management, marketing, networking, software and database development along with design of infographics and business illustrations. ConceptDraw DIAGRAM provides a huge set of sample drawings including business process modeling diagrams,, network diagrams, UML diagrams, orgcharts, DFD, flowcharts, ERD, geographical maps and more.
Picture: Examples of Flowcharts, Org Charts and More
Related Solution:
The Pie Chart visualizes the data as the proportional parts of a whole and looks like a disk divided into sectors. The pie chart is type of graph, pie chart looks as circle devided into sectors. Pie Charts are widely used in the business, statistics, analytics, mass media. It’s very effective way of displaying relative sizes of parts, the proportion of the whole thing.
Picture: Pie Chart Word Template. Pie Chart Examples
Related Solution:
This sample shows the Flowchart that displays the layout and work flow of the cloud marketing platform. This diagram has a style of the marketing brochure. This style displays the central product that is related to the other issues.
Using the ready-to-use predesigned objects, samples and templates from the Flowcharts Solution for ConceptDraw DIAGRAM you can create your own professional looking Flowchart Diagrams quick and easy.
Picture: Flowchart Marketing Process. Flowchart Examples
Related Solution:
Gant Chart is a graphical representation of tasks as segments on a time scale. It helps plan and monitor project development or resource allocation. The horizontal axis is a time scale, expressed either in absolute or relative time.
Picture: Gant Chart in Project Management
Related Solution:
The ConceptDraw Flowchart component includes a set of samples and templates. This geathered as flowchart maker toolbox which focused on drawing flowcharts of any industry standards.
Picture: Flowchart Components
Related Solution:
A lot of business process techniques are able to be applied in regular life. Although this tool is considered to be used for business purposes, you can make a SWOT template for yourself. In fact, any obstacle might become a subject for SWOT analysis.
ConceptDraw solution for SWOT analysis solution provides a power visual maintenance of a SWOT analysis. It is a procedure of strategic planning made to discover the Strengths, Weaknesses, Opportunities, and Threats business meet. This mind map template for ConceptDraw MINDMAP isually maintains investigation of good and bad factors. For example, factors that provides an advantage over others are strength; factors that brings a disadvantage are factors of weakness. After the analysis is finished, transfer your data to create a SWOT matrix in ConceptDraw DIAGRAM.
Picture: SWOT Template
 Column Chart
 3D Column Chart
 Cylindrical Column Chart
