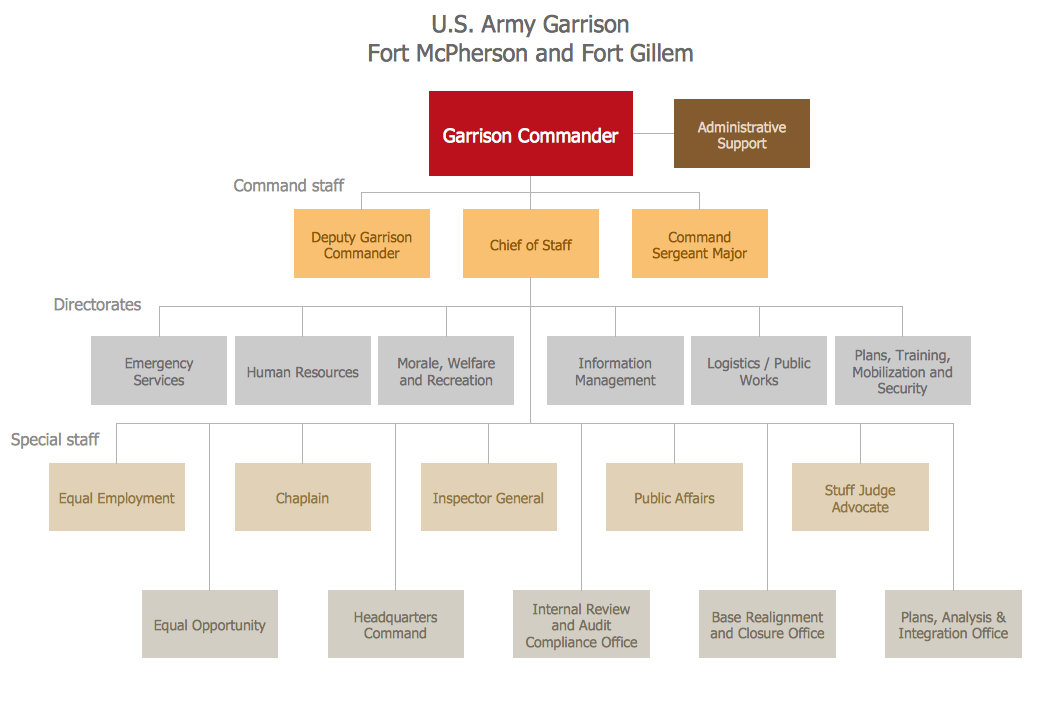
Example 1. Organization Chart - Fort McPherson
All tools of 25 Typical Orgcharts Solution listed above are so much useful for effective Organization Chart drawing and organization structure representing. What can be easier than simply fill a suitable template? All templates and samples are available from ConceptDraw STORE.
Look at two libraries included in 25 Typical Orgcharts Solution. They contain 40 predesigned vector graphics and icons which will help design any Organization Chart, Matrix Organization Chart, depict business structure in a few minutes.

Example 2. Flat Organization Chart
The samples you see on this page were created in ConceptDraw DIAGRAM using the paid add-on 25 Typical Orgcharts Solution for ConceptDraw DIAGRAM Solution Park. An experienced user spent 5-10 minutes creating every of these samples.
Use the 25 Typical Orgcharts Solution for ConceptDraw DIAGRAM software to create your own professional looking Organization Chart of any complexity quick, easy and effective, and then successfully use it in your work activity.
All source documents are vector graphic documents. They are available for reviewing, modifying, or converting to a variety of formats (PDF file, MS PowerPoint, MS Visio, and many other graphic formats) from the ConceptDraw STORE. The 25 Typical Orgcharts Solution is available for all ConceptDraw DIAGRAM users.
NINE RELATED HOW TO's:
ConceptDraw provides some interactive xy chart and scatter graph symbols that offers advanced features yet is simple to use.
Picture: Scatter Graph Charting Software
Related Solution:
Constant improvement of key performance indicators that are related to quality is a step in the right direction for a company interested in market growth.
Picture: Quality Improvement
Related Solution:
If you need to pull together a quick marketing drawing, you'll find elements, samples, templates and libraries with vector clip art for drawing the Marketing Illustrations.
These symbols and signs you can use in your design for Strategic Marketing, Graphic Design, Inbound and Content Marketing, Social Media, Lead Generation, Email Marketing and Automation, CRM implementation and Integration and more.
Picture: Marketing - Design Elements
Related Solution:
When thinking about the process of decision making, it's easy to imagine it as a pyramid. We will look at a three level pyramid model as an example. Operational decisions are first that come to mind, and it's the first level. Tactical and strategic decisions are the second and the third levels.
Pyramid (triangle) diagrams are used to show some hierarchical data. Because to the pyramid form of diagram, each diagram slice has a different width. The width of each segment depends on its hierarchical level.
The current image illustrates the model of information system types. Most graphically the model can be represented as a three level pyramid. The first level shows a system of transaction processing It is concentrated on operational tasks. The second level is devoted to tactical solutions of the information system management. And at least, the third level addresses strategy and represents the executive information system. This three level pyramid sample is supplied with the ConceptDraw Pyramid Diagrams solution from Marketing area of ConceptDraw Solution Park.
Picture: Pyramid Diagram
Related Solutions:
Quality Control Chart Software (ISO Flowcharting) - ConceptDraw DIAGRAM extended with Total Quality Management TQM Diagrams Solution from the Quality Management Area is the best diagramming and vector drawing software that allows you to draw the quality control charts quick and easy.
The quality control chart is a graphic that illustrates the accordance of processes or products to the intended specifications and degree of differences from them. Depending on what type of data you need analyze, there are used different types of quality control charts: X-bar charts, S charts, Np charts.
Picture: Quality Control Chart Software — ISO Flowcharting
Related Solution:
This sample was created in ConceptDraw DIAGRAM diagramming and vector drawing software using the UML Class Diagram library of the Rapid UML Solution from the Software Development area of ConceptDraw Solution Park.
This sample shows the transport protocol mappings for SNMP (Simple Network Management Protocol), the classes of the transport system and relationships between them and is used in IP network.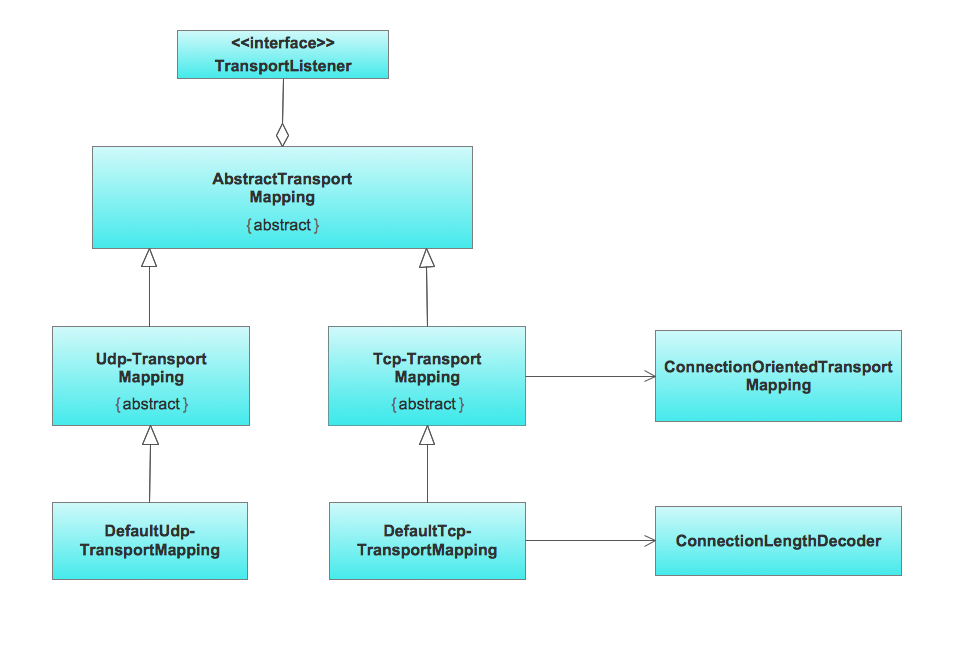
Picture: UML Class Diagram Example for Transport System
Related Solution:
When developing the Classroom Seating Chart it is necessary to take into account the characteristics of the taken premises. Each seating place must to be comfortable and each pupil must to see good the teacher and the chalkboard. Let's design the Classroom Seating Chart in ConceptDraw DIAGRAM software extended with School and Training Plans Solution from the Building Plans Area.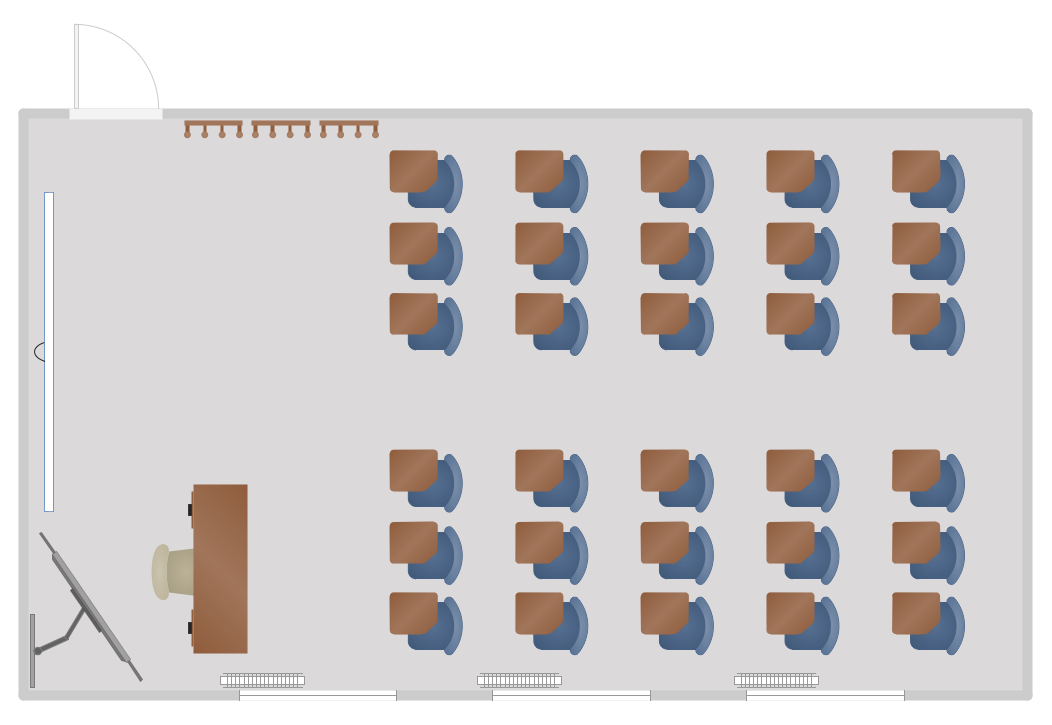
Picture: Classroom Seating Chart
Related Solution:
ConceptDraw DIAGRAM can help you make professional diagrams quickly.
Picture: Best Software to Draw Diagrams
Related Solution:
ConceptDraw DIAGRAM is a powerful tool that helps you create a Cross Functional Flow Chart quickly and easily. Fine-tuning the objects in ConceptDraw DIAGRAM allows you to create a really professional finished article. ConceptDraw Arrows10 Technology gives drawing connectors a smart behavior that provides quick and precise placement, allows for easy changes and automatic rearrangement.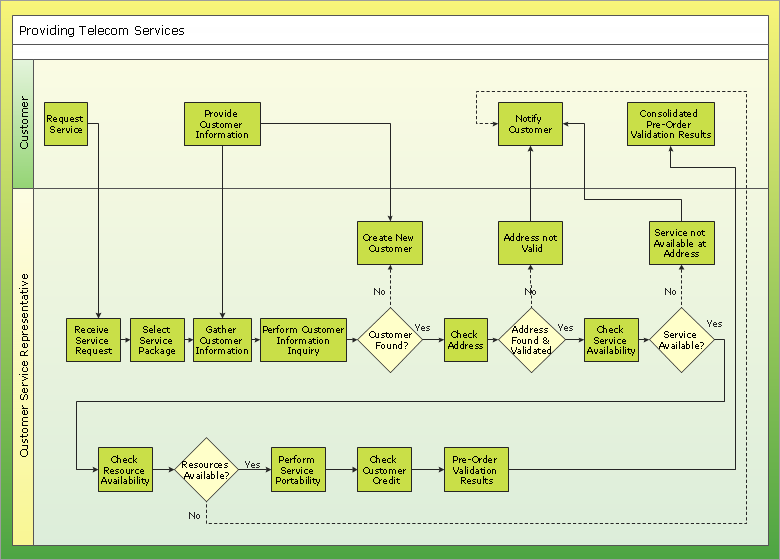
Picture: Double-headed Cross Functional Flowchart
Related Solution:

 Library")
