Mind maps can be used to depict a quality process. With a mind map one can easily describe a quality process using a tree structure as well as show process relations, use visual symbols to improve understanding, and produce presentations. You can use mind maps for a complete quality process analysis, giving more visibility to the focal points that you need to get clear.
TEN RELATED HOW TO's:
Workflow Diagram - workflow process diagram is a visual representation of a organizational process flow. Often it used as the same visual notation as process flow diagram. Visualising business processes using workflow diagram (workflow process diagram) allows estimate business process efficiency, analyse and optimize the process itself. Workflow diagram helps get focusing on each step and relations between workflow steps. ConceptDraw DIAGRAM is software for making workflow diagram. It contains specific designed graphics to draw workflow diagrams effectively. This is workflow diagram maker which do your work process effective.
Picture: Work Flow Process Chart
Related Solution:
The Event-driven Process Chain ( EPC ) Diagrams allows users present business process models in terms of work flows. The EPC diagram can show various ways for improvement throughout an organisation.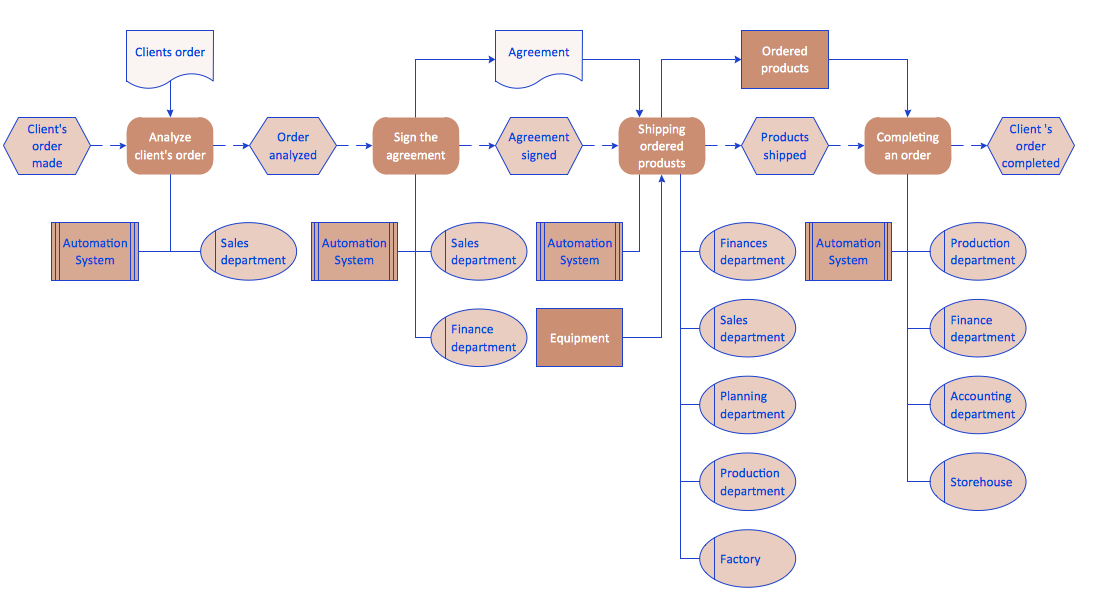
Picture: EPC Diagrams Illustrate Business Process Work Flows
Related Solution:
Total quality management is the one known to be consisting of some organization-wide efforts put in order to install and to make some climate in which this organization can continuously improve its ability to deliver the high-quality products and services to its customers permanently.
Picture: Total Quality Management Definition
Related Solution:
ConceptDraw DIAGRAM is a powerful tool for drawing business communication ideas and concepts, simple visual presentation of numerical data in the Mac environment.
Picture: Best Multi-Platform Diagram Software
Related Solution:
When you prepare professional-looking presentation, you need to use ConceptDraw MINDMAP software for the amazing result.
Picture: Create Captivating Presentations Easily
Related Solution:
An advanced tool for creating presentations, if you decide to represent data without spending hours on that.
Picture: Best Software for Making Presentations
Related Solution:
It is so simple making the drawing process easier and faster. you just need to choose the right drawing software.
ConceptDraw Arrows10 Technology - This is so easy and fast to draw any type of diagram with any degree of complexity.
Picture: Simple & Fast Diagram Software
Related Solutions:
In case you need to make a plan for your own future hotel or to do it for someone else, then you can always find the way to make such template very quickly and to have a very good looking result in the end. Whichever type of the hotels you want to illustrate in a way of a floor plan, you can always do it with ConceptDraw DIAGRAM drawing application.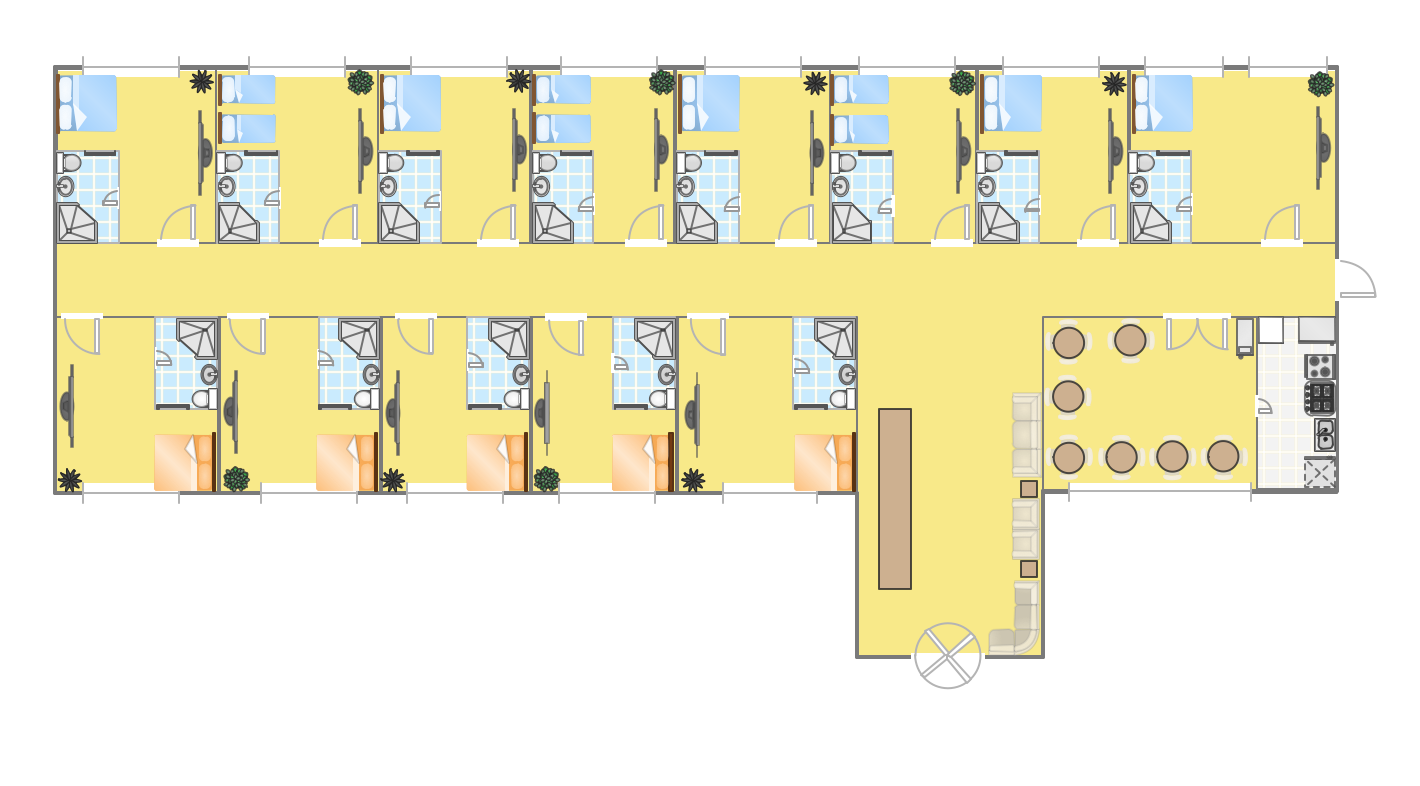
Picture: Hotel Plan. Hotel Plan Examples
Related Solution:
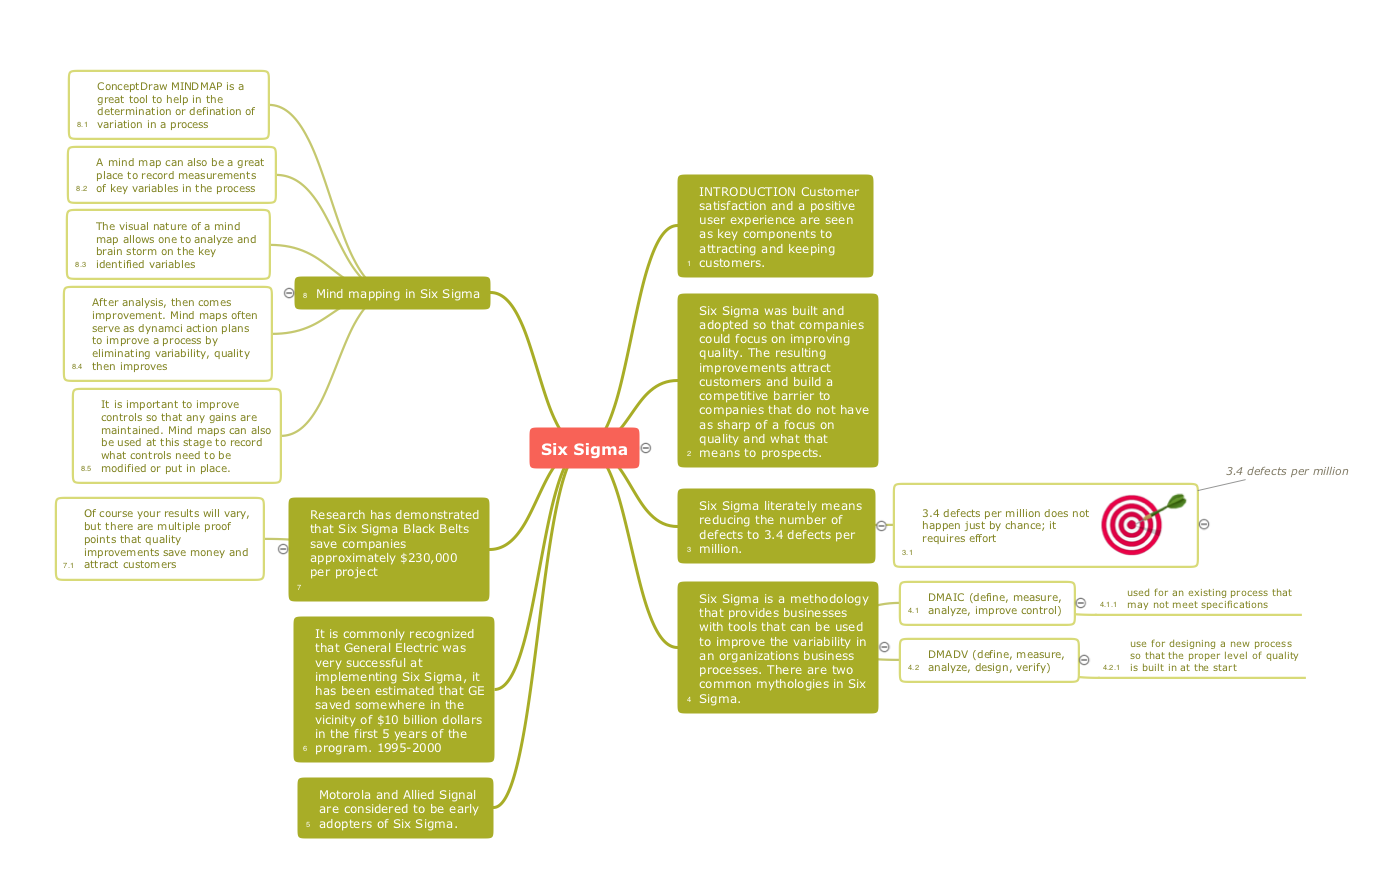
ConceptDraw MINDMAP with Quality mindmaps solution as a demonstration of the creative approach to quality management in daily work of quality management team.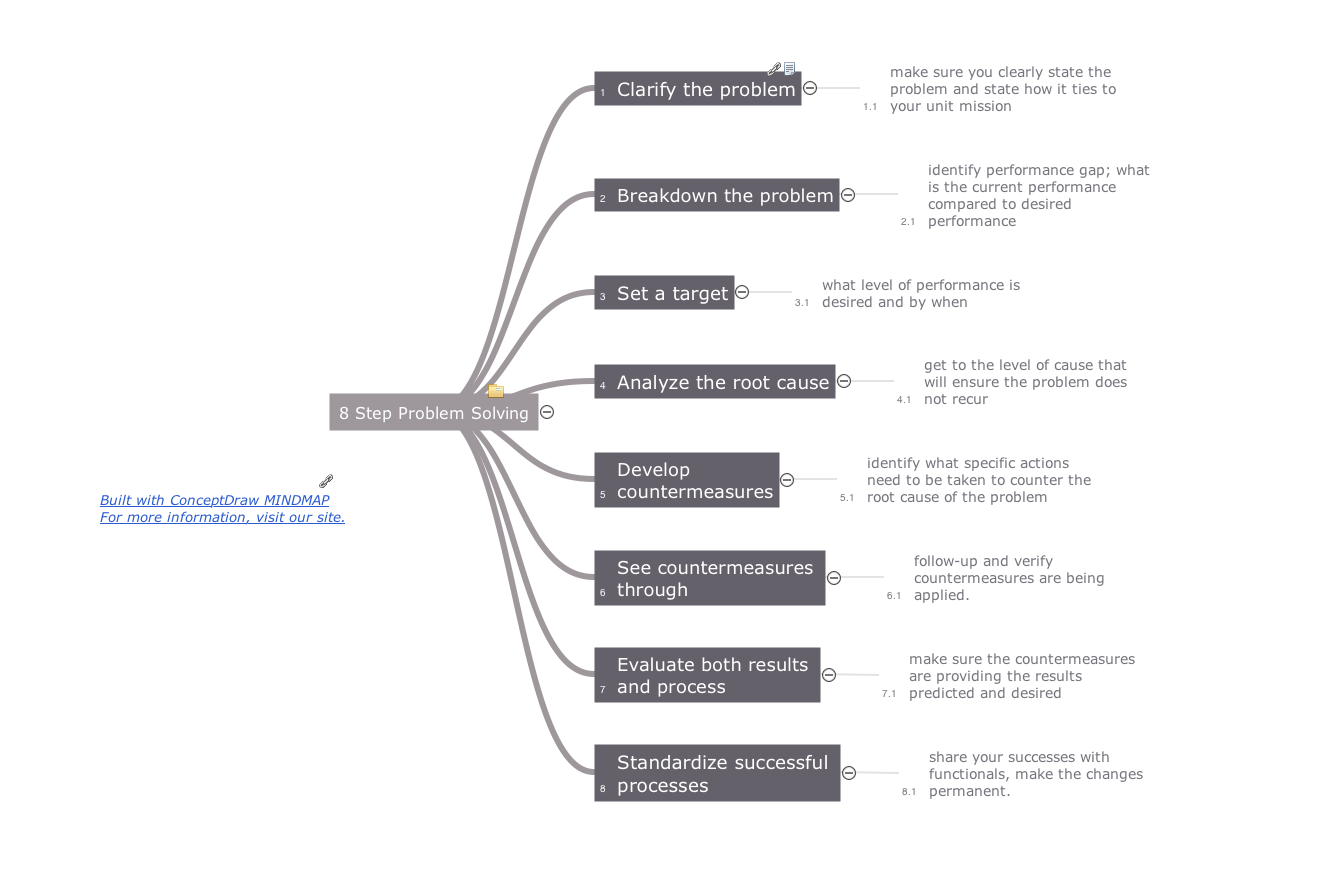
Picture: Quality Management Teams
Related Solution:
ConceptDraw MINDMAP has a addition to the ConceptDraw Solution Park that provides a creative approach to visualizing quality processes, Quality Mind Map Solution.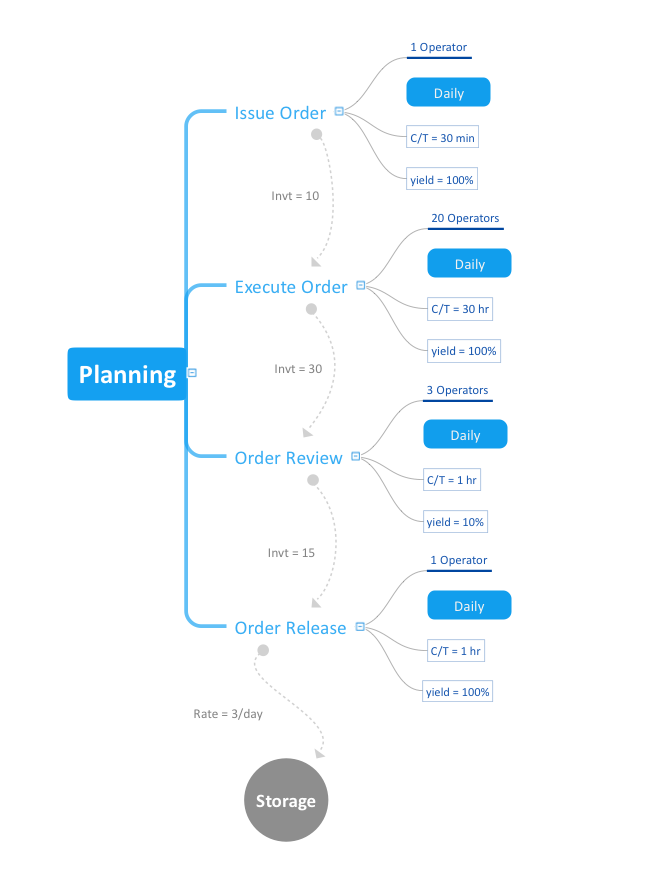
Picture: Mind Mapping in the Quality Management
Related Solution: