How to Use Skype for Sharing Documents
Share Files Through Skype
ConceptDraw MINDMAP is the tool for sharing various types of documents through Skype. Use ConceptDraw MINDMAP abillity to import Microsoft® Word®, Microsoft PowerPoint® and Microsoft Project® files or any number of mind map formats. Create the presentation and share it with source mindmap file through Skype using Remote Presentation for Skype solution.
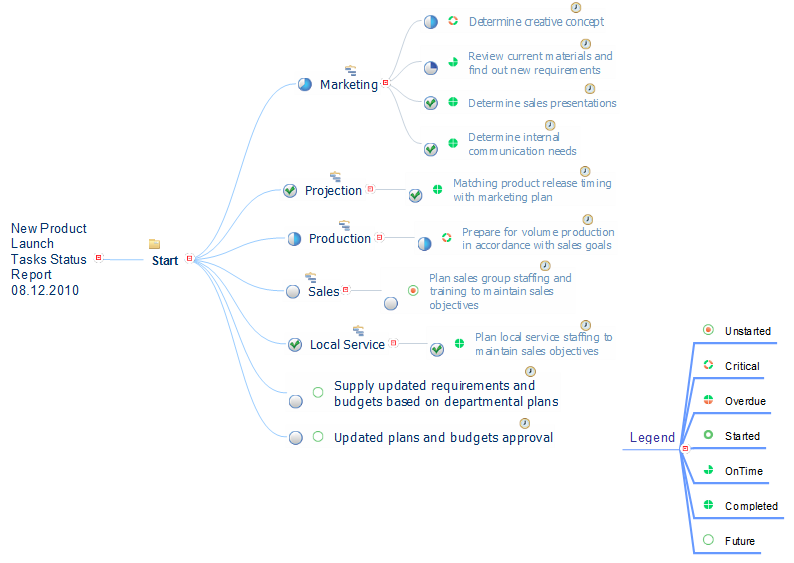
Sample 1. All Project Tasks Status Report
"All project tasks status report" mind map sample is created using ConceptDraw MINDMAP mind mapping software. This mind map example helps to learn how to share files online using mind map presentation via Skype.
Use this mindmap example for implementation of Remote Presentation for Skype solution from ConceptDraw Solution Park.
See also Samples:
TEN RELATED HOW TO's:
ConceptDraw Mind maps can be used to depict a quality process.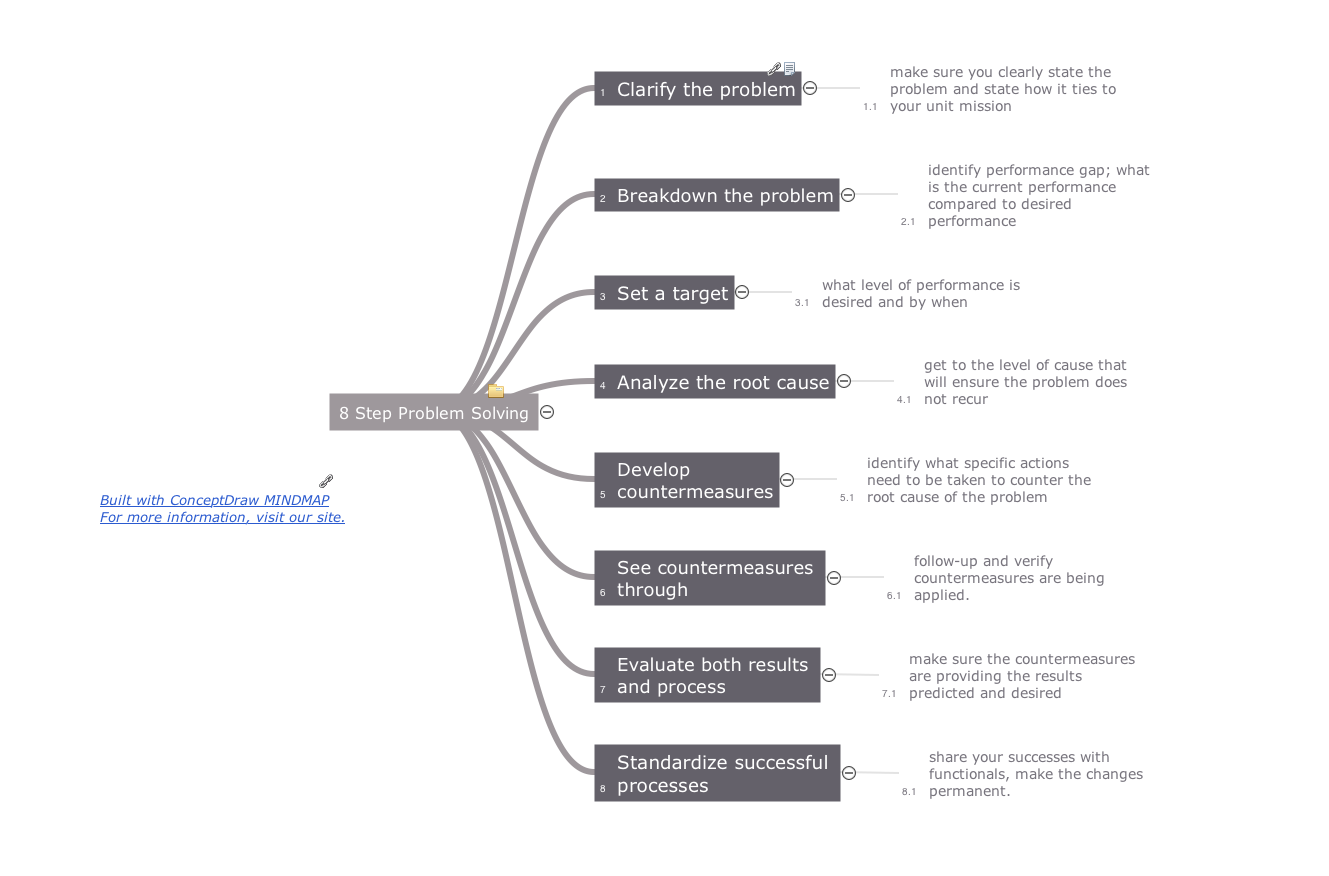
Picture: Helpful in all stages of quality management
Related Solution:
Create with our data flow diagram software perfect data flow diagrams. Download data flow diagram software for FREE. Use hundreds of data flow diagram examples.
Picture: Collaboration in a Project Team
Value stream maps (VSM) are an essential tool for organizations applying Lean methods.
Picture: What is Value Stream Mapping?
Related Solution:
When thinking about the process of decision making, it's easy to imagine it as a pyramid. We will look at a three level pyramid model as an example. Operational decisions are first that come to mind, and it's the first level. Tactical and strategic decisions are the second and the third levels.
Pyramid (triangle) diagrams are used to show some hierarchical data. Because to the pyramid form of diagram, each diagram slice has a different width. The width of each segment depends on its hierarchical level.
The current image illustrates the model of information system types. Most graphically the model can be represented as a three level pyramid. The first level shows a system of transaction processing It is concentrated on operational tasks. The second level is devoted to tactical solutions of the information system management. And at least, the third level addresses strategy and represents the executive information system. This three level pyramid sample is supplied with the ConceptDraw Pyramid Diagrams solution from Marketing area of ConceptDraw Solution Park.
Picture: Pyramid Diagram
Related Solutions:
ConceptDraw MindMap benefits comparing to Mindjet Mindmanager:
Economical. (Lower license price, support is no charge maintenance is an optional one-time fee that delivers to you the next major release) ConceptDraw products are structured to save you money from the date of purchase for the life of the product. When you compare ConceptDraw MINDMAP to Mindjet Mindmanager the cost savings will be obvious.
Flexible Licensing. ConceptDraw is licensed per-named-user. Want ConceptDraw on 2 PCs, 2 Macs, or a PC and a Mac? Straightforward licensing makes this easy.
Picture: Looking at ConceptDraw MINDMAP as a Replacement for Mindjet Mindmanager
Related Solutions:
To support you in your tasks you can use the power of ConceptDraw DIAGRAM providing
intelligent vector graphics that are useful for management diagramming and
ConceptDraw MINDMAP for key management mind maps.
Picture: Business Productivity - Management
Related Solution:
Presenting you with a drawing program which could really surprise you with their great functionality.
Don't know how to start to draw Connector's improvement?
Curious how should diagramming software work?
Drawing programs involve a lot of things like designs in an illustrative way, creating an cherts, Tools to create high end graphics, create dashboards, using your data and many other technical aspects do it in a much professional and in a quick way.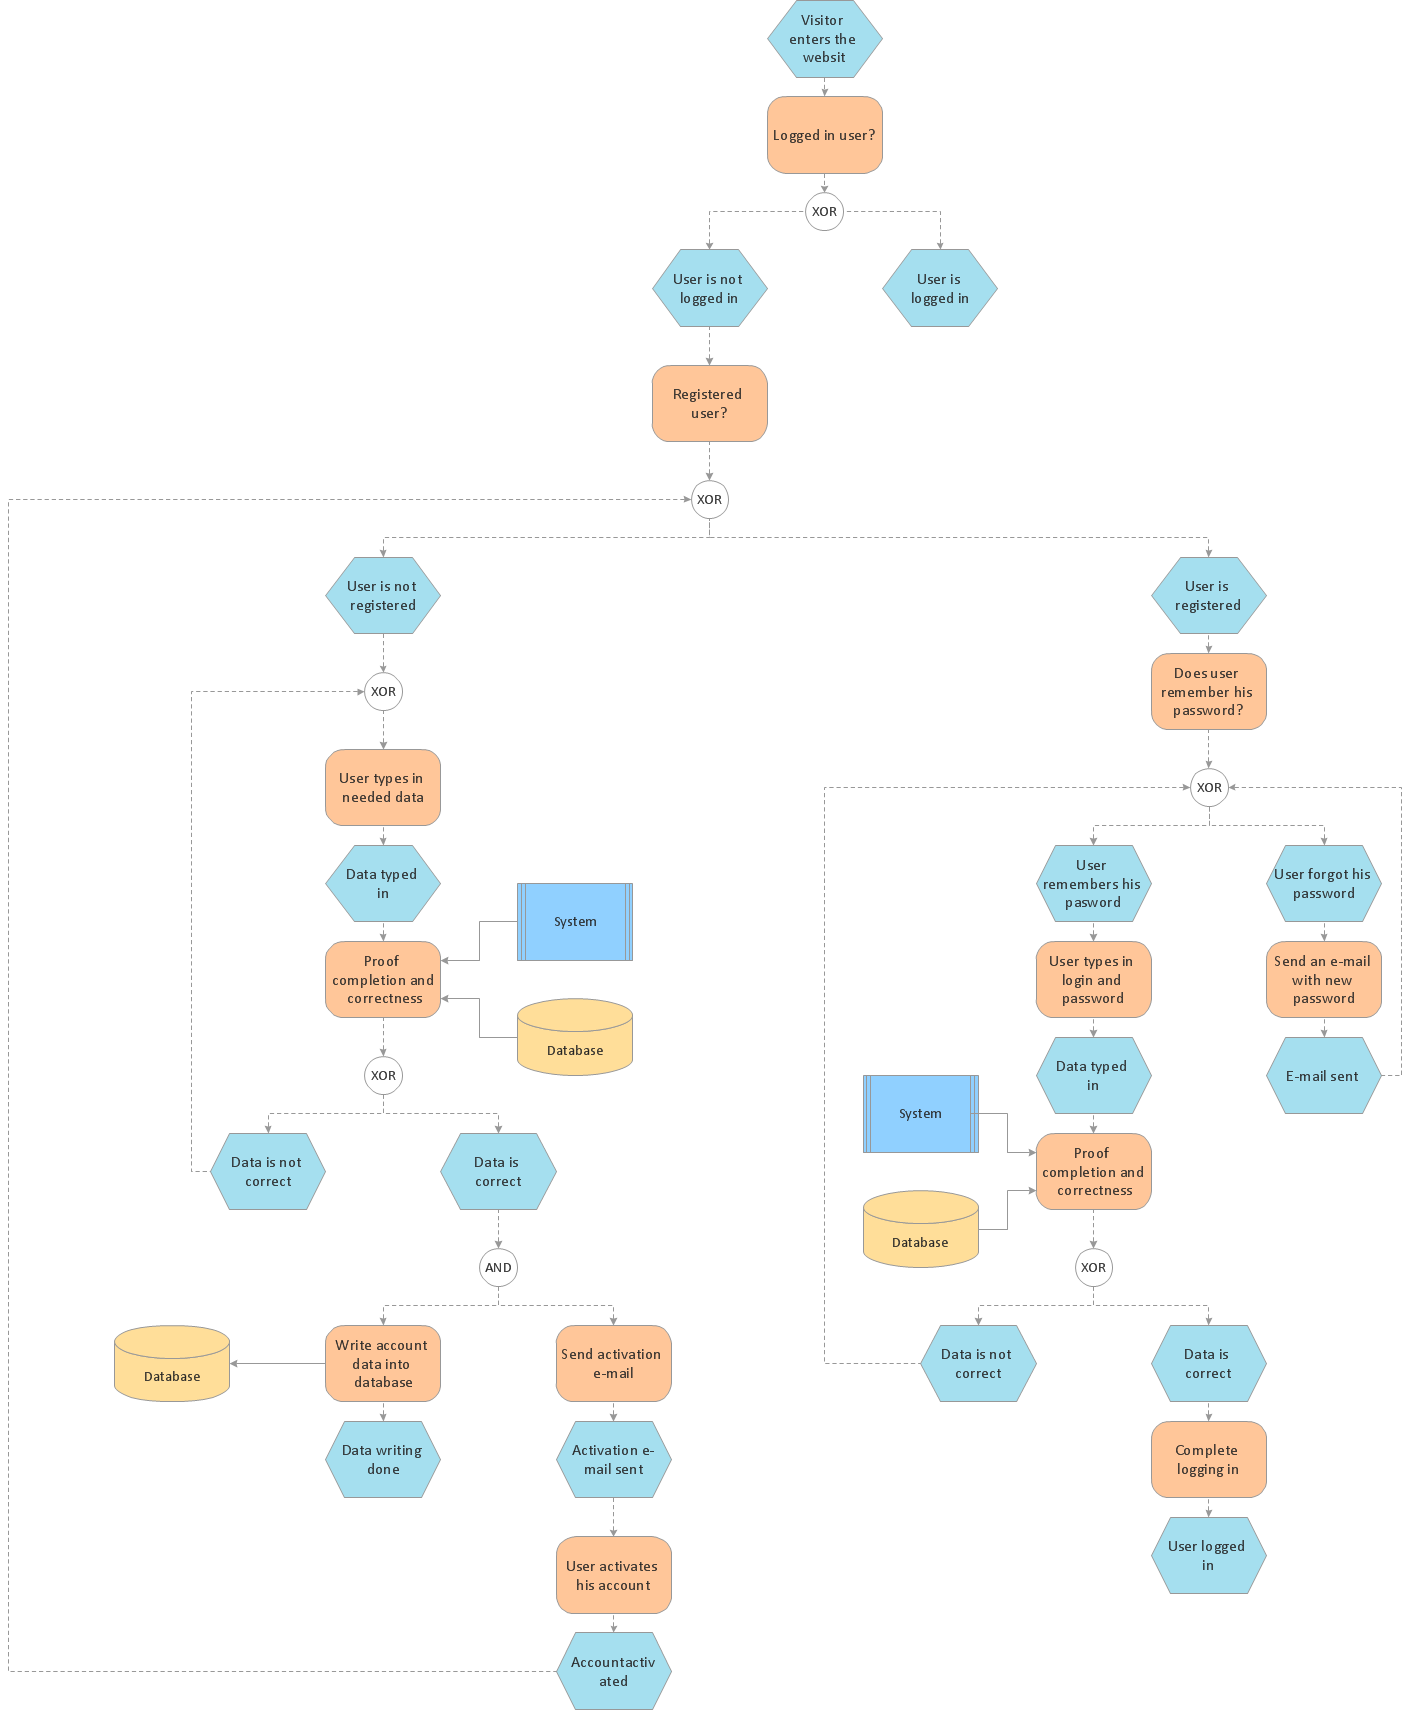
Picture: How to Help Customers be More Productive
Diagramming is an astonishing way to visualize business processes. The list of the most common business process flowchart symbols is quite long starting from basic flowcharts, continuing with SIPOC diagrams. Business process modeling was never easier than now, with special ConceptDraw Business Process Mapping solution.
To carry out all professional standard requirements for business processes mapping, it is necessarily to follow the special graphical notations. ConceptDraw Business Process Mapping solution offers an exhaustive suite of tools to aid business process mapping. There are three vector libraries SIPOC Diagrams, Business Process Flowcharts, and Swim Lanes that contains totally more than 50 symbols of standard BPM notations. This is all that professionals need to effectively evaluate and manage quality in business processes.
Picture: Business Process Flowchart Symbols
Related Solution:
Using ConceptDraw quality mind maps is a perfect addition to quality visualization in your company.
Picture: Quality visualization in your company
Related Solution:
ConceptDraw DIAGRAM is the best BPMN software for ✔️ modeling business processes, ✔️ graphical documenting processes, ✔️ analysis processes, ✔️ optimization business processes, ✔️ identifying inefficiencies, ✔️ efficient decision-making based on created Business Process Diagrams and Business Process Models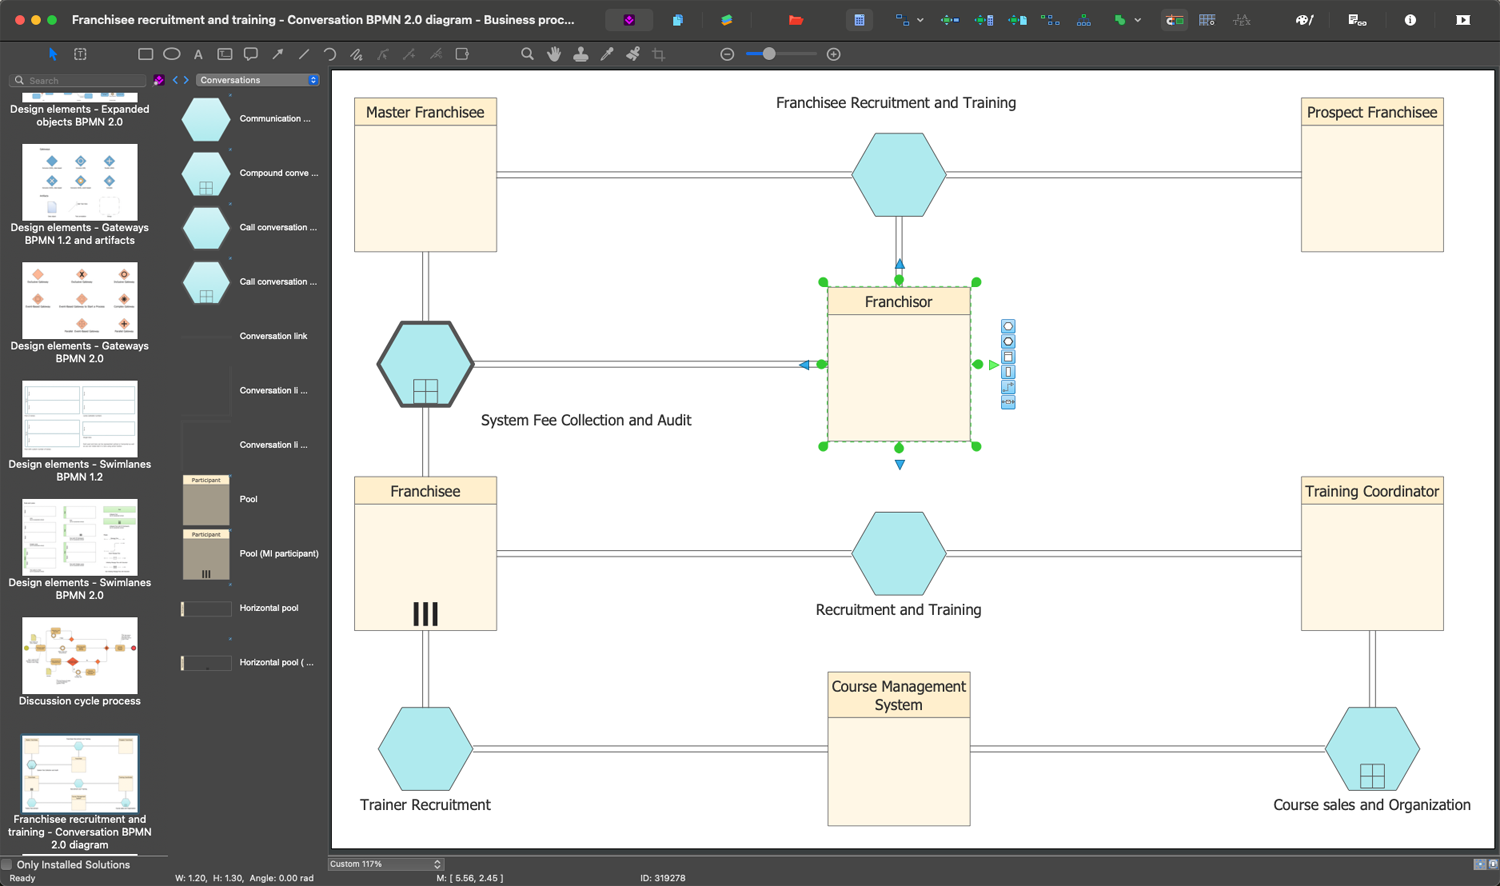
Picture: The Best Business Process Modeling Software: Comprehensive Guide
Related Solution:
ConceptDraw
MINDMAP 16