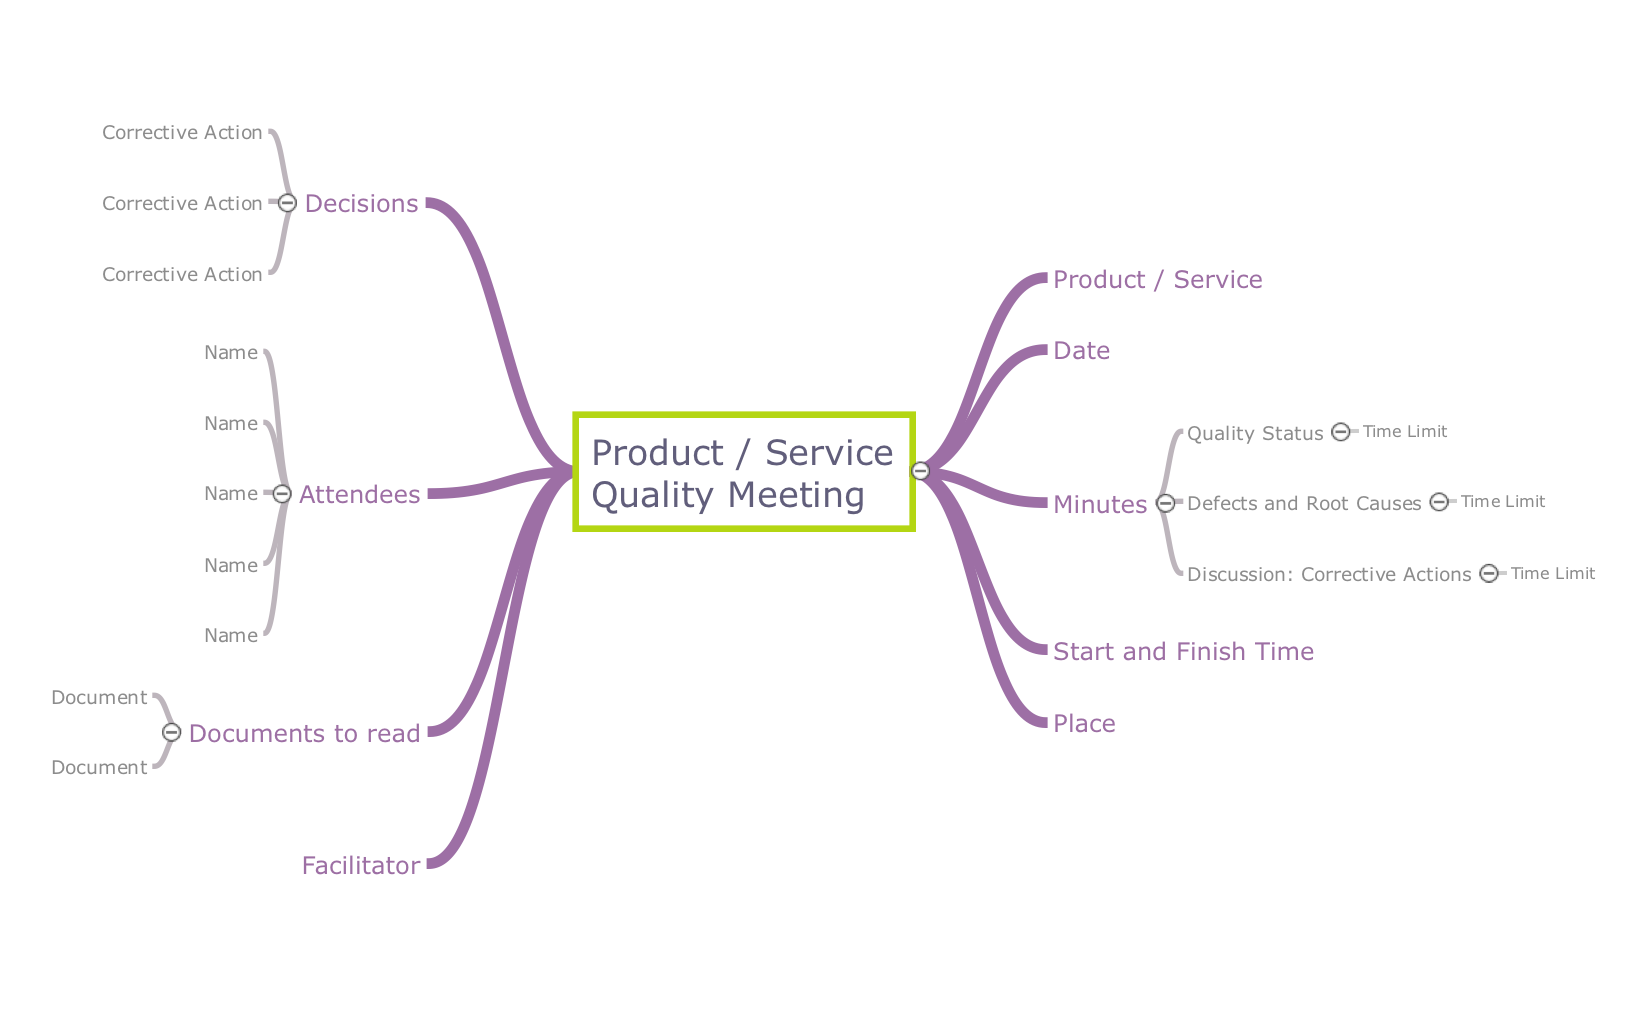
Pic.1 Mindmap template - Product or service quality meeting.
Mind maps are great for producing agendas used in quality meetings. You can print a copy for each participant, in order to keep everyone informed on core points and objectives. Viewing the mind map on a large screen during a meeting and making changes and putting notes helps to keep all participants on the same page. Final decisions, deals, and to-do lists can be added to this mind map so that the map content can be sent or printed for everyone, so that the whole team has a ready-to-work document.
See also Samples:
TEN RELATED HOW TO's:
Pyramid diagrams help you visualize information as a triangle divided into horizontal slices. Labelled slices represent a hierarchy. Pyramids are used in marketing presentations to show and analyze hierarchy levels.
3D triangular diagram of DIKW pyramid has 6 levels: measurement, facts, data, information, knowledge, wisdom.
The data component include different scattered signs or symbols which are merely useless until these random objective facts are somehow processed. Data is a resource which has to be manipulated or rearranged to get useful. Information can be extracted from a pile of data, it also can be mined from different data storages.
Picture: Pyramid Diagram
Related Solutions:
If you have no time, you can create a SWOT diagram even on asphalt using a chalk. Although, in case you want a proper scheme, you should use a special software for creating SWOT analysis diagrams that would be comprehensible. SWOT analysis is useful not only for business purposes, but even for cities or for a particular person.
The ConceptDraw SWOT and TOWS Matrix Diagrams solution is a tool for performing both SWOT and TOWS analysis. It provides templates of different sorts of Matrix Diagrams. Besides different embedded templates, the solution enabling create custom SWOT and TOWS matrices. Using the compatibility between the MINDMAP and DIAGRAM is the best way of making SWOT or TOWS diagrams quickly. The mind map templates help identify the core statements of SWOT and TOWS analysis: Strengths, Weaknesses, Opportunities, and Threats. The next step is matrix creation - both SWOT and TOWS analysis use the same basic steps and the only difference is the order in which these criteria are studied.
Picture: Software for Creating SWOT Analysis Diagrams
Related Solution:
ConceptDraw Word Exchange solution gives you the ability to export mind maps to MS Word. It also allows stylizing the resulting document by using a custom MS Word template.
Picture: Export from ConceptDraw MINDMAP into MS Word Document
A more detailed mind map of a business plan for a computer hardware reseller.
Picture: Computer Hardware - Reseller Business Plan
Related Solution:
Use ConceptDraw DIAGRAM software with Flowcharts Solution to create Process Flow Charts, Flow Chart Process Maps, and High-Level Process Flow Charts to illustrate ✔️ high-level processes in industrial, chemical, and process engineering, ✔️ major plant processes, ✔️ minor details
Picture: Process Flow Chart
Related Solution:
Working with information can be quite tedious, furthermore, some data can be quite difficult to perceive without any graphic representation. So, to facilitate your work, you can use business diagrams, such as simple flowcharts or Gantt charts for project management and orgcharts for clarifying your company structure. You can use a proper software, like ConceptDraw Pro, draw them on paper, or use whiteboards, but it is more convenient to use a digital tool.
This diagram shows a cross-functional flowchart that was made fore telecom service provider. A workflow of a common telecommunication service provider has a rather branched structure. Thus, it is useful to have a flow chart to visualize the sequences and interrelations of the work flow steps. Business process flowchart contains 17 processes and 4 decision points,that are distributed through 2 lines depicting the participants involved. Also there are connectors that show the data flow within processes. This flowchart displays a detailed model of the telecom service trading process, as well as all participants in the process and how they interact with each other.
Picture: Business diagrams & Org Charts with ConceptDraw DIAGRAM
My friend works as a marketologist. Once he asked me about Marketing and Sales Organization chart, as it was new for him. Luckily, ConceptDraw Solution Park has tons of examples to show to an unexperienced user.
This organizational chart was designed with ConceptDraw DIAGRAM and its Organizational Charts solution, that can be find in the Management section of Solution Park. This solution offers a vector objects library and a set of samples and templates. The vector library contains symbols and icons that provide you with possibility to show the organizational structure of your organization at a glance. It allows to depict the interrelations of authority and responsibility between positions in an organization. Organizational charts provide both employers and employees a clear view of the sale and marketing departments structure, reporting system, management levels.
Picture: Marketing and Sales Organization chart.Organization chart Example
Related Solution:
The Social Media Response solution creates interactive social media flow charts and action mind maps. The solution includes a video tutorial and a number of samples helping social media teams refine and organize their response process.
Picture: How to Connect Social Media DFD Flowchart with Action Maps
Related Solution:
Automatically create a presentation-quality diagram in one click with ConceptDraw DIAGRAM.
Picture: Visual Presentations Made Easy with Diagramming Software
Related Solution:
ConceptDraw gives the ability to draw simple diagrams like flowcharts, block diagrams, bar charts, histograms, pie charts, divided bar diagrams, line graphs, area charts, scatter plots, circular arrows diagrams, Venn diagrams, bubble diagrams, concept maps, and others.
Picture: Simple Drawing Applications for Mac
Related Solution: