
Example 1. Sales Process Flowcharts Solution
The most easier way of creating the visually engaging and informative Sales Process Flowcharts is to create the new ConceptDraw document and to use the predesigned vector shapes offered in 6 libraries of the Sales Flowcharts Solution:
- Sales Flowchart library contains 62 flow chart symbols.
- Sales Workflows library contains 39 workflow symbols.
- Sales Arrows library contains 57 arrows symbols.
- Sales Department library contains 49 department symbols.
- Sales Steps library contains 23 workflow step symbols.
- Sales Symbols library contains 55 sales process pictograms.

Example 2. Sales Process Flowcharts Symbols
These libraries are the real godsend, because now you don't need to be an artist for drawing professional looking and attractive Sales Process Flowcharts.

Example 3. Sales Process Flowcharts - E Filing General Workflow
Sales Flowcharts Solution offers also variety of predesigned Sales Process Flowcharts samples and examples which are well thought-out and professionally developed specially for ConceptDraw users.

Example 4. Sales Process Flowcharts - Invoice Lifecycle
The set of Sales Process Flowcharts you see on this page was created in ConceptDraw DIAGRAM using the tools of the Sales Flowcharts Solution for ConceptDraw DIAGRAM These samples successfully demonstrate solution's capabilities and professional results you can achieve. An experienced user spent 10-15 minutes creating each of them.
Use the Sales Flowcharts Solution for ConceptDraw Solution Park to create your own professional looking Sales Process Flowcharts quick, easy and effective.
All source documents are vector graphic documents. They are available for reviewing, modifying, or converting to a variety of formats (PDF file, MS PowerPoint, MS Visio, and many other graphic formats) from the ConceptDraw STORE. The Sales Flowcharts Solution is available for all ConceptDraw DIAGRAM
TEN RELATED HOW TO's:
Business graphic applications show a special knowledge representations and include many features for creating schematic pictures. These graphic tools are known as flowchart maker or flowchart maker software.
Picture: Flowchart Maker
Related Solution:
Event-Driven Process chain Diagrams for improvement throughout an organisation. Best software for Process Flow Diagram. The Event-driven Process Chain (EPC) Diagrams allows managers to plan processes and resources.
Picture: Business process Flow Chart — Event-Driven Process chain (EPC) diagrams
Related Solution:
ConceptDraw DIAGRAM is a business flowchart software includes the wide flowchart examples package.
Picture: Basic Flowchart Examples
Related Solution:
ConceptDraw DIAGRAM extended with IDEF0 Diagrams solution from the Software Development area of ConceptDraw Solution Park is a powerful diagramming and vector drawing IDEF0 software. All IDEF0 diagrams created in ConceptDraw DIAGRAM are vector graphic documents and can be reviewed, modified and converted to MS Visio XML format. To obtain the IDEF0 Visio documents from ConceptDraw DIAGRAM documents use the wide export possibilities of ConceptDraw DIAGRAM.
Picture: IDEF0 Visio
Related Solution:
The Total Quality Management Diagram solution helps you and your organization visualize business and industrial processes. Create Total Quality Management diagrams for business process with ConceptDraw software.
Picture: TQM Diagram — Professional Total Quality Management
Related Solution:
The HR Management Software is an incredibly powerful tool for those who need to analyze or present human resource process flows in a visually effective manner.
Picture: HR Management Software
Related Solution:
Learning English On-line using Skype. Mind map as a presentation makes it powerful tool for eLearning. E-Learning tools are slideshows, presentations, videos, mind maps.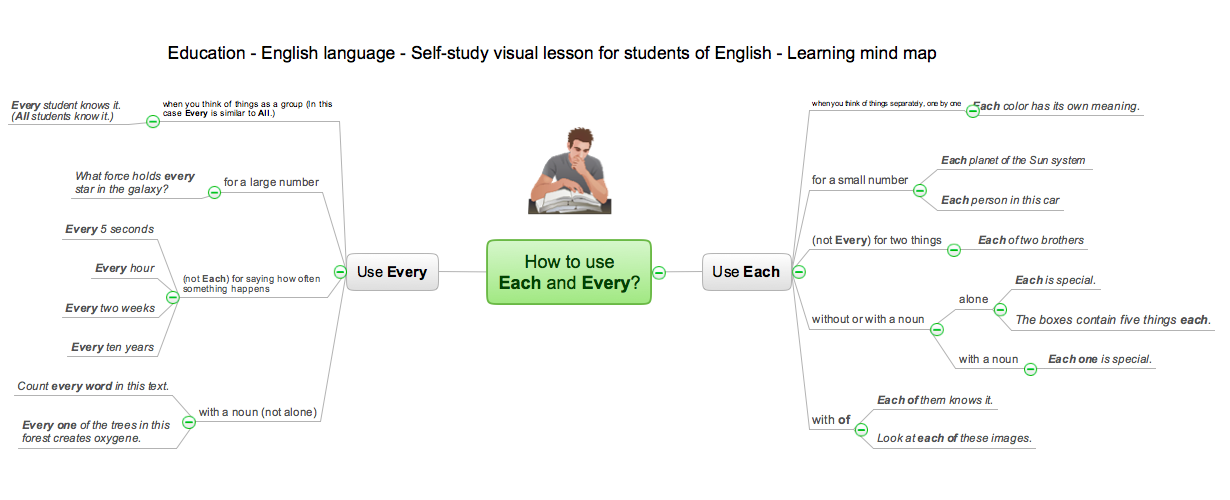
Picture: eLearning - Easy English on Skype
Related Solution:
Customer relationship management is an important component of sales success. Visualizing sales data you may put some KPI related to customers relationship management to your Sales dashboard and track this important aspect in real time.
Picture: Customer Relationship Management
UML state machine's goal is to overcome the main limitations of traditional finite-state machines while retaining their main benefits.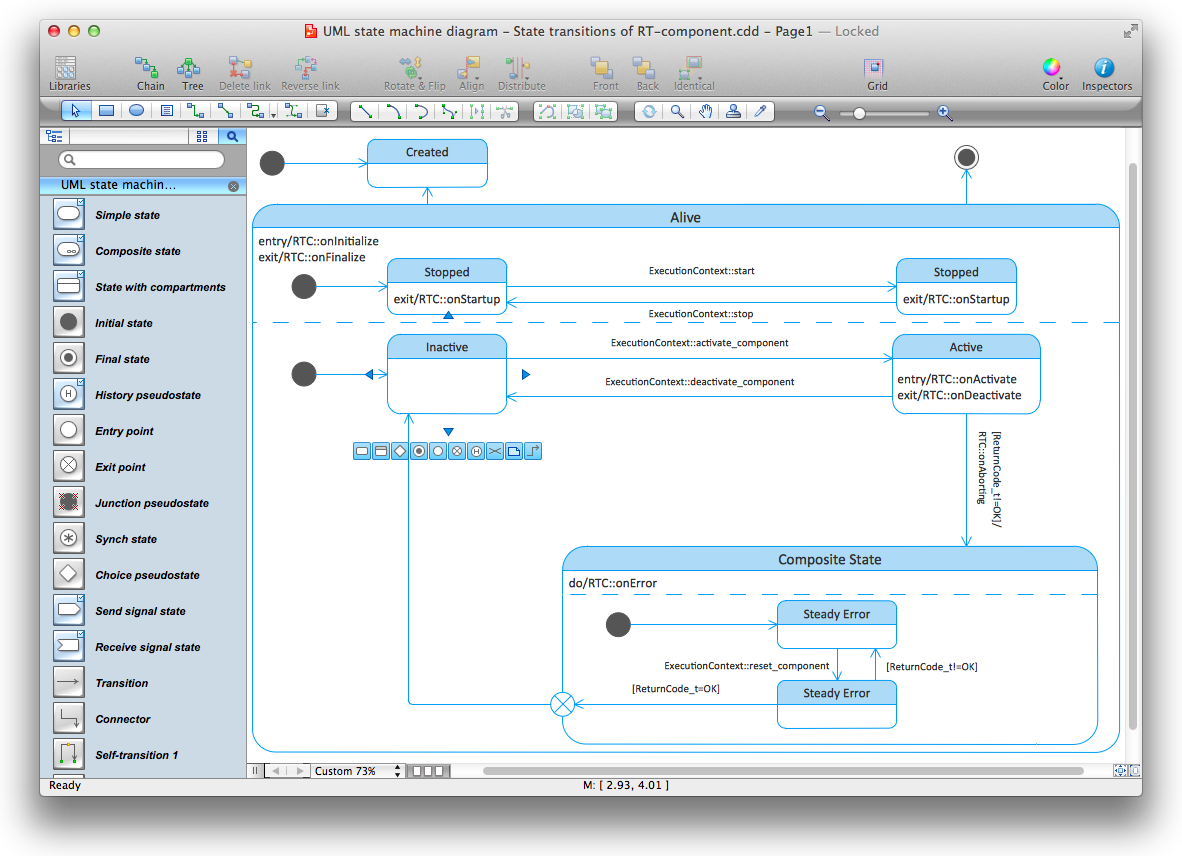
Picture: Diagramming Software for Design UML State Machine Diagrams
This action mindmap helps to quick answer customers' frequently asked questions and to provide useful info about bank services.
Picture: Bank Detailed Answers
Related Solution:


