How to Create a Line Chart
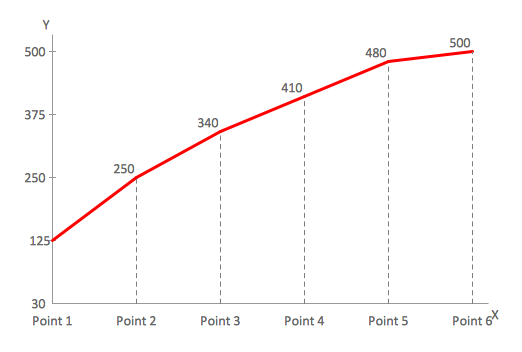
Line graph (text -> height) shapes.
- Drag and drop chart shape from the library to your document.
- Select the chart by mouse click. The Action menu icon appears.
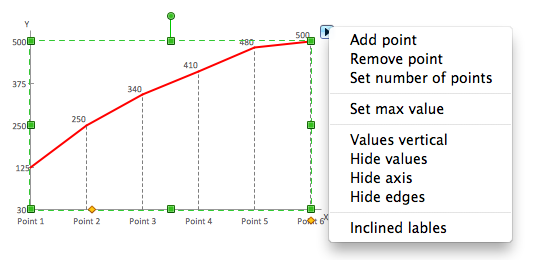
- Click on the icon to open Action menu.
- To change point number use Action menu commands Add point, Remove point, Set number of points.
- To set maximum value for vertical axis use Action menu command Set max value.
- To change orientation of point labels use Action menu command Values vertical/horizontal.
- To hide or show point values use Action menu command Hide/Show values.
- To hide or show axises use Action menu command Hide/Show axis.
- To hide or show edges in the line graph use Action menu command Hide/Show edges.
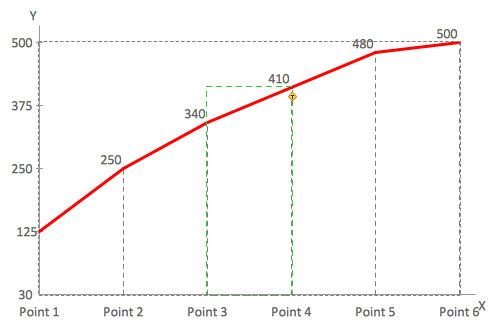
- To change value select the chart, then select point and type new value.
- To add or change chart caption select the chart and simply start typing.
- To change orientation of category labels under horizontal axis use Action menu command Inclined/Horizontal labels.
- To move category labels up and down select the chart and use control dot in the bottom right corner of the shape.
- To change space between points select the chart and use control dot on the horizontal axis.
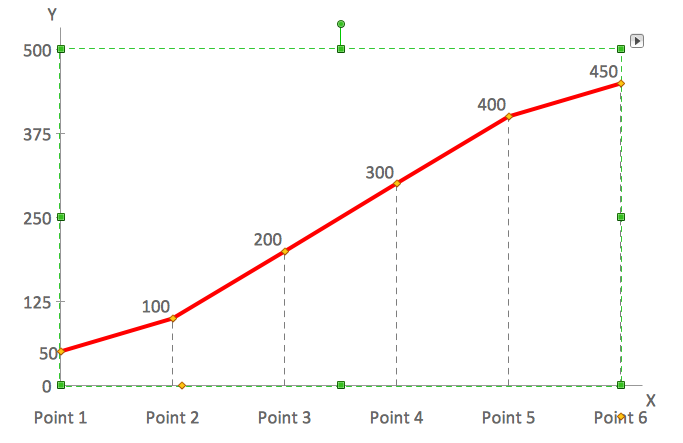
Line graph (control dots) shapes.
- Drag and drop chart shape from the library to your document.
- Select the chart by mouse click. The Action menu icon appears.
- Click on the icon to open Action menu.
- To change point number use Action menu commands Add point, Remove point, Set number of points.
- To set maximum value for vertical axis use Action menu command Set max value.
- To change orientation of point labels use Action menu command Values vertical/horizontal.
- To hide or show point values use Action menu command Hide/Show values.
- To hide or show axises use Action menu command Hide/Show axis.
- To hide or show edges in the line graph use Action menu command Hide/Show edges.
- To change point value select the chart, then move control dot of the point vertically.
- To add or change chart caption select the chart and simply start typing.
- To change orientation of category labels under horizontal axis use Action menu command Inclined/Horizontal labels.
- To move category labels up and down select the chart and use control dot in the bottom right corner of the shape.
- To change space between points select the chart and use control dot on the horizontal axis.

Example 1. Line chart example — France exports of goods and services.
See Also:
- How to Create a Bar Chart
- How to Create a Pie Chart
- How to Create a Pyramid Chart
- How to Create a Scatter Chart
- How to Create a Column Chart
TEN RELATED HOW TO's:
There are plenty of diagramming tools, the question is to choose the most suitable for your needs. For example, you can choose ConceptDraw DIAGRAM as organizational chart software and get fascinating results in a few minutes. An orgchart is useful for any corporation.
This is an example of a hierarchical organization scheme of the company. It has tree-like structure. Each middle manager is subordinated to a few employees, and he is accountable to one of the top managers. Every type of organizational composition of businesses may be presented in the view of an organizational chart that is supported by ConceptDraw Organisational Charts solution. There are number of ways of building a structure of business organization, establishing how it should function.
Picture: ConceptDraw DIAGRAM - Organizational chart software
Related Solution:
Data base diagrams describes inter-related data and tables. It describes roles and relationships, internal and external dependencies, data exchange conventions and structures of knowledge domain.
ConceptDraw Software provides number of data-base chart libraries including major 49 vector symbols. Use these DFD flowchart symbol libraries to design data-base structure and models, use it to design data base process-oriented models, or simple data-oriented models. The are special drawing tools for making data flowcharts, data process diagrams, structured analysis diagrams, and information flow diagrams.
Picture: Database Flowchart Symbols
Related Solution:
Public catering business will always be in demand.To attract a lot of clients, it’s important to have a detailed banquet hall plan, a diverse menu and reasonable prices. If you want to create a good plan, you can use drawing software.
When planning and considering the layout of a banquet hall, one must take into consideration, that it is very significant to make it stylish with correctly selected appointment and celebratory belongings. Tables and seating must be handily arranged. The furniture arrangement can changes depending on client requirements, kind of banquet and amount of guests. ConceptDraw Cafe and Restaurant Plans solution supplies a dozens of predesigned vector graphic objects of banquet furniture and accessories. Thus you can design the Banquet Hall layout for the celebrations in any style and any number of guests.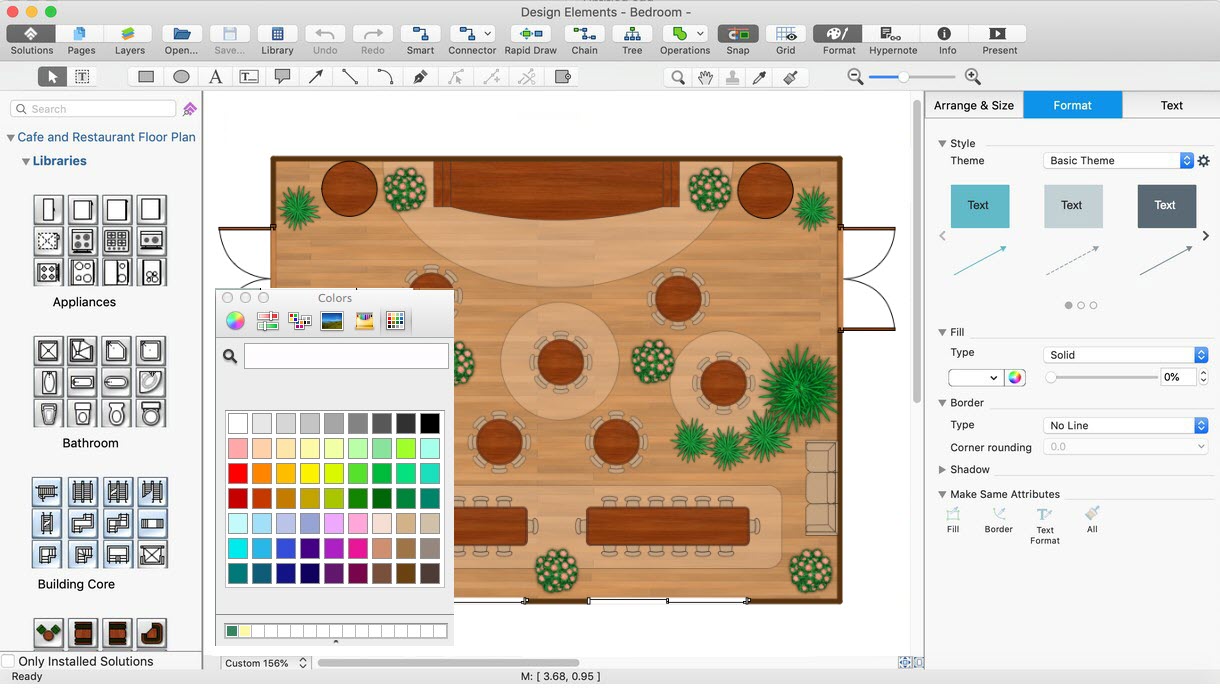
Picture: Banquet Hall Plan Software
Related Solution:
Create a Line Chart with ConceptDraw using our tips. Here you can find an explanation of how to create a line chart quickly.
Picture: How to Create a Line Chart
Related Solution:
The Line Graphs solution from Graphs and Charts area of ConceptDraw Solution Park contains a set of examples, templates and design elements library of scatter charts.
Use it to draw scatter graphs using ConceptDraw DIAGRAM diagramming and vector drawing software for illustrating your documents, presentations and websites.
Picture: Scatter Chart Examples
Related Solution:
A Picture Graph is a popular and widely used type of a bar graph, which represents data in various categories using the pictures.
Picture: Picture Graph
Related Solution:
Energy Pyramid Diagram is a visual graphical representation of the biomass productivity on the each trophic level in a given ecosystem. Its designing in ConceptDraw DIAGRAM will not take much time thanks to the unique Pyramid Diagrams solution from the Marketing area of ConceptDraw Solution Park.
Energy Pyramid Diagram begins from the producers (plants) and proceeds through a few trophic levels of consumers (herbivores which eat these plants, the carnivores which eat these herbivores, then carnivores which eat those carnivores, and so on) to the top of the food chain.
Picture: Energy Pyramid Diagram
Related Solution:
Swim lanes are visual elements used in Business Process Maps, Process Flow Diagrams and Flowcharts.
ConceptDraw DIAGRAM diagramming and vector drawing software extended with Business Process Mapping Solution from the Business Processes Area of ConceptDraw Solution Park is ideal for drawing Business Process Maps and Swim Lanes Flowcharts.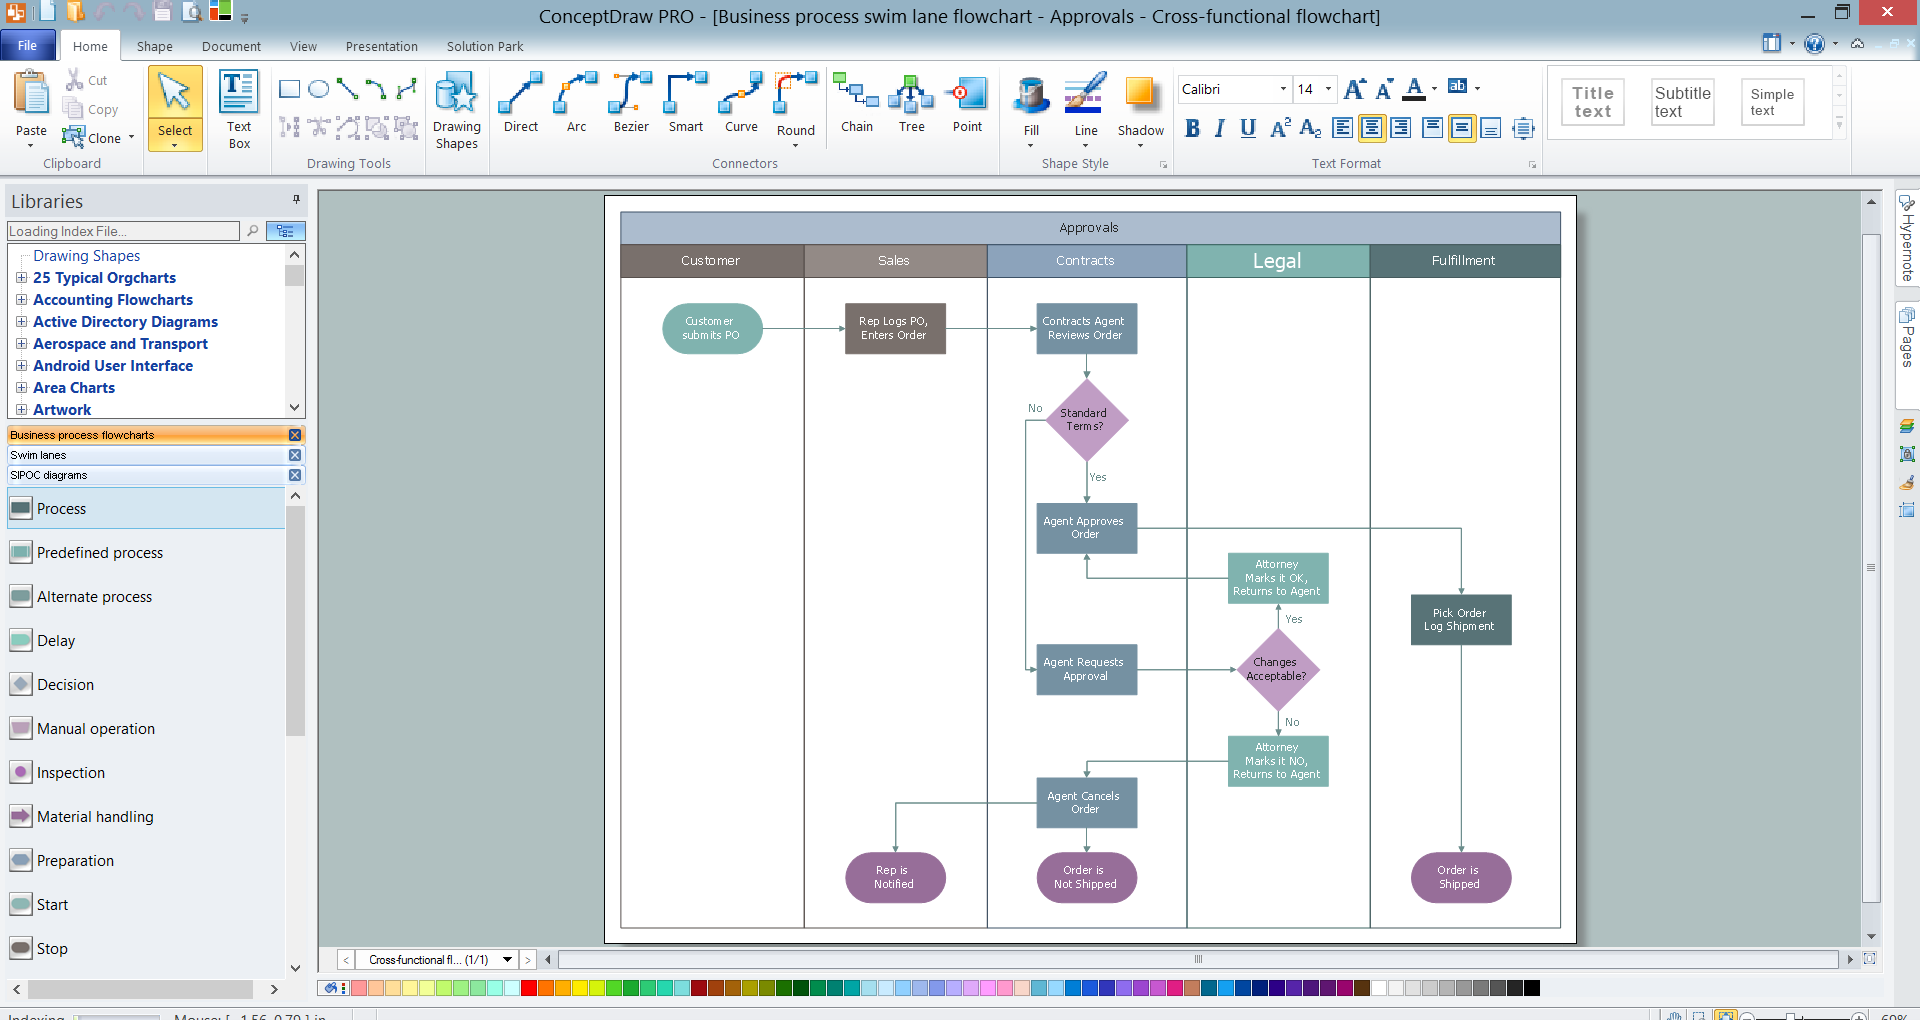
Picture: Swim Lanes
Related Solution:
You can design the Prioritization Matrix by hand on the paper, but we offer you the most easier way — to use the ConceptDraw DIAGRAM diagramming and vector drawing software extended with Seven Management and Planning Tools Solution from the Management Area.
Picture: Prioritization Matrix
Related Solution:
To make a histogram, you need to divide the range of values into a series of intervals and then to count how many of the values fall into each of the intervals.
Picture: Histogram
Related Solution:
ConceptDraw
DIAGRAM 18