Example 1. Swim Lanes Flowchart in ConceptDraw DIAGRAM
It's incredibly convenient to develop Swim Lanes Flowcharts in ConceptDraw DIAGRAM using the predesigned vector objects offered by 3 libraries of Business Process Mapping Solution:
- Business Process Flowcharts library
- SIPOC Diagrams library
- Swim Lanes library

Example 2. Business Process Flowcharts Library Design Elements
All that you need is simply choose the needed objects from the offered, drag them from the libraries to your document and place in desired order.
You can create your diagram from the beginning in new document or use as the base one of the professionally designed samples offered by Business Process Mapping Solution in ConceptDraw STORE.

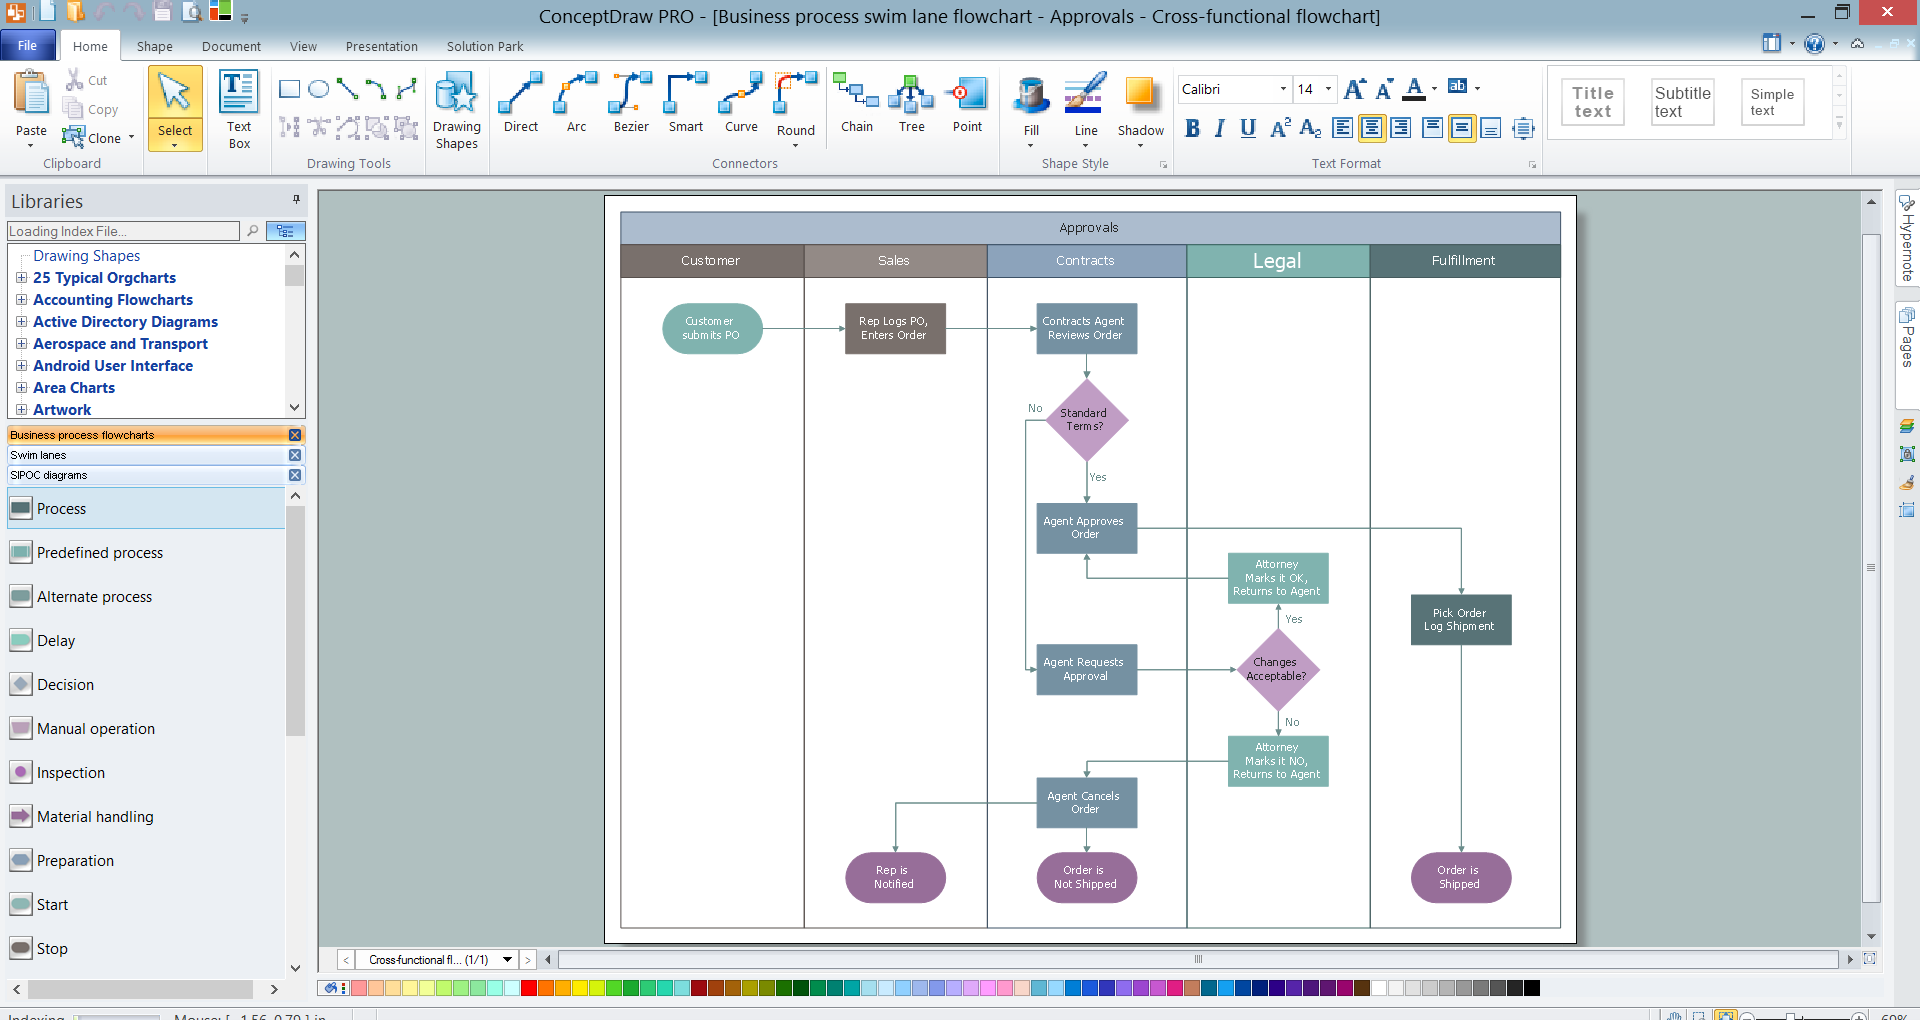
Example 3. Swim Lanes Flowchart - Approvals
The sample you see on this page was created in ConceptDraw DIAGRAM software using the tools of Business Process Mapping Solution and demonstrates the Swim Lanes Flowchart. This sample was included in Business Process Mapping Solution and is available from ConceptDraw STORE. An experienced user spent 10 minutes creating this sample.
Use the Business Process Mapping Solution for ConceptDraw DIAGRAM software to design your own Swim Lanes Flowcharts, Business Process Maps and SIPOC Diagram fast, easy and effective.
All source documents are vector graphic documents. They are available for reviewing, modifying, or converting to a variety of formats (PDF file, MS PowerPoint, MS Visio, and many other graphic formats) from the ConceptDraw STORE. The Business Process Mapping Solution is available for all ConceptDraw DIAGRAM users.
TEN RELATED HOW TO's:
The vector stencils library Watercraft contains clipart of ships, boats, yachts, submarines for ConceptDraw DIAGRAM diagramming and vector drawing software.
Use it to draw illustrations of vessels and water transport over a sea, ocean, lake, canal, river.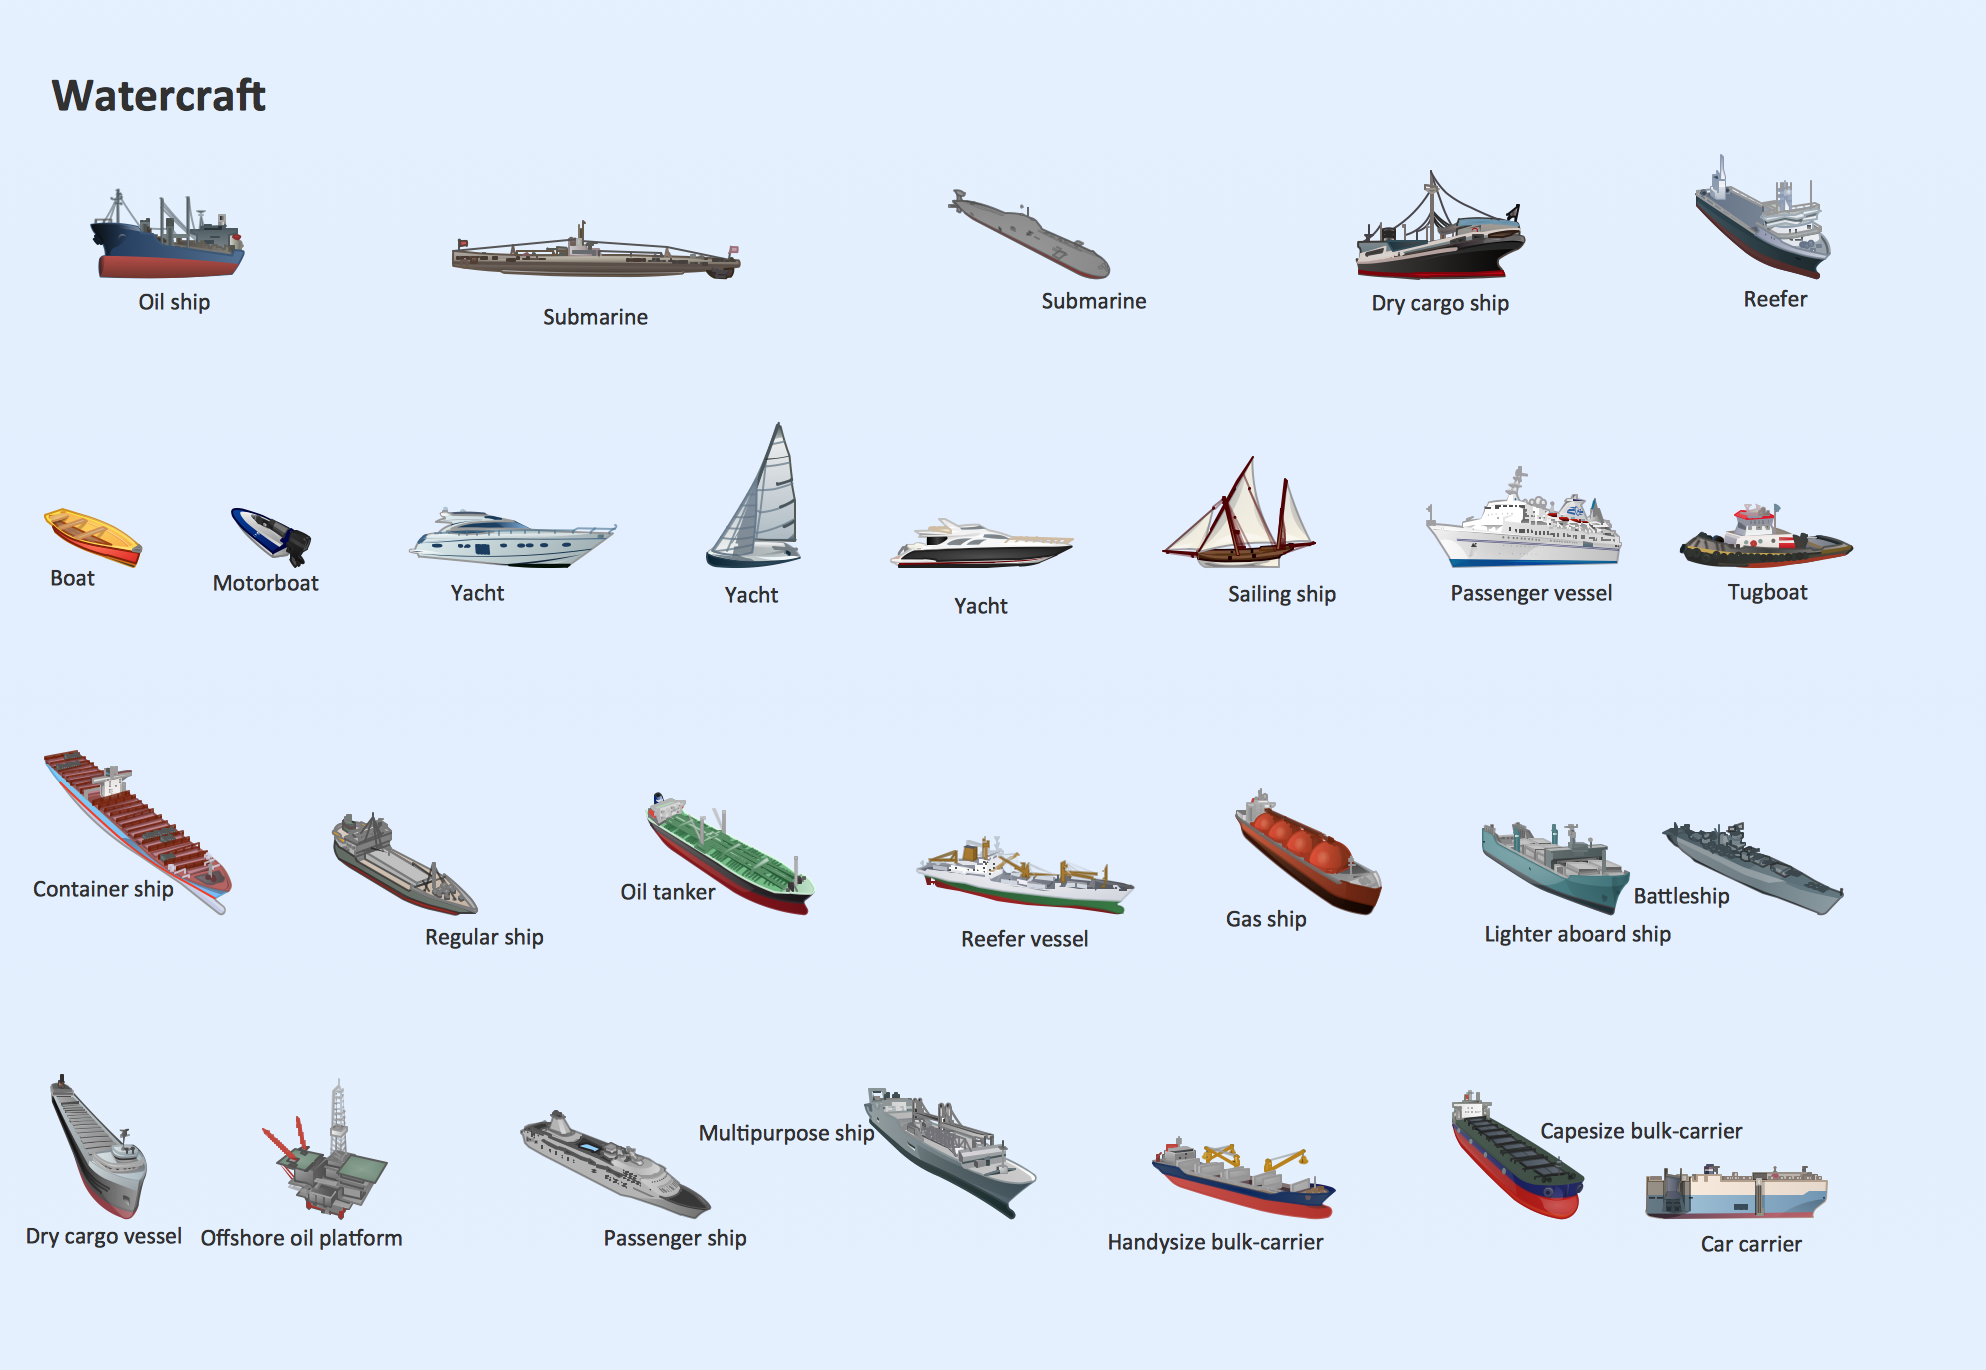
Picture: Watercraft - Design Elements
Related Solution:
A healthy lifestyle and a balanced healthy diet are the basis of health, longevity and good feeling. Every day a human must receive with a food the correct proportions of nutrients and vitamins. It is very important to make a proper menu that includes tasty and healthy dishes.
ConceptDraw DIAGRAM diagramming and vector drawing software enhanced with Health Food solution from the Food and Beverage area of ConceptDraw Solution Park will help you easy develop, depict and appetizingly illustrate your healthy food recipes.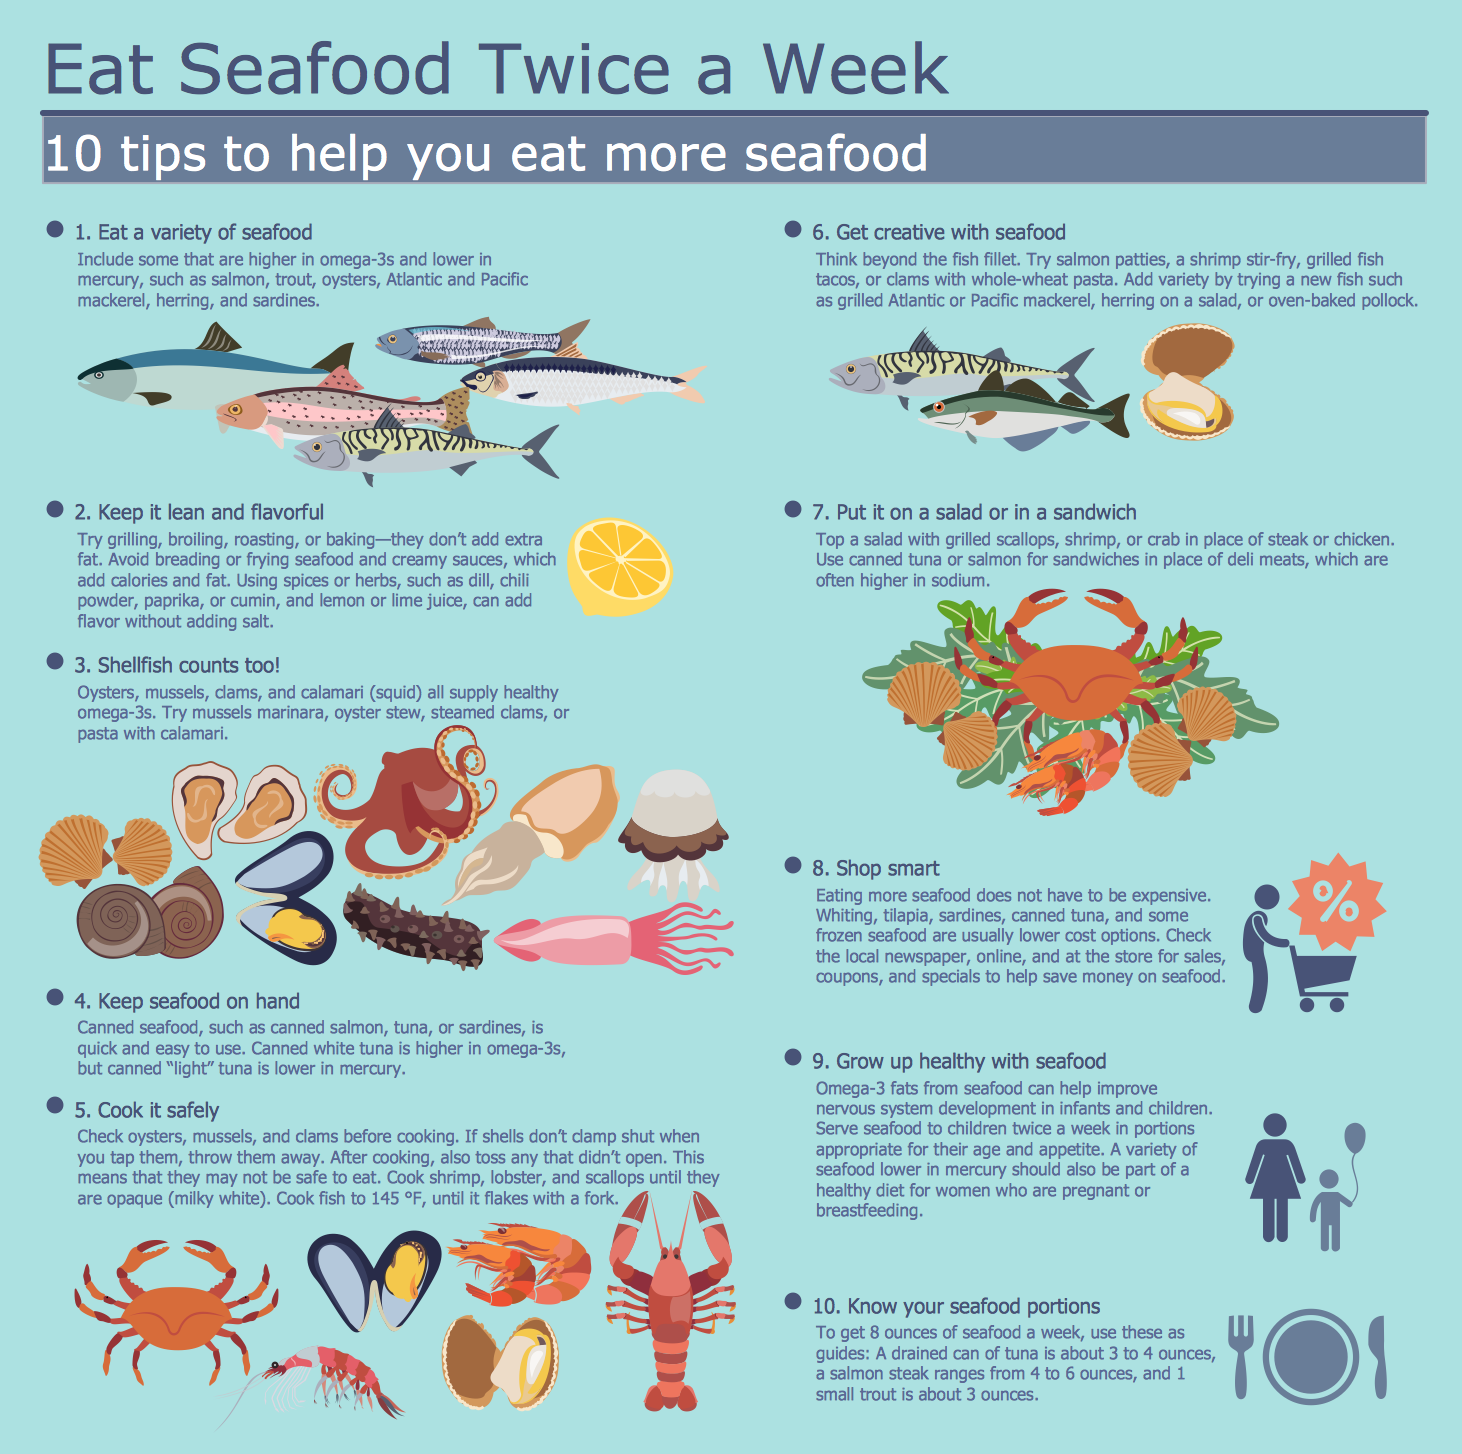
Picture: Healthy Food Recipes
Related Solution:
The Total Quality Management Diagram solution helps you and your organization visualize business and industrial processes. Create Total Quality Management diagrams for business process with ConceptDraw software.
Picture: Total Quality Management Value
Related Solution:
ConceptDraw DIAGRAM is a powerful software that helps you create professional looking cross-functional flowcharts with the well-designed objects. ConceptDraw DIAGRAM allows you to focus on work, not the drawing process. ConceptDraw Arrows10 Technology allows to draw connectors with smart behavior that gives flexibility to you during work process.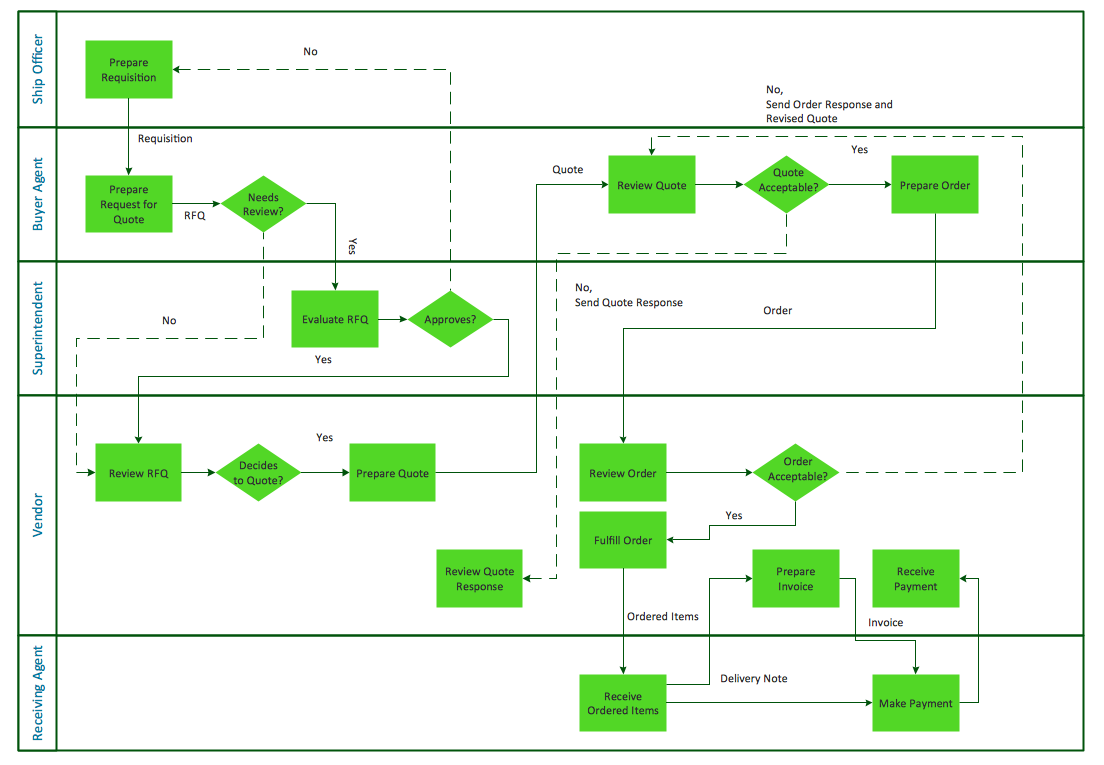
Picture: Horizontal Cross Functional Flowchart
Related Solution:
A flowchart is a simple but very functional tool when it comes to understanding a workflow or to removing unnecessary stages from a process. When drawing flowcharts, keep in mind that there are four common types of flowcharts, like document flowcharts and data flowcharts that show control over a data or document flow over a system. To show controls on a physical level, use system flowcharts. In addition, to show controls in a program, you can draw a program flowchart.
This flowchart diagram represents the piece of an article editing process, that involves the author and editor. It was created using the Basic Flowchart notation that consists from the basic flowchart symbols. The start and the end of the process are indicated with "Terminator" symbols. The "Process" symbols show the action steps consisting from making edits and searching for a compromise, when the author does not agree with the suggestions of the editor. The "Process" symbol is the general symbol in process flowcharts. The "Decision" symbol indicates a branching in the process flow. There are two branches indicated by a Decision shape in the current flowchart (Yes/No, Disagree/Agree). This basic flowchart can be used as a repeating unit in the workflow diagram describing the working process of some editorial office.
Picture: Types of Flowcharts
Related Solution:
Event-Driven Process chain Diagrams for improvement throughout an organisation. Best software for Process Flow Diagram. The Event-driven Process Chain (EPC) Diagrams allows managers to plan processes and resources.
Picture: Business process Flow Chart — Event-Driven Process chain (EPC) diagrams
Related Solution:
Use the set of special professionally developed swim lane flowchart symbols - single, multiple, vertical and horizontal lanes from the Swimlanes and Swimlanes BPMN 1.2 libraries from the Business Process Diagram solution, the Swim Lanes library from the Business Process Mapping solution as the perfect basis for your Swim Lane Flowcharts of processes, algorithms and procedures.
Picture: Swim Lane Flowchart Symbols
Related Solution:
When searching for a diagramming tool, we look for a powerful and reliable software that would be easy to use. To mention one, ConceptDraw DIAGRAM has all the necessary features to create cross-functional flowcharts (Swim Lanes) quick and effortlessly. You can draw swim lane diagrams in both vertical and horizontal ways.
This cross-functional flowchart displays a payroll process. It explains to each participant his role in the process depending on the category, represented with swimlanes. Using this flowchart, every employee can easily find out what he can expect in terms of salary. Generally a cross-functional diagram enables one to take a look at processes with a wider scope and with more precision than simple flowchart. Business process capturing using cross-functional flowcharts can be useful for stakeholders and managers to define clearly the staff's roles and responsibilities.
Picture: Cross-Functional Flowchart (Swim Lanes)
Related Solution:
ConceptDraw has 142 vector stencils in the 8 libraries that helps you to start using software for designing own Business Process Diagrams. Use Swimlanes library with 20 objects from BPMN.
Picture: Business Process Elements: Swimlanes
Related Solution:
This sample was created in ConceptDraw DIAGRAM diagramming and vector drawing software using the Cross-Functional Flowcharts solution from the Business Processes area of ConceptDraw Solution Park.
This sample shows the Swim Lanes Flowchart of Identification and logging.
Picture: Swim Lanes Flowchart. Flowchart Examples
Related Solution:

