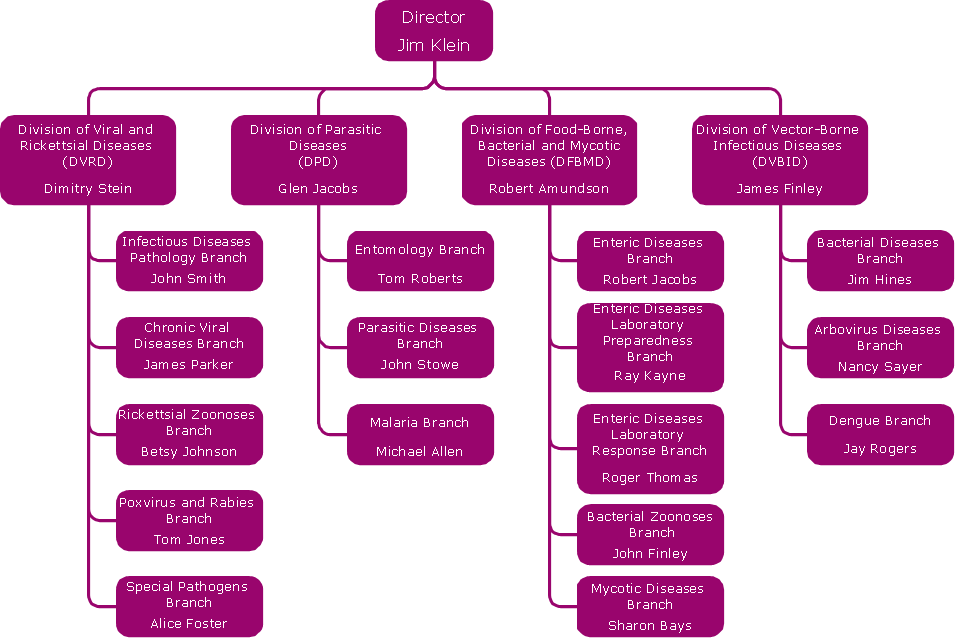
Sample 1. Organization chart - National center for infectious diseases.
ConceptDraw DIAGRAM diagramming software provides vector shapes and connector tools for quick and easy drawing diagrams for business, technology, science and education.
Use ConceptDraw DIAGRAM enhanced with solutions from ConceptDraw Solution Park to create diagrams to present and explain structures, process flows, logical relationships, networks, design schemes and other visually organized information and knowledge.
TEN RELATED HOW TO's:
ConceptDraw DIAGRAM is a vector-based network diagramming software. Now it has powerful tools to draw 3D Network Diagrams.
Use more than 2 000 pre-designed 3D network elements for customizing your network diagrams. Computer & Networks solution allows you for design 3D LAN and WAN, schematic and wiring drawings.
Picture: 3D Network Diagram Software
Related Solution:
Marketing Infographics is a very popular tool that allows to represent the complex data, knowledge, and other marketing information in a simple, visual and attractive graphical form. But how to draw Marketing Infographics simply and quickly? ConceptDraw DIAGRAM diagramming and vector drawing software extended with unique Marketing Infographics Solution from the Business Infographics Area will help you design marketing infographics without efforts.
Picture: Marketing Infographics
Related Solution:
A block diagram is a diagram of a system in which the principal parts or functions are represented by blocks connected by lines that show the relationships of the blocks. ConceptDraw DIAGRAM diagramming and vector drawing software extended with Block Diagrams Solution from the Diagrams Area is a powerful Block Diagram Creator.
Picture: Block Diagram Creator
Related Solution:
The network architecture and design specialization will help you gain the technical leadership skills you need to design and implement high-quality networks that support business needs.
Picture: Computer Network Architecture. Computer and Network Examples
While creating flowcharts and process flow diagrams, you should use special objects to define different statements, so anyone aware of flowcharts can get your scheme right. There is a short and an extended list of basic flowchart symbols and their meaning. Basic flowchart symbols include terminator objects, rectangles for describing steps of a process, diamonds representing appearing conditions and questions and parallelograms to show incoming data.
This diagram gives a general review of the standard symbols that are used when creating flowcharts and process flow diagrams. The practice of using a set of standard flowchart symbols was admitted in order to make flowcharts and other process flow diagrams created by any person properly understandable by other people. The flowchart symbols depict different kinds of actions and phases in a process. The sequence of the actions, and the relationships between them are shown by special lines and arrows. There are a large number of flowchart symbols. Which of them can be used in the particular diagram depends on its type. For instance, some symbols used in data flow diagrams usually are not used in the process flowcharts. Business process system use exactly these flowchart symbols.
Picture: Flowchart Symbols: Meaning and Examples
Related Solution:
Les meilleures présentations peuvent être obtenues en utilisant les modèles « Conceptdraw » adéquats comme base de départ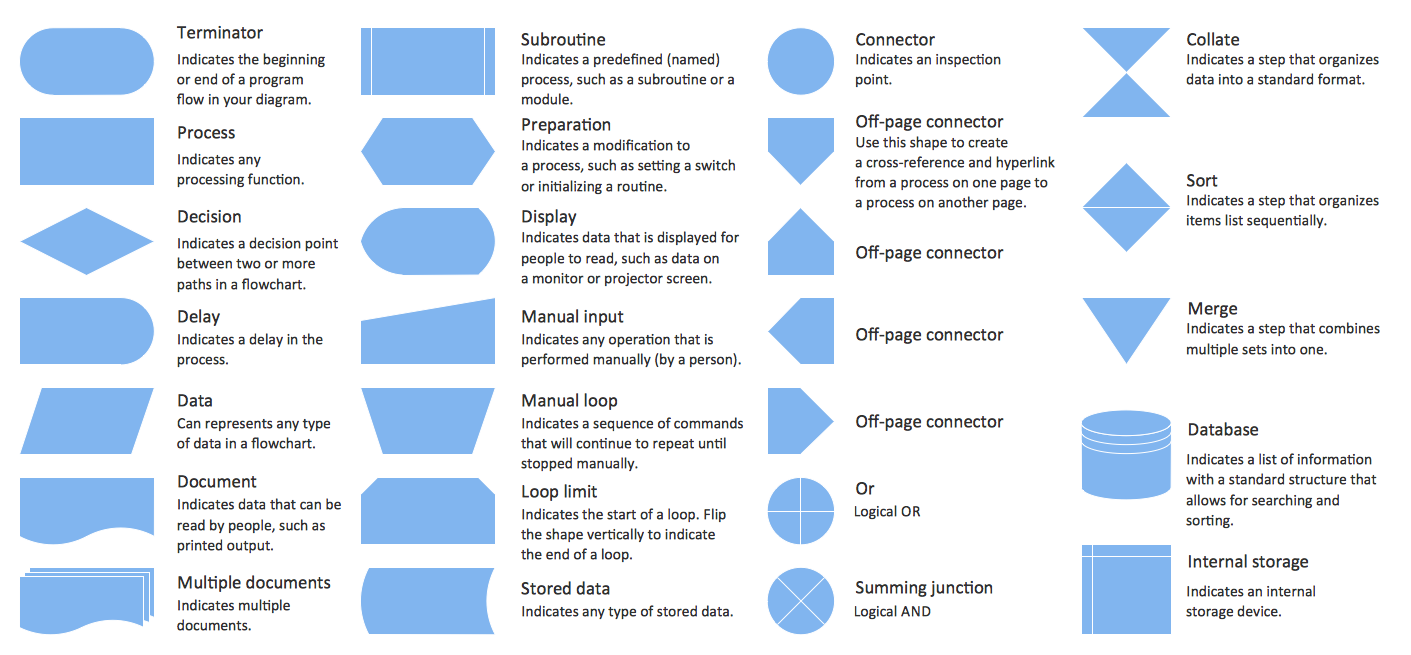
Picture:
Conception d'organigramme
Organigramme des symboles, formes, stencils et icônes
Related Solution:
What is a computer network? This is a set of devices and systems that are connected to each other (logically or physically) and communicate with each other. This could include servers, computers, phones, routers, and so on. The size of this network can reach the size of the Internet, and can consist of only two devices connected by a cable.
This sample shows the connection scheme of the home WLAN equipment to the Internet.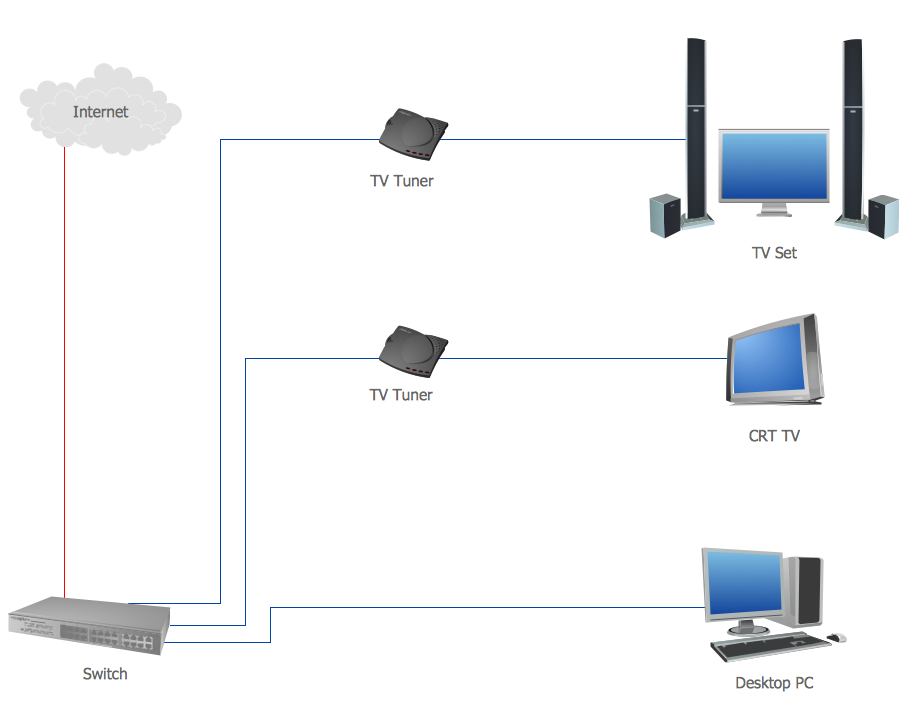
Picture: Diagram of a Basic Computer Network. Computer Network Diagram Example
Related Solution:
ConceptDraw DIAGRAM extended with Organizational Charts Solution from the Management Area is a powerful but easy-to-use Organizational Structure Diagram Software.
Organizational Charts Solution provides a wide variety of templates and samples and large quantity of predesigned vector objects to help you design your Organizational Structure Diagrams and other business diagrams.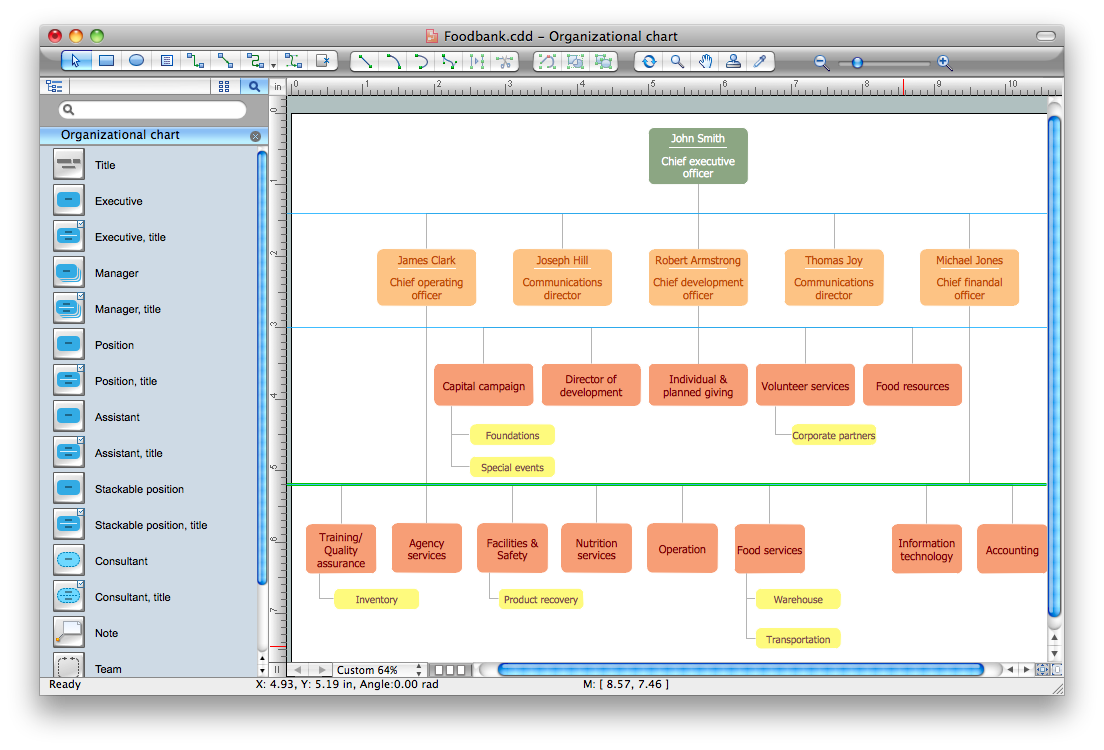
Picture: Organizational Structure Diagram Software
Related Solution:
Visio Files and ConceptDraw. ConceptDraw DIAGRAM is compatible with MS Visio.VDX formatted files.VDX is Visio’s open XML file format, and it can be easily imported and exported by ConceptDraw DIAGRAM.
Picture: Visio Files and ConceptDraw
It is easy to recreate any informational system structure using diagrams. There are three main components of any ER diagram: entity, attribute and relationship. Basing on these three components, one can define other, less used elements, such as weak entity or relationship, derived attribute, recursive relationship etc.
This is the set of graphic elements of ERD Chen's notation. This ERD notation is used to represent an entity–relationship models. It involves the set of geometric forms: rectangles - depicting entities, ovals - representing attributes and diamonds depicting relationships assigned for first-class objects, that can have relationships and attributes of their own. Connections are displayed with arrowed lines. It is known that the Chen's ERD notation is used to show a detailed view of entities and relationships. ConceptDraw Entity-Relationship Diagram solution from the Software Development section of Solution Park provides the ability to create ERD of database structure for software development purposes using the Chen’s notation elements.
Picture: Components of ER Diagram
Related Solution: