Made with
ConceptDraw
MINDMAP 16

How To Do A Mind Map In PowerPoint

Presentation

ConceptDraw MINDMAP is an advanced tool for exporting mindmaps to PowerPoint for making awesome presentations. You can simply generate, change, update your mindmap and then make a presentation in PowerPoint.

The latest update to ConceptDraw MINDMAP makes generating presentations from your mind map faster and easier than ever before. The new Presentation tab on the ribbon houses all your presentation controls in a single, convenient location.

To being presenting with zero prep time, simply click Start Presentation. MINDMAP automatically generates a slideshow of each of your Main Topics, and engages full-screen presentation mode. Click the mouse to advance slides.

Create Default Presentation stores the default slideshow in the Slide Navigator without entering full-screen mode.

Mind map presentation

The Create Slide buttons are used to customize your presentation.Set to Visible captures a slide of the area of your map currently in view. Using the Zoom controls on the View tab of the ribbon, you can focus on specific areas of your map, and quickly create slides of only the content you want.

Set to Selected captures a slide of the selected topic or topics. Set to Selected with Subtopics allows you to select a topic and capture a slide of it and its related subtopics with a single click.

Slide Navigator expands the Slide Navigator tab at the bottom of the window. In the Slide Navigator, you will see all the slides you have created. You can reorder them by dragging and dropping, or remove them by clicking the X in their upper-right corner. Clicking the large plus icon works identically to Set to Visible. Clicking the play icon in the upper-left corner of a slide engages presentation mode beginning from the selected slide.

Beyond its own presentation mode, ConceptDraw MINDMAP also has the ability to export to Microsoft® PowerPoint®. Clicking the MS PowerPoint button opens a window with two options: Outline and Slideshow. Outline exports just the text of your map, allowing you to select from your available PowerPoint themes for the presentation. Slideshow exports the exact images saved in your View Navigator as the slides of a new presentation.

Export to MS PowerPoint

Pictures saves the slides in your Slide Navigator as graphics files in a new folder on your hard drive. A variety of formats are available, including .png, .jpg, .tif, .bmp, and .gif

Send via E-mail opens a new message in your email client with your map’s outline as the text, and attaches both your map file and a .png file exported from your map.

See also Videos:


How To Do A Mind Map In PowerPoint *

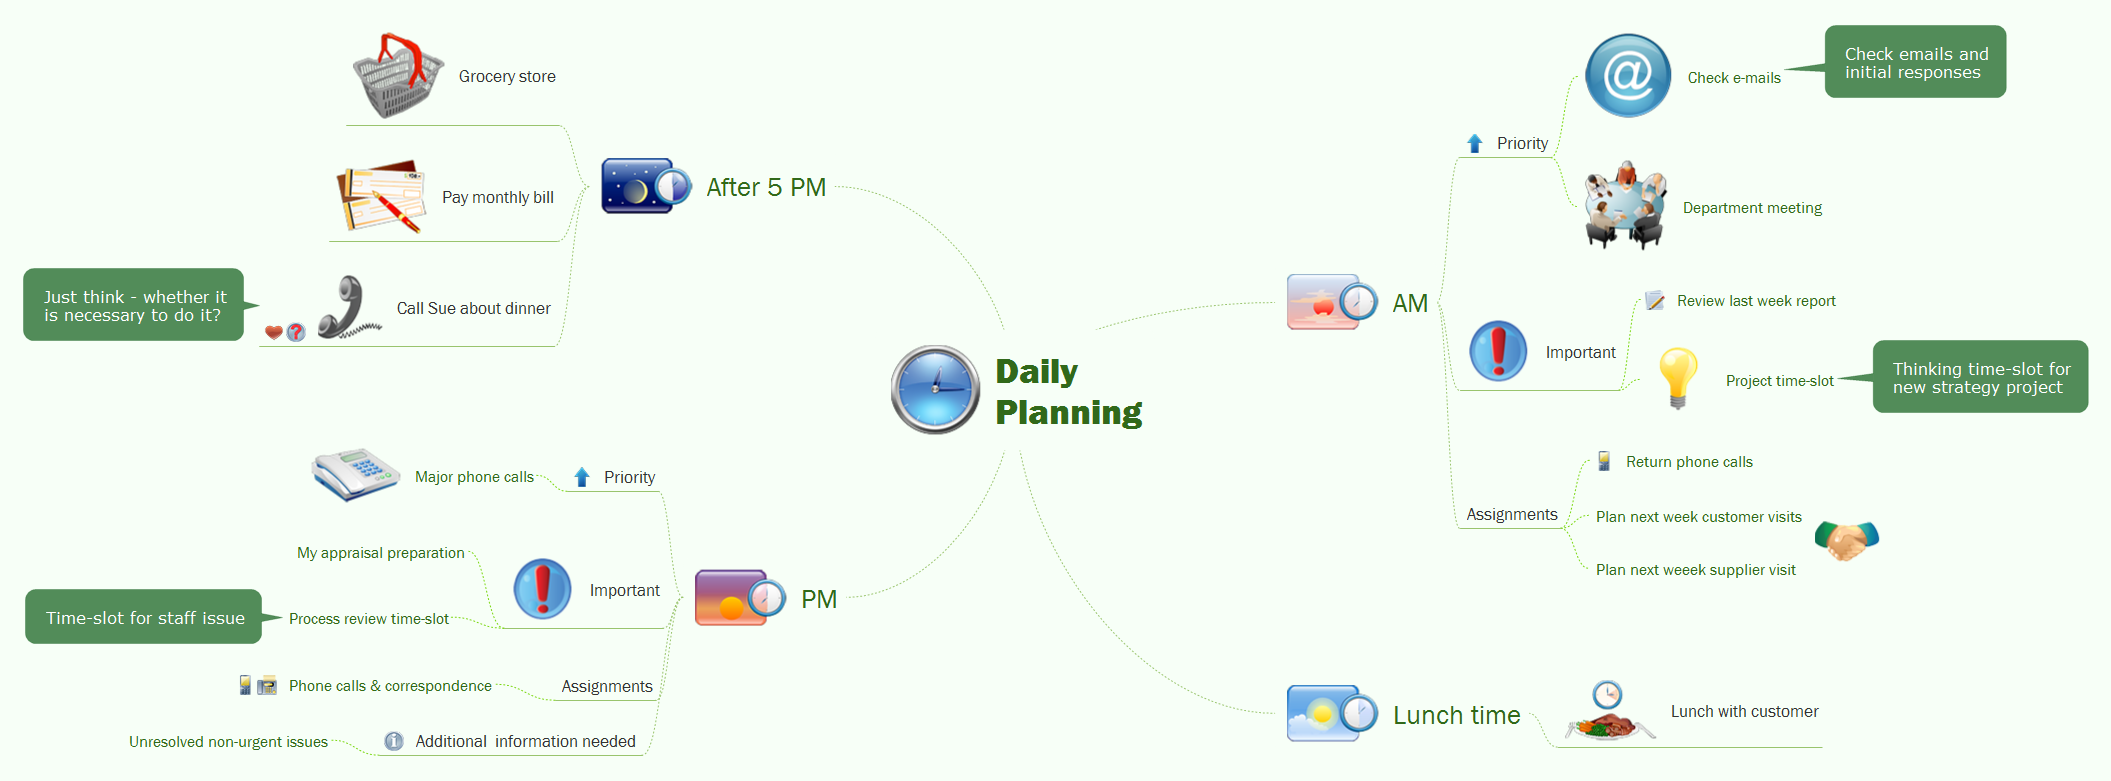
Sample 1. Mind map presentation - Business startup.

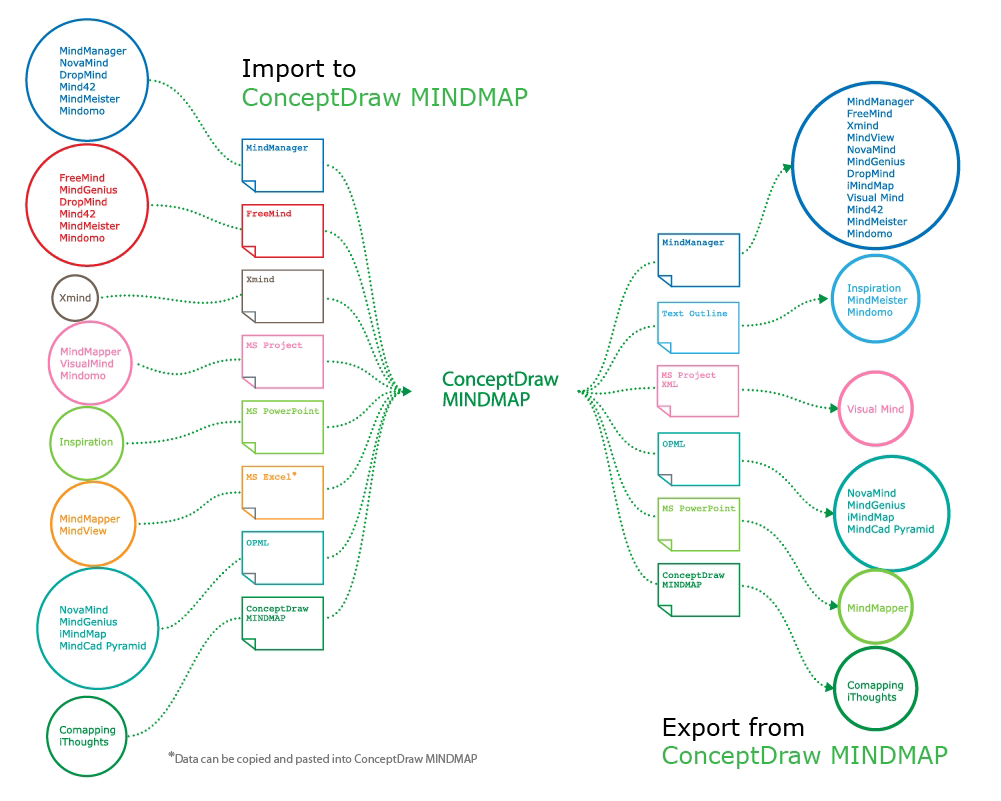
Presentation Exchange solution extends ConceptDraw MINDMAP software with the ability to import presentations from Microsoft PowerPoint, as well as enhancing its existing presentation capabilities.

With the Presentation Exchange solution you can easily extract the content from a PowerPoint presentation to see how it all fits together in a single view. You can review slide content, see how the slides support one another, and refine the story.

NINE RELATED HOW TO's:
Sometimes, when it is difficult to create a functional space plan or to rearrange existing one, the art of interior design comes in. It doesn't matter, if you need a cozy bedroom or an office layout plan, you should use appropriate tools to make your design great. While making a floor plan of a new office it could be useful to apply some design elements such as furniture and office equipment. This diagram presents an office furniture objects that can be used for office interior design planning, or making office furniture and equipment layouts. This vector stencils library is supplied with ConceptDraw Office Layout Plans solution. It contains more then 30 vector objects of office interior for making office floor plans including an office space layout plans and furniture arrangement.Office Layout Plan Design Element
Picture: Interior Design. Office Layout Plan Design Element
Related Solution:
Victoria (abbreviated as Vic.) is a state in the south-east of Australia. Victoria is Australia's most densely populated state and its second-most populous state overall.Geo Map - Australia - Victoria *
Picture: Geo Map - Australia - Victoria
Related Solution:
A team briefing tool is an excellent way to enable communication upwards, downwards and sideways throughout an organisation.How To Conduct Effective Team Briefings *
Picture: How To Conduct Effective Team Briefings
Related Solution:
ConceptDraw DIAGRAM is a powerful business and technical diagramming software tool that enables you to design professional-looking graphics, diagrams, flowcharts, floor plans and much more in just minutes. Maintain business processes performance with clear visual documentation. Effectively present and communicate information in a clear and concise manner with ConceptDraw DIAGRAM.ConceptDraw DIAGRAM  *
Picture: ConceptDraw DIAGRAM
India, officially the Republic of India (Bharat Ganrajya), is a country in South Asia. The vector stencils library India contains contours for ConceptDraw DIAGRAM diagramming and vector drawing software. This library is contained in the Continent Maps solution from Maps area of ConceptDraw Solution Park.Geo Map - Asia - India *
Picture: Geo Map - Asia - India
Related Solution:
It can be tough to get straight into business papers and processes.Otherwise, you can learn how to create flowcharts for an accounting information system and visualize these documents. Accounting diagrams are clear and easy to understand for all the participants of the process. There are symbols used for creating accounting flowcharts using ConceptDraw DIAGRAM and its Accounting Flowcharts solution. Accounting flow charts are a special kind of flow charts. Actually a variety of flowcharts are often used to facilitate many aspects of a workflow of accounting department. Accounting flowcharts are utilized to support creating accounting documentation, to depict positions responsible for fulfillment of each phase of accounting workflow.How to Create Flowcharts for an Accounting Information System
Picture:
How to Create Flowcharts for an
Accounting Information System
Related Solution:
When trying to figure out the nature of the problems occurring within a project, there are many ways to develop such understanding. One of the most common ways to document processes for further improvement is to draw a process flowchart, which depicts the activities of the process arranged in sequential order — this is business process management. ConceptDraw DIAGRAM is business process mapping software with impressive range of productivity features for business process management and classic project management. This business process management software is helpful for many purposes from different payment processes, or manufacturing processes to chemical processes. Business process mapping flowcharts helps clarify the actual workflow of different people engaged in the same process. This samples were made with ConceptDraw DIAGRAM — business process mapping software for flowcharting and used as classic visio alternative because its briefly named "visio for mac" and for windows, this sort of software named the business process management tools. This flowchart diagram shows a process flow of project management. The diagram that is presented here depicts the project life cycle that is basic for the most of project management methods. Breaking a project into phases allows to track it in the proper manner. Through separation on phases, the total workflow of a project is divided into some foreseeable components, thus making it easier to follow the project status. A project life cycle commonly includes: initiation, definition, design, development and implementation phases. Distinguished method to show parallel and interdependent processes, as well as project life cycle relationships. A flowchart diagram is often used as visual guide to project. For instance, it used by marketing project management software for visualizing stages of marketing activities or as project management workflow tools. Created with ConceptDraw DIAGRAM — business process mapping software which is flowcharting visio alternative or shortly its visio for mac, this sort of software platform often named the business process management tools.Process Flowchart
Picture: Process Flowchart: A Step-by-Step Comprehensive Guide
Related Solution:
ConceptDraw DIAGRAM is idea to draw the geological maps of World from the pre-designed vector geo map shapes.Geo Map - World *
Picture: Geo Map - World
Related Solution:
Design versatile maps based on the South America continent map effortlessly. 🔸 Create stunning and detailed South America maps and use them in ✔️ presentations, ✔️ educational materials, ✔️ websites, ✔️ business documentsGeo Map — South America Continent
Picture: Geo Map — South America Continent
Related Solution:
ConceptDraw
MINDMAP 16