Business Process Workflow Diagrams & Software
Business Process Workflow Diagram is a professional visual tool that is widely applied for business development, business analysis, business process optimization and documenting business processes. Flow Chart of business process lets depict in details the steps of business processes and flow of tasks between them, the execution of business processes, transfer of data and documents.
As the economy becomes more global and companies expand wide borders, it becomes more and more important to understand, standardize, and analyze the business processes and workflows to help businesses improve and stay relevant in the market.
Understanding Workflow Diagrams in Business
Workflow diagrams are a powerful and widely used tool to represent and standardize a business process, system, or project. They provide a visual overview of the process, tasks, and steps to complete it from start to finish and outline the responsible persons at each step. Workflow diagrams are linear and chronologically ordered. They are designed both for one person and for a team, or a whole department where each employee has his own role and responsibilities, and different employees depend on each other and communicate within a project.
Workflow diagrams help to organize and visualize both simple and complex projects. It is especially useful and relevant for complex multistage projects because gives an overview of the overall project timeline, objectives, and dependencies between project steps, helps all team members to understand the processes, makes common business ideas clear and overall business more efficient. Being simple and visual, Workflow charts easier communication in a company, help cooperate processes or tasks between team members, plan and design efficient business processes. It is a useful tool for each team member to understand project tasks and objectives, and the own role and responsibilities within the project.

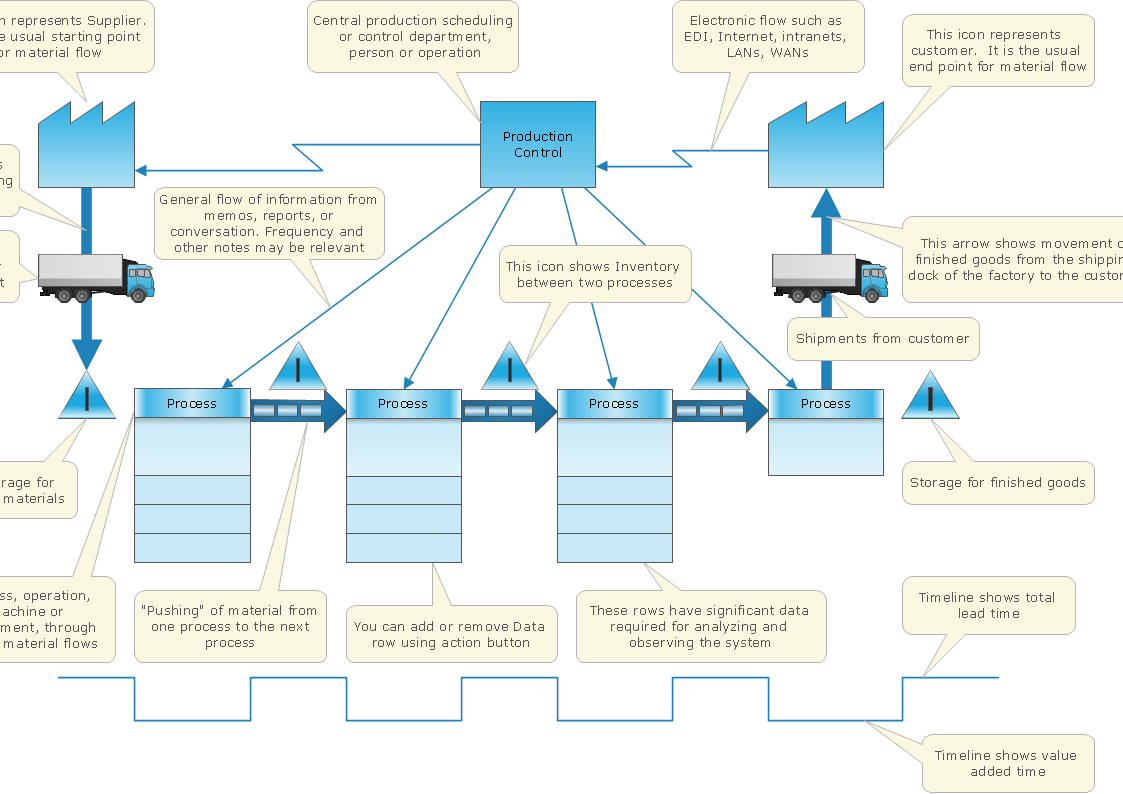
Example 1. Business Process and IT Systems
Workflow diagrams are useful in employee training and introducing new employees to business tasks. It is a good basis for business analysis and identification of critical and weak areas, inefficiencies of the process, and redundant activities with a goal to eliminate them and improve a business process. Workflow diagrams allow overseeing the entire process from beginning to end, automating and optimizing tasks, and incorporating changes to improve workflow and business operations. They help to respond timely to issues or problems, eliminate waste, and reduce operational expenses at increasing profits.
Key Components of Workflow Diagrams
Each process is reduced to three key components of Workflow Diagrams. These include inputs, outputs, and transformations, which are shown by boxes, lines, arrows, and other symbols. These components convey all required information about the processes in a workflow.
Inputs are the resources required to complete a process or a process step. These include materials, staff, equipment, data, information, and money. Transformations are the changes in the result of which the output is produced from the input. These include algorithms, changes in physical characteristics, location, ownership, and purpose. Outputs are the result of transformations, the end product or service. Most processes are a complex combination of these components.
Workflow diagrams depict process flows, tasks and tasks sequences, decision points, alternative paths, loops and return points. The workflows on the Business Process Flow Diagram are represented using a set of common symbols which let easy illustrate business processes and process flows, depict the start, all major steps, and end of the process, what data are used by the process, how the data flow through the business areas within scope of our project, how the tasks are executed and by who, and how workers interact with each other.

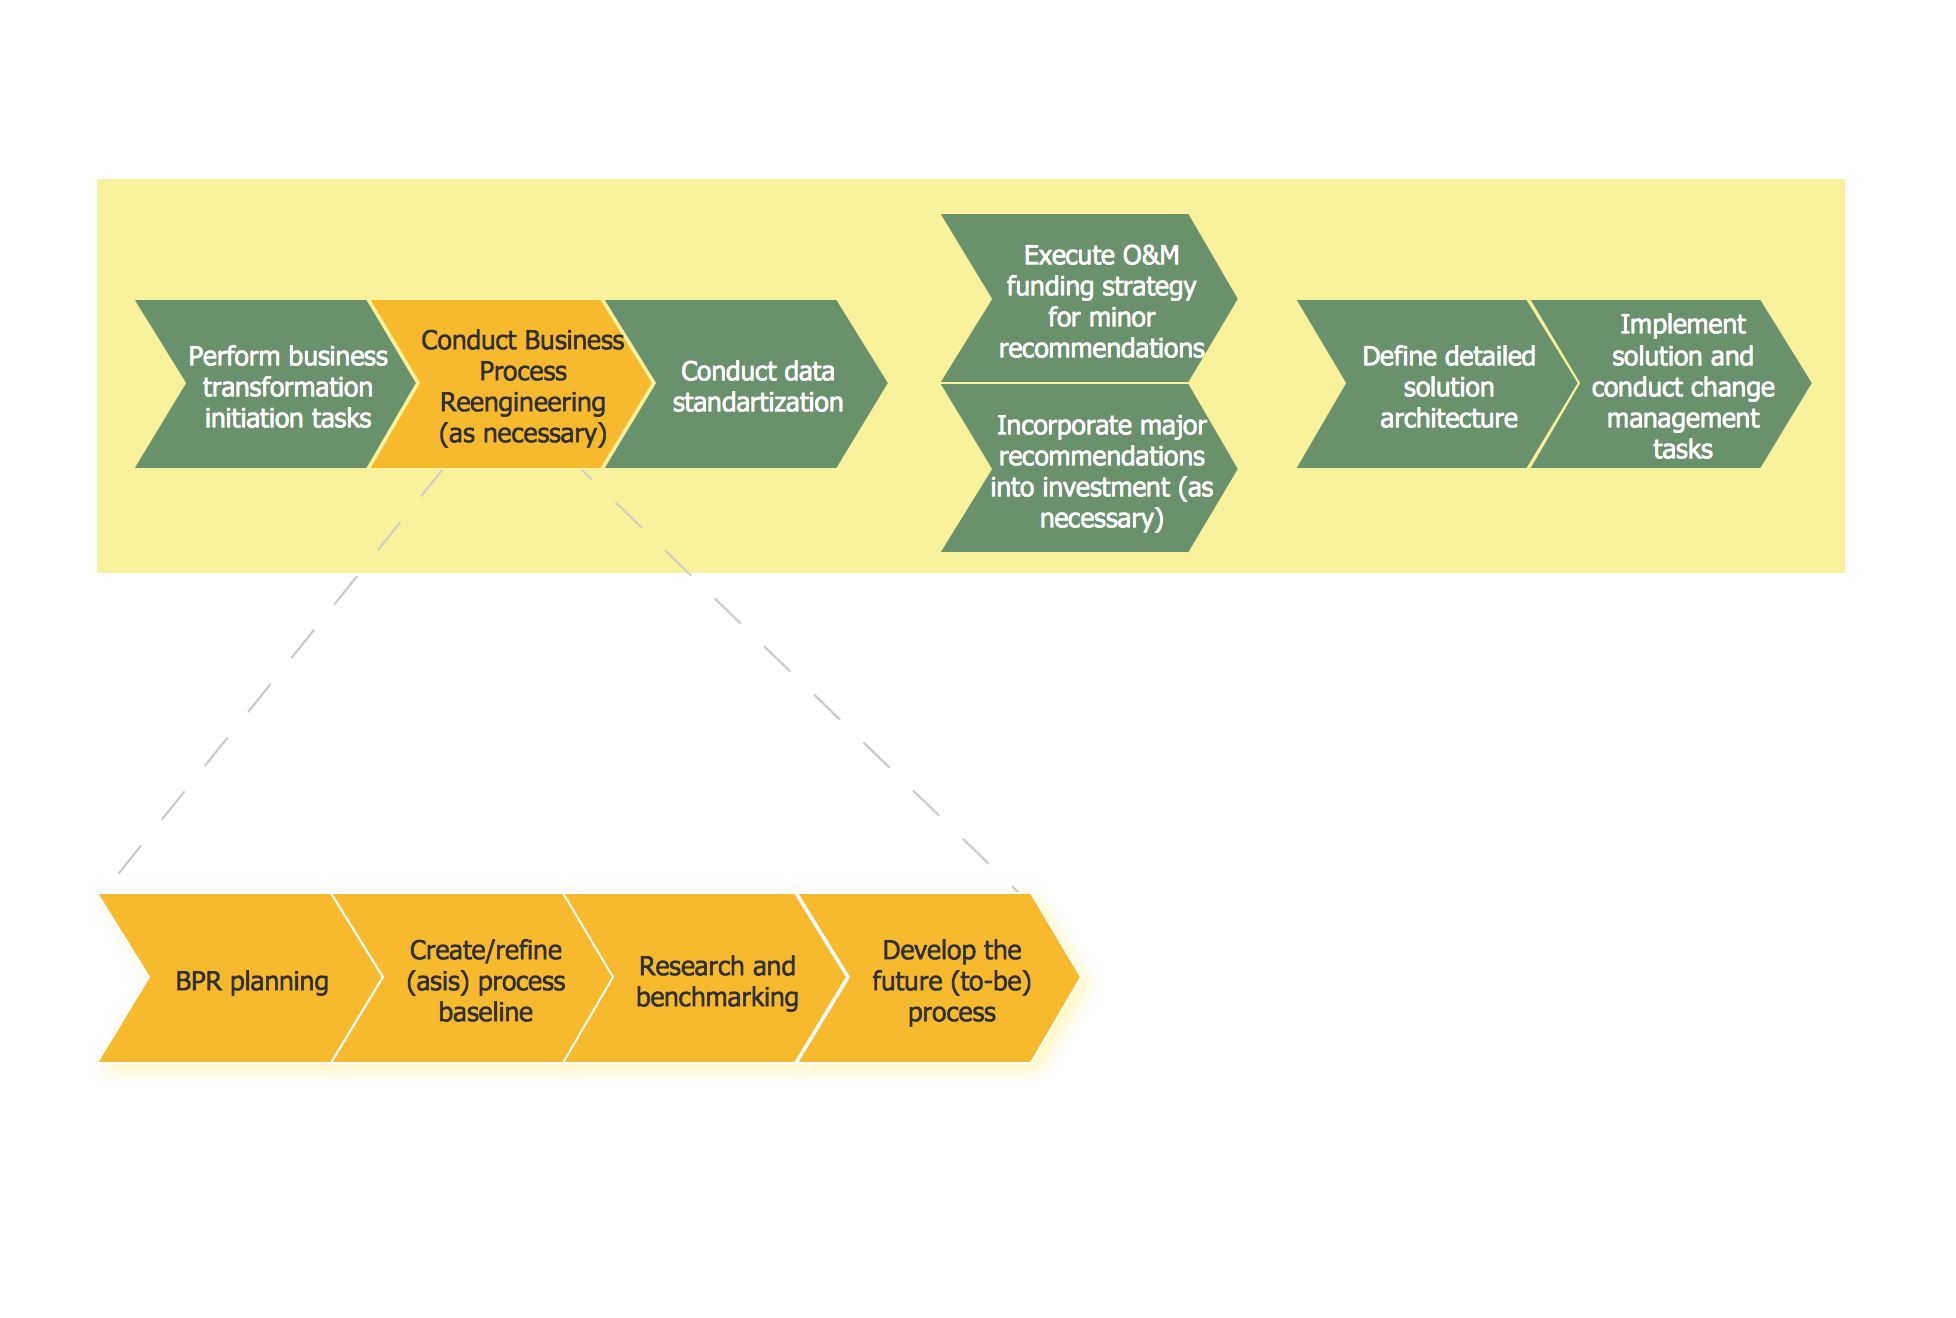
Example 2. Business Process Workflow Diagram
Process Steps and Activities
Workflow is organized as a series of activities necessary to complete a task. It is represented by a sequence of steps, actions, tasks, and activities that flow from its start to end, and that need to be taken during the decision-making process. These workflow steps or activities are represented by rectangles in a Workflow diagram and the building blocks of a business process.
Start and End Points
Each process flow has at least one starting and one ending point represented by oval shapes in a Workflow diagram. Before drawing a diagram and depicting the workflow process, determine the start and endpoints, and outline them in the diagram.
Decision Points and Branching
A decision point presents a choice, question, condition, or a combination of several conditions in a process, which define branching paths — the tasks or actions that will be implemented in each case or in each different direction, various possibilities in the outcome or subsequent system behavior after the decision point. The diamond shapes are used to display decision points in the Flowchart diagram. In Boolean algebra, 1 and 0 are used to indicate that some condition is true or false.
Connectors and Flow Lines
The flow lines, connectors, and arrows serve to show the process flow, the flow direction, and the sequence of process steps. Workflow lines and workflow line connectors join workflow elements together step-by-step, one object to at least one another with a line connector or arrow connector. Flow lines are often used when there are two or more different branching paths. All flow line connectors are attached to shapes and stay connected when the shapes are moved.
Business Process Flow Diagram Software
ConceptDraw DIAGRAM vector drawing software enhanced with Business Process Workflow Diagrams solution from the Business Processes area of ConceptDraw Solution Park is a powerful Business Process Flow Diagram software and a wide field for drawing activities and designing professional looking Business Process Workflow Diagrams.

Example 3. Business Flow Chart Design using ConceptDraw DIAGRAM BPMN Diagram Tool
Use Cases
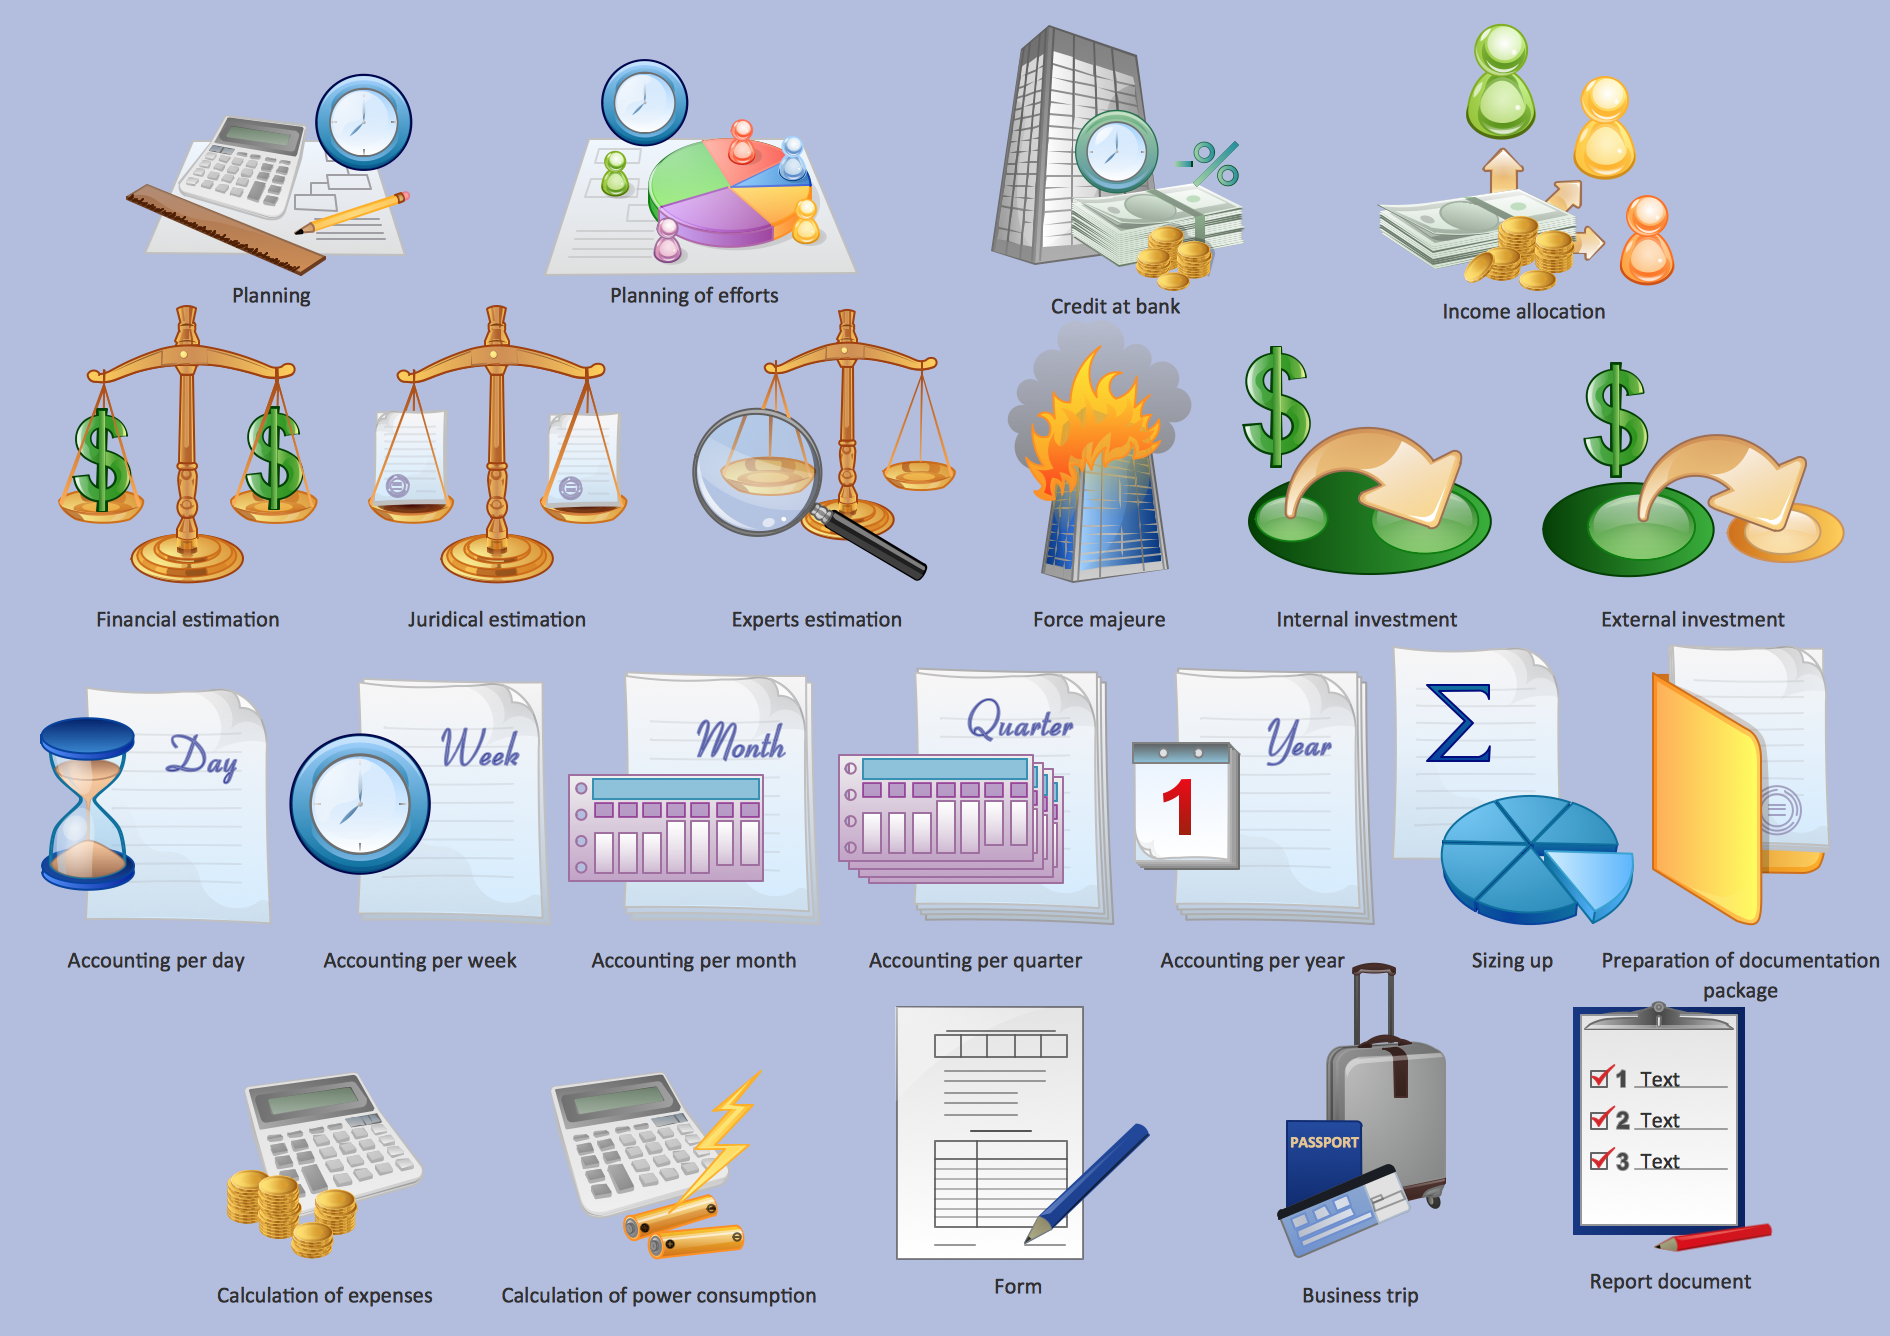
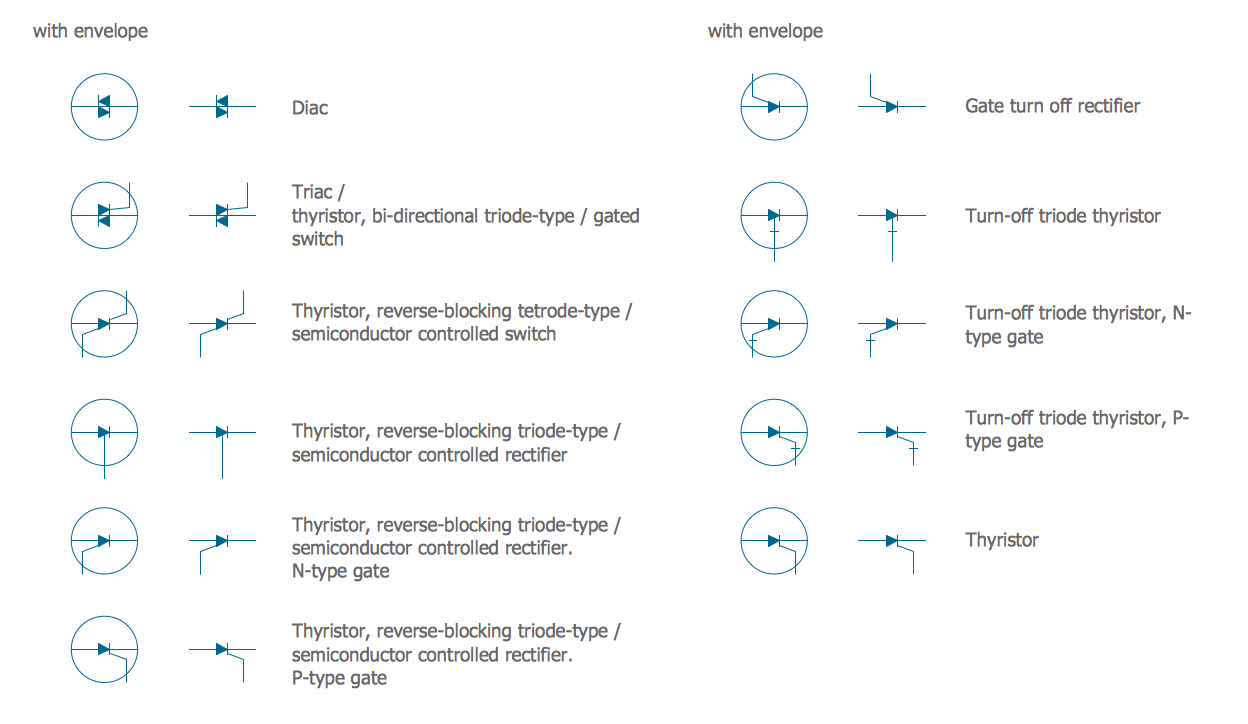
Business Process Workflow Diagrams solution offers 10 libraries with numerous predesigned vector objects, workflow symbols, icons, chart elements, arrows, connectors, and clipart. This collection lets greatly facilitate drawing process of Business Process Diagrams and Charts.


Each of this variety of objects is ready-to-use and vector, so you can resize it without loss of quality, change its color according to your taste, and add the text to the object.
How to Design Business Process Workflow Diagram
Follow the next simple steps to design your own Business Structure Flow Chart or Business Workflow Diagram in minutes using ConceptDraw DIAGRAM BPMN diagram maker:
- Launch ConceptDraw DIAGRAM business flow diagram software.
- Set a page orientation: File – Page Setup – Horizontal Orientation – Ok.


- In the Business Process Workflow Diagrams Solution, open the libraries containing the necessary shapes:
- Workflow arrows
- Workflow charts
- Workflow marketing and sales


- Take the Process Object from the Workflow charts library. Place it on the page.

- Using Control dots to change the size.

- Holding down the Option key (ALT), copy the object. Place it on the page.

- Click the object – add the text.

- Using Cmd+A select all the objects. Choose Align option on the Toolbar – Align Center.

- Distribute option on the Toolbar – Middle.

- Holding down the Shift key, deselect IT-Systems block.

- Open Inspectors – Fill tab – Change color.

- Open Inspectors – Text tab – Change color, font size.

- Select IT-Systems block. Open Inspectors – Fill tab – Change color.

- Open Inspectors – Text tab – Change font size.

- Using Cmd+A, select all the objects. Shape – Group or Cmd+G.

- Take the Process object from the Workflow charts library. Place it on the page.
- Select the object group and the Process object. Shape – Make Same – Height.

- Align option on the Toolbar – Align Center.

- Using Control dots, adjust the necessary Weight.

- Ungroup the group. Shape – Ungroup or Cmd+U.

- Select the Process object – Inspectors – Fill tab – Change color.

- Add the text. Open Inspectors – Text tab –Change font size.

- Move the Text box to the top using yellow diamond in the center of the object.

- Take one more Process Object from the Workflow charts library. Place it on the page.

- Adjust the object size using control dots. Align Middle with Corporate Strategy/Management block.

- Add the text. Open Inspectors – Text tab – Change font size, change color.

- Open Inspectors – Fill tab – Make color same as Customers block using Eyedropper.

- Take the Arrow left object from the Workflow arrows library. Place it on the page to show direction of the process.

- Adjust the object size using control dots. Align Middle with Business Processes block.

- Select Arrow object – Right click – Object – Send to Back.

- Take the Arrow right object from the Workflow arrows library. Place it on the diagram.
- Holding down the Option key (ALT), copy the object. Place it on the page.

- Select all the Arrow objects – Shape – Make Same – Size.

- Select all right Arrow objects – Right click – Object – Send to Back.

- Select all the Arrow objects – Inspectors – Fill tab – Change color.

- Take the Arrow up object from the Workflow arrows library. Place it on the diagram.

- Holding down the Option key (ALT), copy the object. Place it on the page.
- Select all the Arrow up objects – Right click – Object – Send to Back.

- Align – Align Middle.

- Take the Customers object from the Workflow marketing and sales library. Place it on the diagram.

- Take the Triangle down object from the Workflow charts library. Place it on Business Processes Block.

- Adjust object size using Control dots. Add the text.

- File – Document Properties – Page Size – Adjust to Drawing Contents – Ok.
- Now your Drawing - Flow Chart of business process is ready.

- You may save it or export to different formats via the File Menu.


Business Process Workflow Diagram Examples
Business Process Workflow Diagrams solution contains wide set of predesigned examples and samples of Business Process Workflow and Business Process diagrams and infographics. All they are offered at ConceptDraw STORE and can be used as the excellent base for your own Business Process Diagrams.

Example 4. Business Process Workflow Diagram — Life Cycle of an ASAM Standard
Each of Business Flow Diagram example and Business Flow Chart sample included to Business Process Workflow Diagrams solution is professionally designed and carefully thought-out by experts. Besides they are colorful and attractive, and can be successfully used in your work, education, scientific, and any other activity, during the discussions, conferences and meetings with colleagues.

Example 5. Business Process Flow Diagram — Structure and Analysis
Benefits of Using Workflow Diagrams in Business
Workflow Diagrams provide a wide variety of benefits in business where documenting is an efficient way to outline and clarify information and keep the team informed and engaged with project objectives and tasks. Workflow Diagrams streamline process documentation and training and ensure that process documentation is accurate and up to date. They clarify the business processes and key objectives, improve communication and collaboration in business, and enhance process efficiency due to clear and visual outlining of tasks and events involved in a process.
They are especially helpful for complex processes and large companies when it is necessary to improve collaboration between separate departments and establish communication without breakdowns. Workflow diagrams help to ensure consistency and predictability of outcomes, detect and eliminate bottlenecks and other problems, unnecessary steps, roles, activities, and other inefficiencies, exclude redundant steps, uncover and manage vulnerabilities, elliminate overload areas.
Workflow diagrams visually break down complex projects and processes in simple steps, clarify what each step in your process is, improve team communication, and optimize resource usage throughout the business. They are an efficient way to analyze and detect areas of automation to optimize processes, eliminate risks, improve revenues, and save project resources, including budget, time, materials, skills, etc. Because standardization and automatization processes decrease occurring errors.
Workflow diagrams are an efficient way to improve business processes and business operations, team collaboration, streamline and optimize workflows to complete them faster and more qualitative, and guarantee that the tasks are completed by the proper people, in the proper order, and timely. Workflow diagrams simplify problem-solving, make decision-making more fundamental and more justified, and support successful outcomes.
Summary
The following features make ConceptDraw DIAGRAM the best Business Process Diagram Software:
You don't need to be an artist to draw professional looking diagrams in a few minutes.
Large quantity of ready-to-use vector objects makes your drawing diagrams quick and easy.
Great number of predesigned templates and samples give you the good start for your own diagrams.
ConceptDraw DIAGRAM provides you the possibility to use the grid, rules and guides. You can easily rotate, group, align, arrange the objects, use different fonts and colors to make your diagram exceptionally looking.
All ConceptDraw DIAGRAM documents are vector graphic files and are available for reviewing, modifying, and converting to a variety of formats: image, HTML, PDF file, MS PowerPoint Presentation, Adobe Flash, MS Visio.
Using ConceptDraw STORE you can navigate through ConceptDraw Solution Park, managing downloads and updates. You can access libraries, templates and samples directly from the ConceptDraw STORE.
Using ConceptDraw STORE you can navigate through ConceptDraw Solution Park, managing downloads and updates. You can access libraries, templates and samples directly from the ConceptDraw STORE. If you have any questions, our free of charge support is always ready to come to your aid.