
Example 1. Organization Structure
25 Typical Orgcharts Solution offers a number of tools for effective illustrating the Organization Structure Chart to build then successful business organization.
Two vector shape libraries of 25 Typical Orgcharts Solution will be useful for you. They include all the graphics and icons needed for quick and effective drawing.

Example 2. 25 Typical Orgcharts Solution in ConceptDraw STORE
25 Typical Orgcharts Solution includes also 25 templates and 10 samples specially developed for ConceptDraw DIAGRAM users and available from ConceptDraw STORE.

Example 3. Us Navy Shore Establishment Org Chart
The organization structure samples you see on this page were created in ConceptDraw DIAGRAM software on the base of predesigned templates from 25 Typical Orgcharts Solution for ConceptDraw DIAGRAM Solution Park. An experienced user spent 10 minutes creating each of them.
Use the 25 Typical Orgcharts Solution for ConceptDraw DIAGRAM software for effective organizational management, for fast and easy creation your own professional looking Organizational Structure Charts of any complexity.
All source documents are vector graphic documents. They are available for reviewing, modifying, or converting to a variety of formats (PDF file, MS PowerPoint, MS Visio, and many other graphic formats) from the ConceptDraw STORE. The 25 Typical Orgcharts Solution is available for all ConceptDraw DIAGRAM users.
TEN RELATED HOW TO's:
When deciding to start your own business, you have to take into account a bunch of different aspects. One of the ways to get inspired is to look through various restaurant floor plans samples or interior photos of already known establishments. This will help you, but keep in mind that a really unforgettable establishment must be unique.
This restaurant floor plan diagram was designed using ConceptDraw Cafe and Restaurant Floor Plan solution. It can be used as a sample while considering a custom restaurant design. With the help of this example you can estimate the amount of furniture best for a dining room or kitchen of the restaurant. In addition, this plan would be useful as a check list when you will consider a list of the furniture and equipment needed for all areas of the future restaurant.
Picture: Restaurant Floor Plans Samples
Related Solution:
ConceptDraw DIAGRAM diagramming and vector drawing software enhanced with powerful HR Flowcharts Solution perfectly suits for Human Resource Management.
Picture: Human Resource Management
Related Solution:
ConceptDraw Solution Park creates a single information space for messaging to teams. PM Teams provides project participants and organizations with better tools that assist in task understanding, timeframe understanding, and project events in the entire organization. Improved communication fosters positive team spirit throughout.
Picture: Org Chart Diagram
Related Solution:
ConceptDraw is a good means of visualization of information of any kind as it features powerful graphic capabilities. The conception of using ConceptDraw and open formats by the programs that work with Internet can be used for displaying any data and any structure in Internet.
Picture: Internet solutions with ConceptDraw DIAGRAM
Different organizations have different organizational structures. Matrix organization is one of the most popular and widely used type of organizational structure. Use ConceptDraw DIAGRAM diagramming and vector drawing software extended with 25 Typical Orgcharts solution from the Management area of ConceptDraw Solution Park for fast and easy designing matrix organizational chart for your company.
Picture: Matrix Organization
Related Solution:
For those who want to know what is a cross functional flowchart and how to draw it, we preared a special library and professional looking templates.
Take all the advantage of your drawing software to learn and create such a well-designed flowcharts.
Watch the HowTo video to learn more.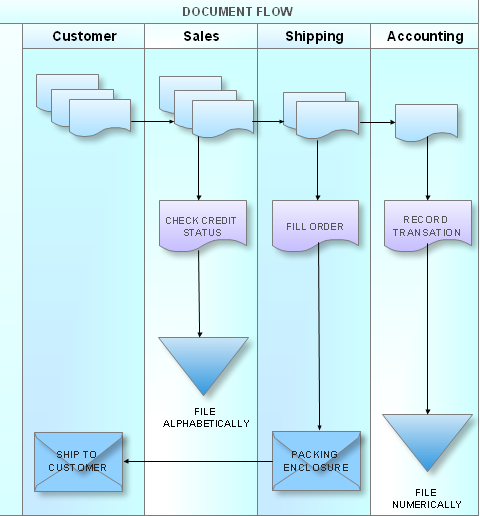
Picture: What is a Cross Functional Flow Chart?
While creating flowcharts and process flow diagrams, you should use special objects to define different statements, so anyone aware of flowcharts can get your scheme right. There is a short and an extended list of basic flowchart symbols and their meaning. Basic flowchart symbols include terminator objects, rectangles for describing steps of a process, diamonds representing appearing conditions and questions and parallelograms to show incoming data.
This diagram gives a general review of the standard symbols that are used when creating flowcharts and process flow diagrams. The practice of using a set of standard flowchart symbols was admitted in order to make flowcharts and other process flow diagrams created by any person properly understandable by other people. The flowchart symbols depict different kinds of actions and phases in a process. The sequence of the actions, and the relationships between them are shown by special lines and arrows. There are a large number of flowchart symbols. Which of them can be used in the particular diagram depends on its type. For instance, some symbols used in data flow diagrams usually are not used in the process flowcharts. Business process system use exactly these flowchart symbols.
Picture: Flowchart Symbols: Meaning and Examples
Related Solution:
Mind map template of a strategy map that can help you display a variety of performance measures that can have an impact on your organization.
Picture: SWOT Analysis
Related Solution:
A competent delegation of responsibilities between workers guarantees business success in most cases. At first sight, it might seem that workflow diagram symbols are quite similar to a regular flowchart. But workflow diagram is a more accurate way to present working processes.
Workflow diagrams are helpful for a working process analyzation, to depict a pathway of process issues, personalize responsibilities and identify resources that will help to optimize a workflow. Generally, Workflow diagram deploys flowchart symbols for displaying work process steps and relationships. But, often it require some additions and improvements to become more professional and illustrative. The Workflow solution for ConceptDraw DIAGRAM provides the user with a big library of symbols that are designed especially for workflow diagrams.
Picture: Workflow Diagram Symbols
Related Solution:
ConceptDraw MINDMAP with the ability to import presentations from Microsoft PowerPoint, as well as enhancing its existing presentation capabilities.
Picture: Best Mind Mapping Program for Making Presentations
Related Solution:

 Library")

